Immigrants from Eastern Europe vs Immigrants from El Salvador Unemployment Among Ages 30 to 34 years
COMPARE
Immigrants from Eastern Europe
Immigrants from El Salvador
Unemployment Among Ages 30 to 34 years
Unemployment Among Ages 30 to 34 years Comparison
Immigrants from Eastern Europe
Immigrants from El Salvador
5.3%
UNEMPLOYMENT AMONG AGES 30 TO 34 YEARS
77.4/ 100
METRIC RATING
131st/ 347
METRIC RANK
6.0%
UNEMPLOYMENT AMONG AGES 30 TO 34 YEARS
0.5/ 100
METRIC RATING
241st/ 347
METRIC RANK
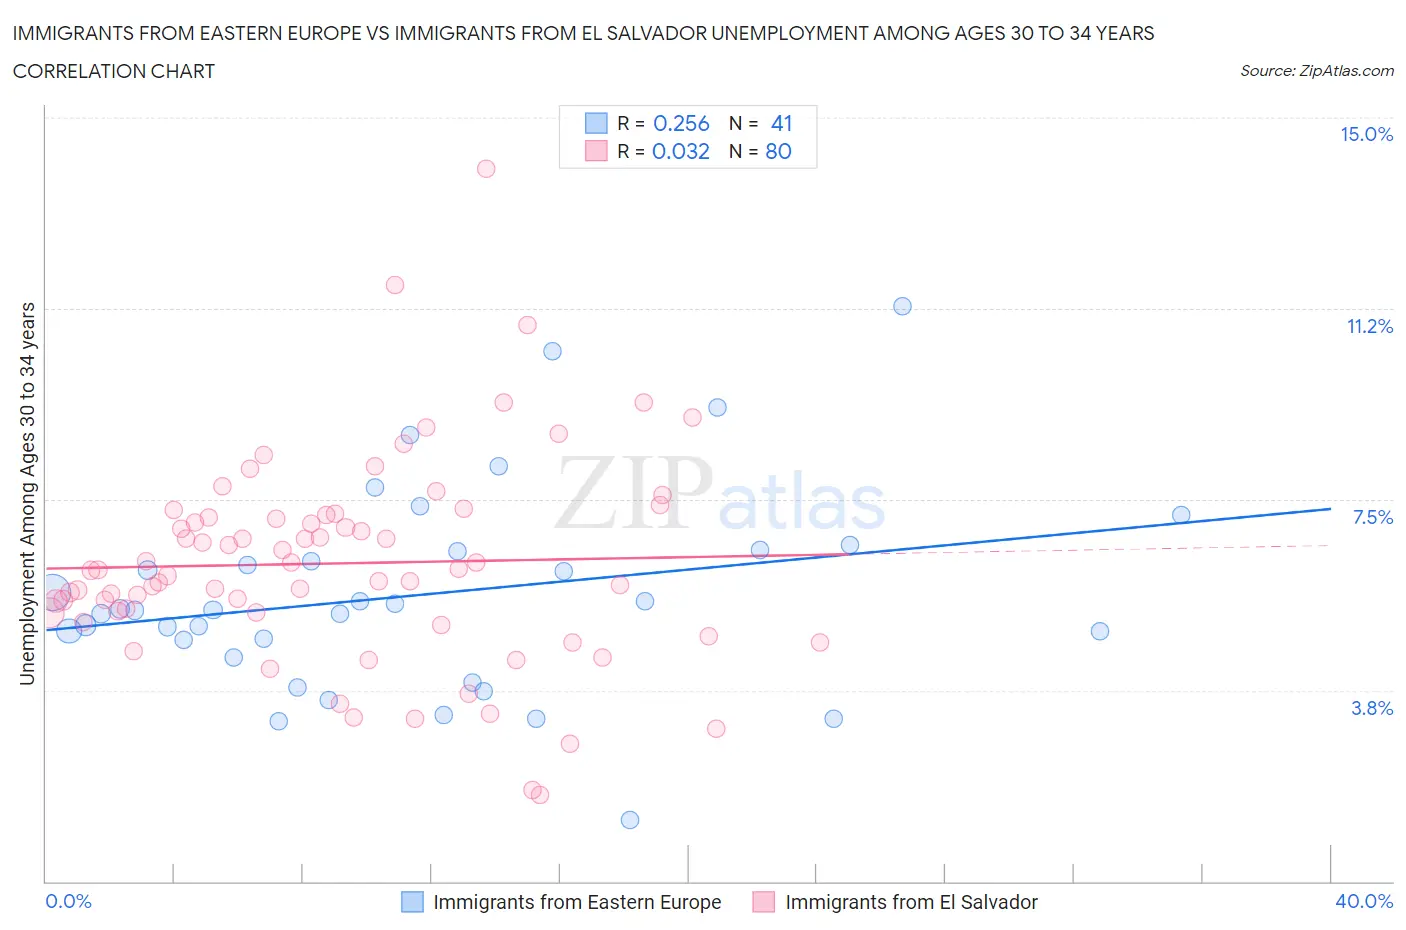
Immigrants from Eastern Europe vs Immigrants from El Salvador Unemployment Among Ages 30 to 34 years Correlation Chart
The statistical analysis conducted on geographies consisting of 436,944,798 people shows a weak positive correlation between the proportion of Immigrants from Eastern Europe and unemployment rate among population between the ages 30 and 34 in the United States with a correlation coefficient (R) of 0.256 and weighted average of 5.3%. Similarly, the statistical analysis conducted on geographies consisting of 342,139,842 people shows no correlation between the proportion of Immigrants from El Salvador and unemployment rate among population between the ages 30 and 34 in the United States with a correlation coefficient (R) of 0.032 and weighted average of 6.0%, a difference of 11.7%.
Unemployment Among Ages 30 to 34 years Correlation Summary
| Measurement | Immigrants from Eastern Europe | Immigrants from El Salvador |
| Minimum | 1.2% | 1.7% |
| Maximum | 11.3% | 14.0% |
| Range | 10.1% | 12.3% |
| Mean | 5.6% | 6.2% |
| Median | 5.3% | 6.1% |
| Interquartile 25% (IQ1) | 4.6% | 5.3% |
| Interquartile 75% (IQ3) | 6.5% | 7.2% |
| Interquartile Range (IQR) | 1.9% | 1.9% |
| Standard Deviation (Sample) | 2.0% | 2.0% |
| Standard Deviation (Population) | 2.0% | 2.0% |
Similar Demographics by Unemployment Among Ages 30 to 34 years
Demographics Similar to Immigrants from Eastern Europe by Unemployment Among Ages 30 to 34 years
In terms of unemployment among ages 30 to 34 years, the demographic groups most similar to Immigrants from Eastern Europe are Carpatho Rusyn (5.3%, a difference of 0.010%), Immigrants from Northern Europe (5.3%, a difference of 0.010%), German (5.3%, a difference of 0.040%), Bangladeshi (5.3%, a difference of 0.080%), and Polish (5.3%, a difference of 0.14%).
| Demographics | Rating | Rank | Unemployment Among Ages 30 to 34 years |
| Immigrants | Brazil | 80.8 /100 | #124 | Excellent 5.3% |
| Greeks | 80.4 /100 | #125 | Excellent 5.3% |
| Immigrants | Sri Lanka | 80.2 /100 | #126 | Excellent 5.3% |
| Taiwanese | 79.4 /100 | #127 | Good 5.3% |
| Immigrants | Uruguay | 79.3 /100 | #128 | Good 5.3% |
| Poles | 78.8 /100 | #129 | Good 5.3% |
| Germans | 77.8 /100 | #130 | Good 5.3% |
| Immigrants | Eastern Europe | 77.4 /100 | #131 | Good 5.3% |
| Carpatho Rusyns | 77.3 /100 | #132 | Good 5.3% |
| Immigrants | Northern Europe | 77.3 /100 | #133 | Good 5.3% |
| Bangladeshis | 76.6 /100 | #134 | Good 5.3% |
| Palestinians | 75.1 /100 | #135 | Good 5.4% |
| Pakistanis | 74.6 /100 | #136 | Good 5.4% |
| Immigrants | Canada | 74.6 /100 | #137 | Good 5.4% |
| Serbians | 72.9 /100 | #138 | Good 5.4% |
Demographics Similar to Immigrants from El Salvador by Unemployment Among Ages 30 to 34 years
In terms of unemployment among ages 30 to 34 years, the demographic groups most similar to Immigrants from El Salvador are Salvadoran (6.0%, a difference of 0.070%), Guatemalan (6.0%, a difference of 0.22%), Immigrants from Liberia (6.0%, a difference of 0.28%), Immigrants from Nigeria (6.0%, a difference of 0.33%), and Mexican American Indian (5.9%, a difference of 0.41%).
| Demographics | Rating | Rank | Unemployment Among Ages 30 to 34 years |
| Portuguese | 0.8 /100 | #234 | Tragic 5.9% |
| Yaqui | 0.7 /100 | #235 | Tragic 5.9% |
| Native Hawaiians | 0.7 /100 | #236 | Tragic 5.9% |
| Central Americans | 0.6 /100 | #237 | Tragic 5.9% |
| Mexican American Indians | 0.6 /100 | #238 | Tragic 5.9% |
| Immigrants | Nigeria | 0.6 /100 | #239 | Tragic 6.0% |
| Salvadorans | 0.5 /100 | #240 | Tragic 6.0% |
| Immigrants | El Salvador | 0.5 /100 | #241 | Tragic 6.0% |
| Guatemalans | 0.4 /100 | #242 | Tragic 6.0% |
| Immigrants | Liberia | 0.4 /100 | #243 | Tragic 6.0% |
| Immigrants | Micronesia | 0.3 /100 | #244 | Tragic 6.0% |
| Sub-Saharan Africans | 0.3 /100 | #245 | Tragic 6.0% |
| Ghanaians | 0.3 /100 | #246 | Tragic 6.0% |
| Nigerians | 0.3 /100 | #247 | Tragic 6.0% |
| Immigrants | Guatemala | 0.3 /100 | #248 | Tragic 6.0% |