Immigrants from Dominican Republic vs Immigrants from Bangladesh Disability Age 18 to 34
COMPARE
Immigrants from Dominican Republic
Immigrants from Bangladesh
Disability Age 18 to 34
Disability Age 18 to 34 Comparison
Immigrants from Dominican Republic
Immigrants from Bangladesh
6.4%
DISABILITY AGE 18 TO 34
82.7/ 100
METRIC RATING
150th/ 347
METRIC RANK
5.6%
DISABILITY AGE 18 TO 34
100.0/ 100
METRIC RATING
20th/ 347
METRIC RANK
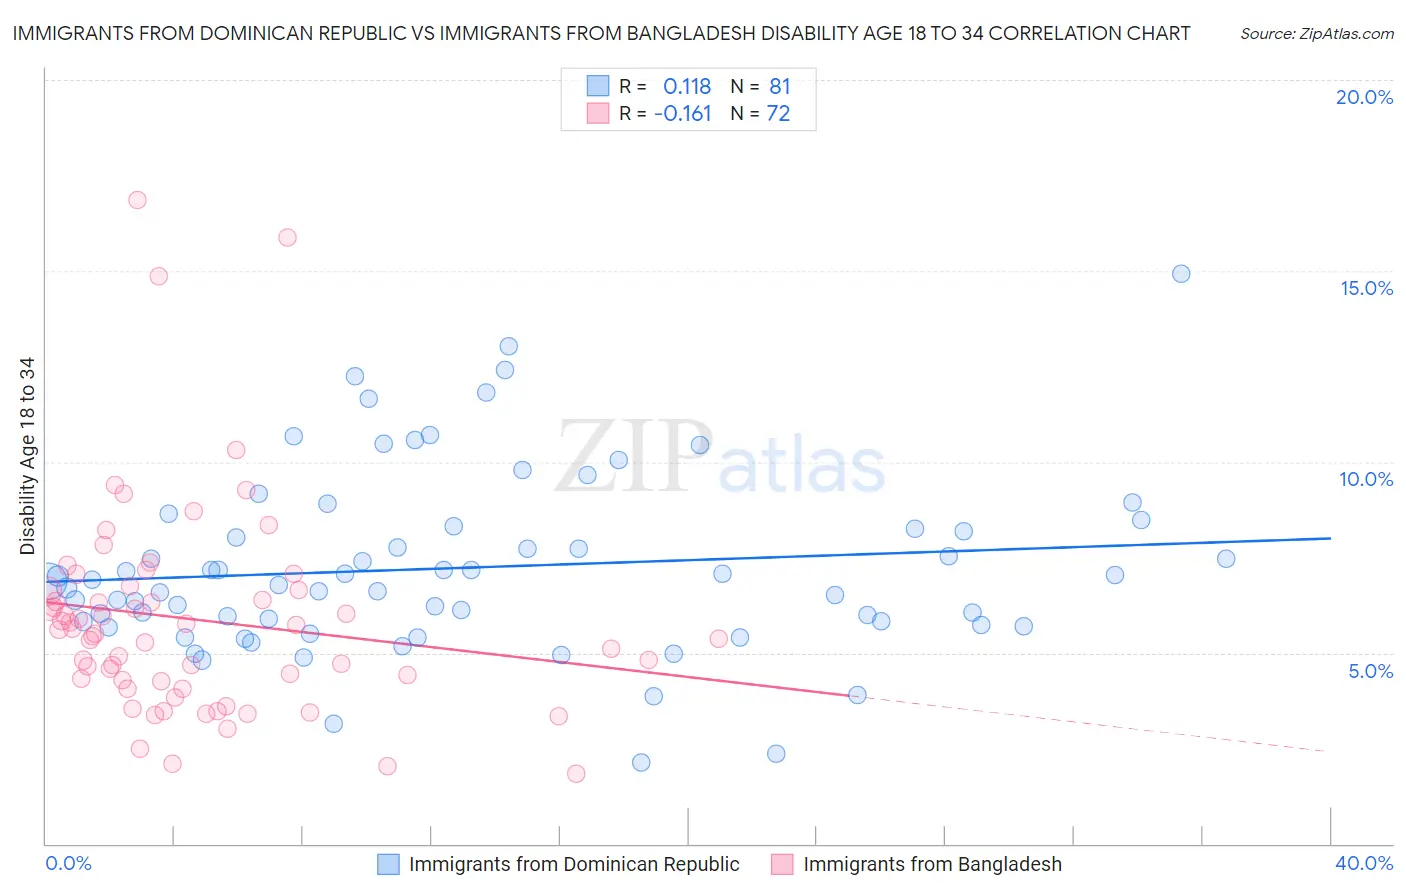
Immigrants from Dominican Republic vs Immigrants from Bangladesh Disability Age 18 to 34 Correlation Chart
The statistical analysis conducted on geographies consisting of 274,679,116 people shows a poor positive correlation between the proportion of Immigrants from Dominican Republic and percentage of population with a disability between the ages 18 and 35 in the United States with a correlation coefficient (R) of 0.118 and weighted average of 6.4%. Similarly, the statistical analysis conducted on geographies consisting of 203,579,264 people shows a poor negative correlation between the proportion of Immigrants from Bangladesh and percentage of population with a disability between the ages 18 and 35 in the United States with a correlation coefficient (R) of -0.161 and weighted average of 5.6%, a difference of 13.9%.
Disability Age 18 to 34 Correlation Summary
| Measurement | Immigrants from Dominican Republic | Immigrants from Bangladesh |
| Minimum | 2.1% | 1.8% |
| Maximum | 14.9% | 16.9% |
| Range | 12.8% | 15.0% |
| Mean | 7.2% | 5.9% |
| Median | 6.9% | 5.5% |
| Interquartile 25% (IQ1) | 5.8% | 4.3% |
| Interquartile 75% (IQ3) | 8.3% | 6.6% |
| Interquartile Range (IQR) | 2.5% | 2.3% |
| Standard Deviation (Sample) | 2.4% | 2.8% |
| Standard Deviation (Population) | 2.4% | 2.8% |
Similar Demographics by Disability Age 18 to 34
Demographics Similar to Immigrants from Dominican Republic by Disability Age 18 to 34
In terms of disability age 18 to 34, the demographic groups most similar to Immigrants from Dominican Republic are Honduran (6.4%, a difference of 0.040%), Immigrants from Belgium (6.4%, a difference of 0.10%), Tongan (6.4%, a difference of 0.10%), Immigrants from South Africa (6.4%, a difference of 0.12%), and Belizean (6.4%, a difference of 0.28%).
| Demographics | Rating | Rank | Disability Age 18 to 34 |
| Immigrants | Latvia | 86.4 /100 | #143 | Excellent 6.4% |
| Albanians | 85.3 /100 | #144 | Excellent 6.4% |
| Moroccans | 85.2 /100 | #145 | Excellent 6.4% |
| Belizeans | 84.9 /100 | #146 | Excellent 6.4% |
| Immigrants | South Africa | 83.7 /100 | #147 | Excellent 6.4% |
| Immigrants | Belgium | 83.5 /100 | #148 | Excellent 6.4% |
| Hondurans | 83.1 /100 | #149 | Excellent 6.4% |
| Immigrants | Dominican Republic | 82.7 /100 | #150 | Excellent 6.4% |
| Tongans | 81.9 /100 | #151 | Excellent 6.4% |
| Bulgarians | 78.3 /100 | #152 | Good 6.5% |
| Immigrants | Eritrea | 77.4 /100 | #153 | Good 6.5% |
| Immigrants | Central America | 76.8 /100 | #154 | Good 6.5% |
| Inupiat | 76.7 /100 | #155 | Good 6.5% |
| Immigrants | Panama | 75.3 /100 | #156 | Good 6.5% |
| Immigrants | Sierra Leone | 75.0 /100 | #157 | Good 6.5% |
Demographics Similar to Immigrants from Bangladesh by Disability Age 18 to 34
In terms of disability age 18 to 34, the demographic groups most similar to Immigrants from Bangladesh are Thai (5.6%, a difference of 0.17%), Immigrants from Bolivia (5.6%, a difference of 0.24%), Immigrants from South Central Asia (5.7%, a difference of 0.58%), Immigrants from Nicaragua (5.7%, a difference of 0.65%), and Immigrants from Eastern Asia (5.6%, a difference of 1.0%).
| Demographics | Rating | Rank | Disability Age 18 to 34 |
| Immigrants | Iran | 100.0 /100 | #13 | Exceptional 5.5% |
| Indians (Asian) | 100.0 /100 | #14 | Exceptional 5.5% |
| Immigrants | India | 100.0 /100 | #15 | Exceptional 5.6% |
| Immigrants | Israel | 100.0 /100 | #16 | Exceptional 5.6% |
| Immigrants | Eastern Asia | 100.0 /100 | #17 | Exceptional 5.6% |
| Immigrants | Bolivia | 100.0 /100 | #18 | Exceptional 5.6% |
| Thais | 100.0 /100 | #19 | Exceptional 5.6% |
| Immigrants | Bangladesh | 100.0 /100 | #20 | Exceptional 5.6% |
| Immigrants | South Central Asia | 100.0 /100 | #21 | Exceptional 5.7% |
| Immigrants | Nicaragua | 100.0 /100 | #22 | Exceptional 5.7% |
| Cubans | 100.0 /100 | #23 | Exceptional 5.7% |
| Immigrants | Argentina | 100.0 /100 | #24 | Exceptional 5.7% |
| Immigrants | Singapore | 100.0 /100 | #25 | Exceptional 5.7% |
| Immigrants | Colombia | 100.0 /100 | #26 | Exceptional 5.7% |
| Immigrants | Venezuela | 99.9 /100 | #27 | Exceptional 5.7% |