Immigrants from Cuba vs Mexican Cognitive Disability
COMPARE
Immigrants from Cuba
Mexican
Cognitive Disability
Cognitive Disability Comparison
Immigrants from Cuba
Mexicans
16.3%
COGNITIVE DISABILITY
100.0/ 100
METRIC RATING
21st/ 347
METRIC RANK
17.8%
COGNITIVE DISABILITY
1.1/ 100
METRIC RATING
241st/ 347
METRIC RANK
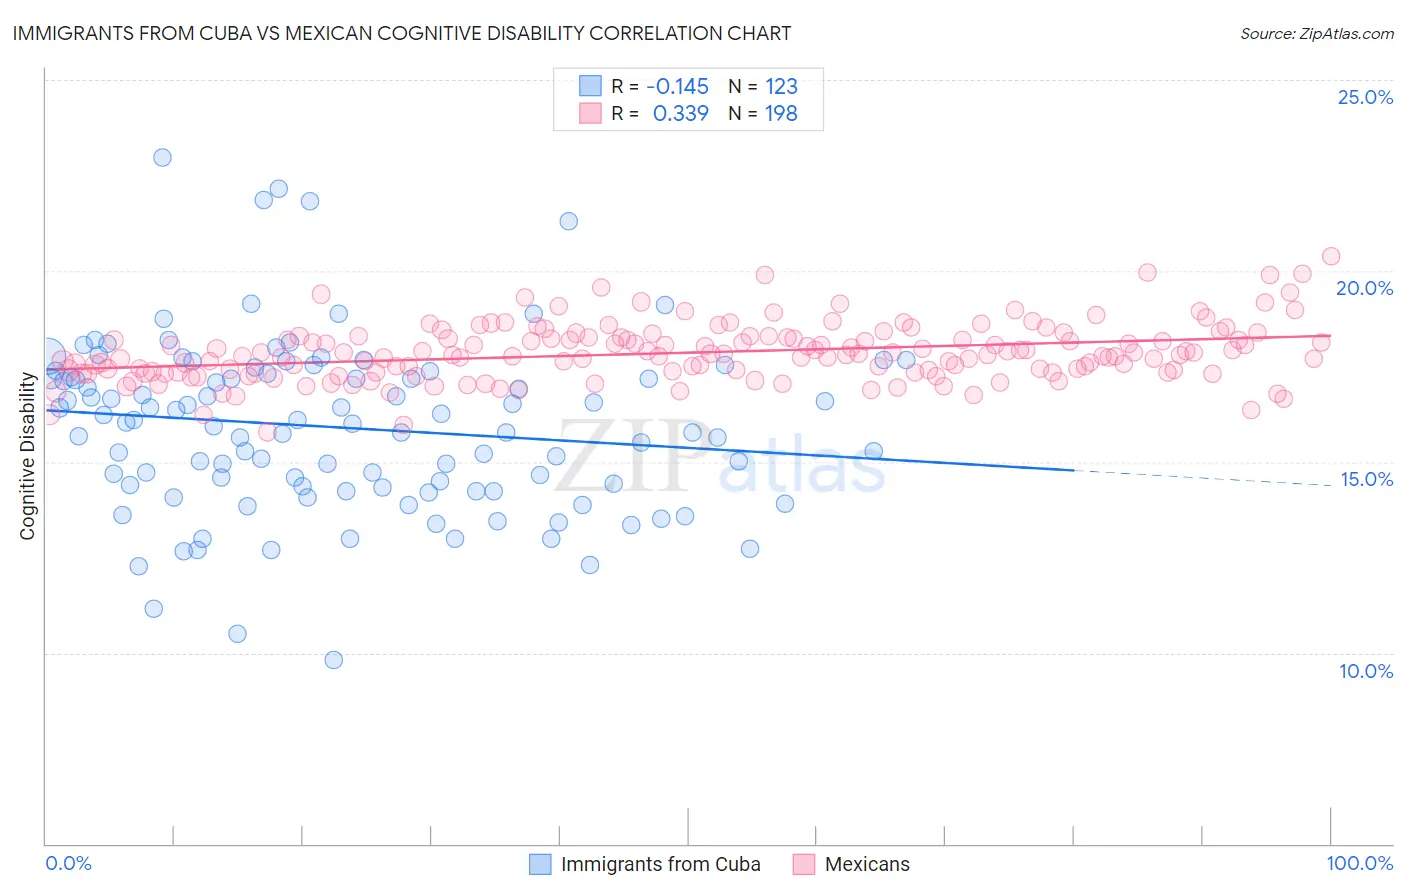
Immigrants from Cuba vs Mexican Cognitive Disability Correlation Chart
The statistical analysis conducted on geographies consisting of 325,949,473 people shows a poor negative correlation between the proportion of Immigrants from Cuba and percentage of population with cognitive disability in the United States with a correlation coefficient (R) of -0.145 and weighted average of 16.3%. Similarly, the statistical analysis conducted on geographies consisting of 565,048,688 people shows a mild positive correlation between the proportion of Mexicans and percentage of population with cognitive disability in the United States with a correlation coefficient (R) of 0.339 and weighted average of 17.8%, a difference of 9.1%.
Cognitive Disability Correlation Summary
| Measurement | Immigrants from Cuba | Mexican |
| Minimum | 9.8% | 15.8% |
| Maximum | 23.0% | 20.4% |
| Range | 13.2% | 4.6% |
| Mean | 15.9% | 17.9% |
| Median | 16.0% | 17.8% |
| Interquartile 25% (IQ1) | 14.3% | 17.3% |
| Interquartile 75% (IQ3) | 17.3% | 18.2% |
| Interquartile Range (IQR) | 3.0% | 0.90% |
| Standard Deviation (Sample) | 2.3% | 0.75% |
| Standard Deviation (Population) | 2.3% | 0.75% |
Similar Demographics by Cognitive Disability
Demographics Similar to Immigrants from Cuba by Cognitive Disability
In terms of cognitive disability, the demographic groups most similar to Immigrants from Cuba are Bulgarian (16.3%, a difference of 0.040%), Immigrants from Northern Europe (16.3%, a difference of 0.060%), Immigrants from Bolivia (16.3%, a difference of 0.060%), Immigrants from North Macedonia (16.3%, a difference of 0.12%), and Immigrants from South Central Asia (16.4%, a difference of 0.13%).
| Demographics | Rating | Rank | Cognitive Disability |
| Immigrants | Austria | 100.0 /100 | #14 | Exceptional 16.3% |
| Immigrants | Greece | 100.0 /100 | #15 | Exceptional 16.3% |
| Eastern Europeans | 100.0 /100 | #16 | Exceptional 16.3% |
| Immigrants | North Macedonia | 100.0 /100 | #17 | Exceptional 16.3% |
| Immigrants | Northern Europe | 100.0 /100 | #18 | Exceptional 16.3% |
| Immigrants | Bolivia | 100.0 /100 | #19 | Exceptional 16.3% |
| Bulgarians | 100.0 /100 | #20 | Exceptional 16.3% |
| Immigrants | Cuba | 100.0 /100 | #21 | Exceptional 16.3% |
| Immigrants | South Central Asia | 99.9 /100 | #22 | Exceptional 16.4% |
| Croatians | 99.9 /100 | #23 | Exceptional 16.4% |
| Immigrants | Argentina | 99.9 /100 | #24 | Exceptional 16.4% |
| Luxembourgers | 99.9 /100 | #25 | Exceptional 16.4% |
| Immigrants | Croatia | 99.9 /100 | #26 | Exceptional 16.4% |
| Immigrants | Pakistan | 99.9 /100 | #27 | Exceptional 16.4% |
| Poles | 99.9 /100 | #28 | Exceptional 16.4% |
Demographics Similar to Mexicans by Cognitive Disability
In terms of cognitive disability, the demographic groups most similar to Mexicans are Paiute (17.8%, a difference of 0.020%), Immigrants from Bangladesh (17.8%, a difference of 0.090%), Jamaican (17.9%, a difference of 0.13%), Iraqi (17.8%, a difference of 0.14%), and Cajun (17.8%, a difference of 0.18%).
| Demographics | Rating | Rank | Cognitive Disability |
| Osage | 2.0 /100 | #234 | Tragic 17.8% |
| Spanish American Indians | 2.0 /100 | #235 | Tragic 17.8% |
| Immigrants | Iraq | 1.8 /100 | #236 | Tragic 17.8% |
| Immigrants | Mexico | 1.8 /100 | #237 | Tragic 17.8% |
| Cheyenne | 1.7 /100 | #238 | Tragic 17.8% |
| Cajuns | 1.4 /100 | #239 | Tragic 17.8% |
| Iraqis | 1.4 /100 | #240 | Tragic 17.8% |
| Mexicans | 1.1 /100 | #241 | Tragic 17.8% |
| Paiute | 1.1 /100 | #242 | Tragic 17.8% |
| Immigrants | Bangladesh | 1.0 /100 | #243 | Tragic 17.8% |
| Jamaicans | 0.9 /100 | #244 | Tragic 17.9% |
| Trinidadians and Tobagonians | 0.8 /100 | #245 | Tragic 17.9% |
| Immigrants | Thailand | 0.8 /100 | #246 | Tragic 17.9% |
| Samoans | 0.7 /100 | #247 | Tragic 17.9% |
| French American Indians | 0.7 /100 | #248 | Tragic 17.9% |