Immigrants from Cuba vs Haitian Cognitive Disability
COMPARE
Immigrants from Cuba
Haitian
Cognitive Disability
Cognitive Disability Comparison
Immigrants from Cuba
Haitians
16.3%
COGNITIVE DISABILITY
100.0/ 100
METRIC RATING
21st/ 347
METRIC RANK
17.5%
COGNITIVE DISABILITY
14.1/ 100
METRIC RATING
200th/ 347
METRIC RANK
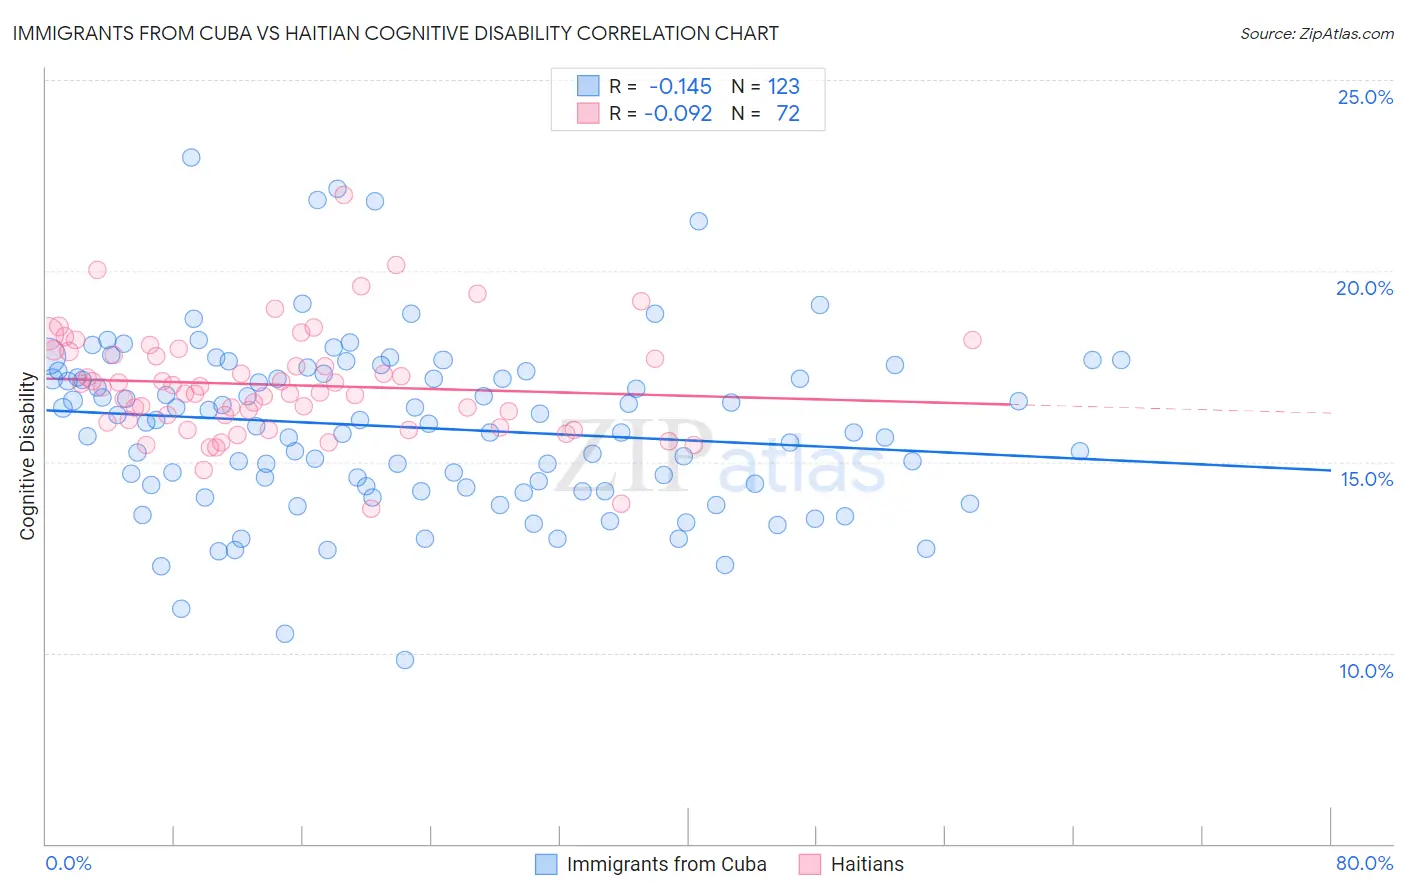
Immigrants from Cuba vs Haitian Cognitive Disability Correlation Chart
The statistical analysis conducted on geographies consisting of 325,949,473 people shows a poor negative correlation between the proportion of Immigrants from Cuba and percentage of population with cognitive disability in the United States with a correlation coefficient (R) of -0.145 and weighted average of 16.3%. Similarly, the statistical analysis conducted on geographies consisting of 287,929,830 people shows a slight negative correlation between the proportion of Haitians and percentage of population with cognitive disability in the United States with a correlation coefficient (R) of -0.092 and weighted average of 17.5%, a difference of 7.1%.
Cognitive Disability Correlation Summary
| Measurement | Immigrants from Cuba | Haitian |
| Minimum | 9.8% | 13.8% |
| Maximum | 23.0% | 22.0% |
| Range | 13.2% | 8.2% |
| Mean | 15.9% | 17.0% |
| Median | 16.0% | 16.9% |
| Interquartile 25% (IQ1) | 14.3% | 16.1% |
| Interquartile 75% (IQ3) | 17.3% | 17.8% |
| Interquartile Range (IQR) | 3.0% | 1.8% |
| Standard Deviation (Sample) | 2.3% | 1.4% |
| Standard Deviation (Population) | 2.3% | 1.4% |
Similar Demographics by Cognitive Disability
Demographics Similar to Immigrants from Cuba by Cognitive Disability
In terms of cognitive disability, the demographic groups most similar to Immigrants from Cuba are Bulgarian (16.3%, a difference of 0.040%), Immigrants from Northern Europe (16.3%, a difference of 0.060%), Immigrants from Bolivia (16.3%, a difference of 0.060%), Immigrants from North Macedonia (16.3%, a difference of 0.12%), and Immigrants from South Central Asia (16.4%, a difference of 0.13%).
| Demographics | Rating | Rank | Cognitive Disability |
| Immigrants | Austria | 100.0 /100 | #14 | Exceptional 16.3% |
| Immigrants | Greece | 100.0 /100 | #15 | Exceptional 16.3% |
| Eastern Europeans | 100.0 /100 | #16 | Exceptional 16.3% |
| Immigrants | North Macedonia | 100.0 /100 | #17 | Exceptional 16.3% |
| Immigrants | Northern Europe | 100.0 /100 | #18 | Exceptional 16.3% |
| Immigrants | Bolivia | 100.0 /100 | #19 | Exceptional 16.3% |
| Bulgarians | 100.0 /100 | #20 | Exceptional 16.3% |
| Immigrants | Cuba | 100.0 /100 | #21 | Exceptional 16.3% |
| Immigrants | South Central Asia | 99.9 /100 | #22 | Exceptional 16.4% |
| Croatians | 99.9 /100 | #23 | Exceptional 16.4% |
| Immigrants | Argentina | 99.9 /100 | #24 | Exceptional 16.4% |
| Luxembourgers | 99.9 /100 | #25 | Exceptional 16.4% |
| Immigrants | Croatia | 99.9 /100 | #26 | Exceptional 16.4% |
| Immigrants | Pakistan | 99.9 /100 | #27 | Exceptional 16.4% |
| Poles | 99.9 /100 | #28 | Exceptional 16.4% |
Demographics Similar to Haitians by Cognitive Disability
In terms of cognitive disability, the demographic groups most similar to Haitians are Immigrants from Singapore (17.5%, a difference of 0.010%), Immigrants from Panama (17.5%, a difference of 0.040%), South American Indian (17.5%, a difference of 0.070%), Immigrants from Morocco (17.5%, a difference of 0.13%), and Immigrants from Afghanistan (17.5%, a difference of 0.14%).
| Demographics | Rating | Rank | Cognitive Disability |
| Delaware | 25.6 /100 | #193 | Fair 17.4% |
| Immigrants | Bosnia and Herzegovina | 22.0 /100 | #194 | Fair 17.4% |
| New Zealanders | 21.1 /100 | #195 | Fair 17.4% |
| Guyanese | 17.5 /100 | #196 | Poor 17.5% |
| Immigrants | Afghanistan | 16.7 /100 | #197 | Poor 17.5% |
| Immigrants | Panama | 14.8 /100 | #198 | Poor 17.5% |
| Immigrants | Singapore | 14.3 /100 | #199 | Poor 17.5% |
| Haitians | 14.1 /100 | #200 | Poor 17.5% |
| South American Indians | 13.0 /100 | #201 | Poor 17.5% |
| Immigrants | Morocco | 12.0 /100 | #202 | Poor 17.5% |
| Immigrants | Caribbean | 11.0 /100 | #203 | Poor 17.5% |
| Immigrants | Zimbabwe | 11.0 /100 | #204 | Poor 17.5% |
| Puget Sound Salish | 10.9 /100 | #205 | Poor 17.5% |
| Alaska Natives | 10.4 /100 | #206 | Poor 17.5% |
| Immigrants | Latin America | 9.7 /100 | #207 | Tragic 17.6% |