Immigrants from Cuba vs Immigrants from Southern Europe Disability Age 35 to 64
COMPARE
Immigrants from Cuba
Immigrants from Southern Europe
Disability Age 35 to 64
Disability Age 35 to 64 Comparison
Immigrants from Cuba
Immigrants from Southern Europe
9.7%
DISABILITY AGE 35 TO 64
99.9/ 100
METRIC RATING
36th/ 347
METRIC RANK
10.7%
DISABILITY AGE 35 TO 64
91.5/ 100
METRIC RATING
138th/ 347
METRIC RANK
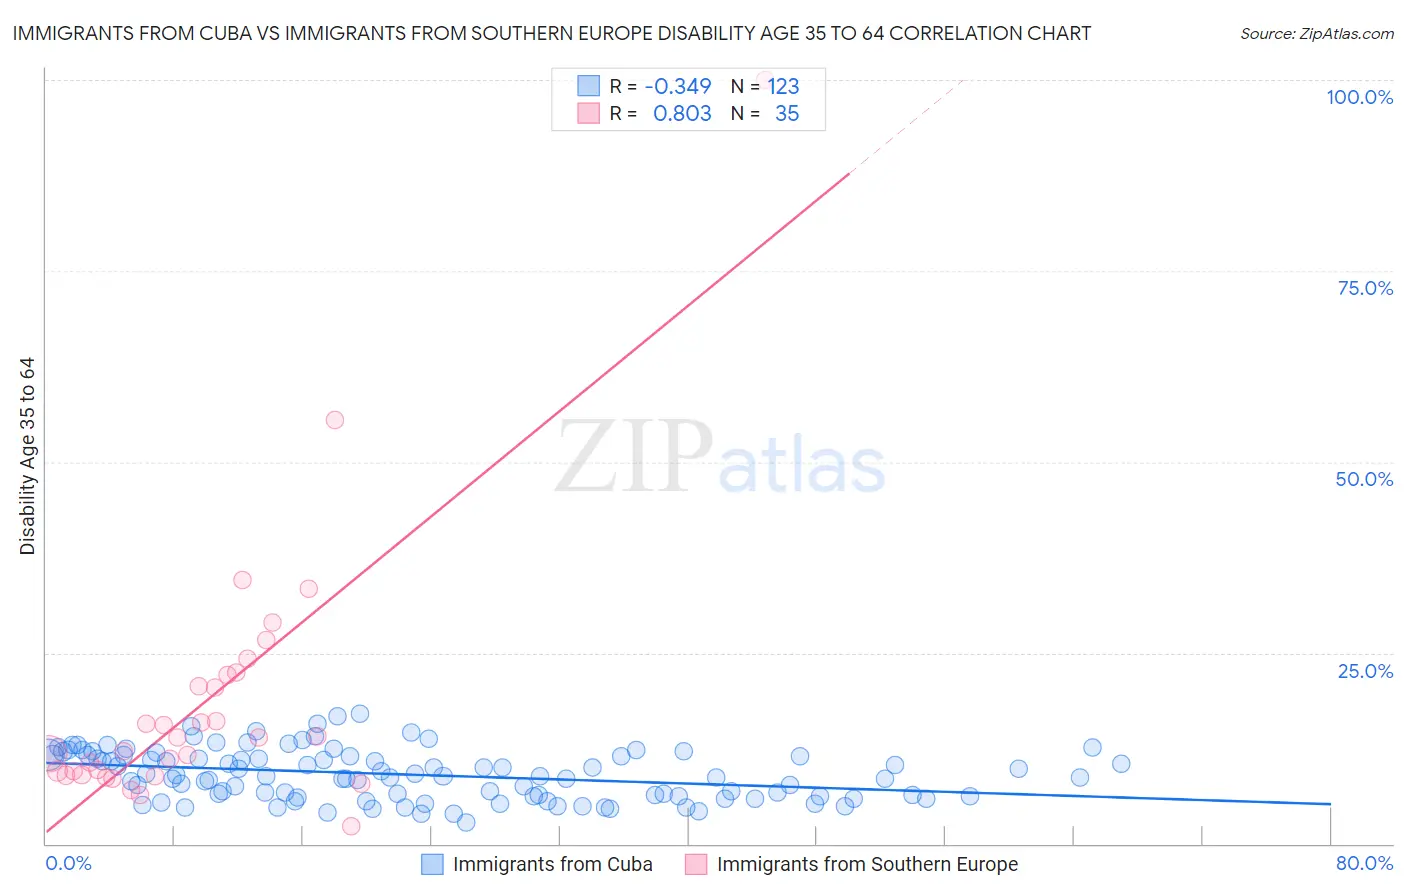
Immigrants from Cuba vs Immigrants from Southern Europe Disability Age 35 to 64 Correlation Chart
The statistical analysis conducted on geographies consisting of 325,944,060 people shows a mild negative correlation between the proportion of Immigrants from Cuba and percentage of population with a disability between the ages 34 and 64 in the United States with a correlation coefficient (R) of -0.349 and weighted average of 9.7%. Similarly, the statistical analysis conducted on geographies consisting of 402,559,548 people shows a very strong positive correlation between the proportion of Immigrants from Southern Europe and percentage of population with a disability between the ages 34 and 64 in the United States with a correlation coefficient (R) of 0.803 and weighted average of 10.7%, a difference of 10.9%.
Disability Age 35 to 64 Correlation Summary
| Measurement | Immigrants from Cuba | Immigrants from Southern Europe |
| Minimum | 2.8% | 2.2% |
| Maximum | 17.0% | 100.0% |
| Range | 14.2% | 97.8% |
| Mean | 9.0% | 18.5% |
| Median | 8.8% | 13.8% |
| Interquartile 25% (IQ1) | 6.2% | 9.0% |
| Interquartile 75% (IQ3) | 11.5% | 22.2% |
| Interquartile Range (IQR) | 5.3% | 13.2% |
| Standard Deviation (Sample) | 3.2% | 17.5% |
| Standard Deviation (Population) | 3.2% | 17.3% |
Similar Demographics by Disability Age 35 to 64
Demographics Similar to Immigrants from Cuba by Disability Age 35 to 64
In terms of disability age 35 to 64, the demographic groups most similar to Immigrants from Cuba are Bulgarian (9.7%, a difference of 0.040%), Immigrants from Turkey (9.7%, a difference of 0.080%), Immigrants from Australia (9.7%, a difference of 0.14%), Egyptian (9.7%, a difference of 0.15%), and Immigrants from Indonesia (9.7%, a difference of 0.21%).
| Demographics | Rating | Rank | Disability Age 35 to 64 |
| Immigrants | Ireland | 100.0 /100 | #29 | Exceptional 9.5% |
| Immigrants | Japan | 100.0 /100 | #30 | Exceptional 9.5% |
| Immigrants | Lithuania | 99.9 /100 | #31 | Exceptional 9.6% |
| Turks | 99.9 /100 | #32 | Exceptional 9.7% |
| Immigrants | Indonesia | 99.9 /100 | #33 | Exceptional 9.7% |
| Immigrants | Australia | 99.9 /100 | #34 | Exceptional 9.7% |
| Bulgarians | 99.9 /100 | #35 | Exceptional 9.7% |
| Immigrants | Cuba | 99.9 /100 | #36 | Exceptional 9.7% |
| Immigrants | Turkey | 99.9 /100 | #37 | Exceptional 9.7% |
| Egyptians | 99.9 /100 | #38 | Exceptional 9.7% |
| Immigrants | Belarus | 99.9 /100 | #39 | Exceptional 9.7% |
| Immigrants | Armenia | 99.9 /100 | #40 | Exceptional 9.7% |
| Israelis | 99.9 /100 | #41 | Exceptional 9.7% |
| Immigrants | Malaysia | 99.9 /100 | #42 | Exceptional 9.7% |
| Immigrants | Colombia | 99.9 /100 | #43 | Exceptional 9.8% |
Demographics Similar to Immigrants from Southern Europe by Disability Age 35 to 64
In terms of disability age 35 to 64, the demographic groups most similar to Immigrants from Southern Europe are Costa Rican (10.7%, a difference of 0.010%), Immigrants from Costa Rica (10.7%, a difference of 0.050%), Immigrants from Scotland (10.7%, a difference of 0.060%), Salvadoran (10.7%, a difference of 0.12%), and Australian (10.8%, a difference of 0.19%).
| Demographics | Rating | Rank | Disability Age 35 to 64 |
| Immigrants | El Salvador | 92.8 /100 | #131 | Exceptional 10.7% |
| Immigrants | Albania | 92.5 /100 | #132 | Exceptional 10.7% |
| Immigrants | Immigrants | 92.5 /100 | #133 | Exceptional 10.7% |
| Immigrants | Ecuador | 92.5 /100 | #134 | Exceptional 10.7% |
| Greeks | 92.3 /100 | #135 | Exceptional 10.7% |
| Salvadorans | 91.9 /100 | #136 | Exceptional 10.7% |
| Immigrants | Costa Rica | 91.7 /100 | #137 | Exceptional 10.7% |
| Immigrants | Southern Europe | 91.5 /100 | #138 | Exceptional 10.7% |
| Costa Ricans | 91.4 /100 | #139 | Exceptional 10.7% |
| Immigrants | Scotland | 91.3 /100 | #140 | Exceptional 10.7% |
| Australians | 90.7 /100 | #141 | Exceptional 10.8% |
| Immigrants | Saudi Arabia | 90.6 /100 | #142 | Exceptional 10.8% |
| Sierra Leoneans | 89.7 /100 | #143 | Excellent 10.8% |
| Lithuanians | 88.7 /100 | #144 | Excellent 10.8% |
| Immigrants | Bangladesh | 85.6 /100 | #145 | Excellent 10.9% |