Immigrants from Central America vs Ethiopian Male Disability
COMPARE
Immigrants from Central America
Ethiopian
Male Disability
Male Disability Comparison
Immigrants from Central America
Ethiopians
11.3%
MALE DISABILITY
32.9/ 100
METRIC RATING
183rd/ 347
METRIC RANK
10.2%
MALE DISABILITY
99.8/ 100
METRIC RATING
36th/ 347
METRIC RANK
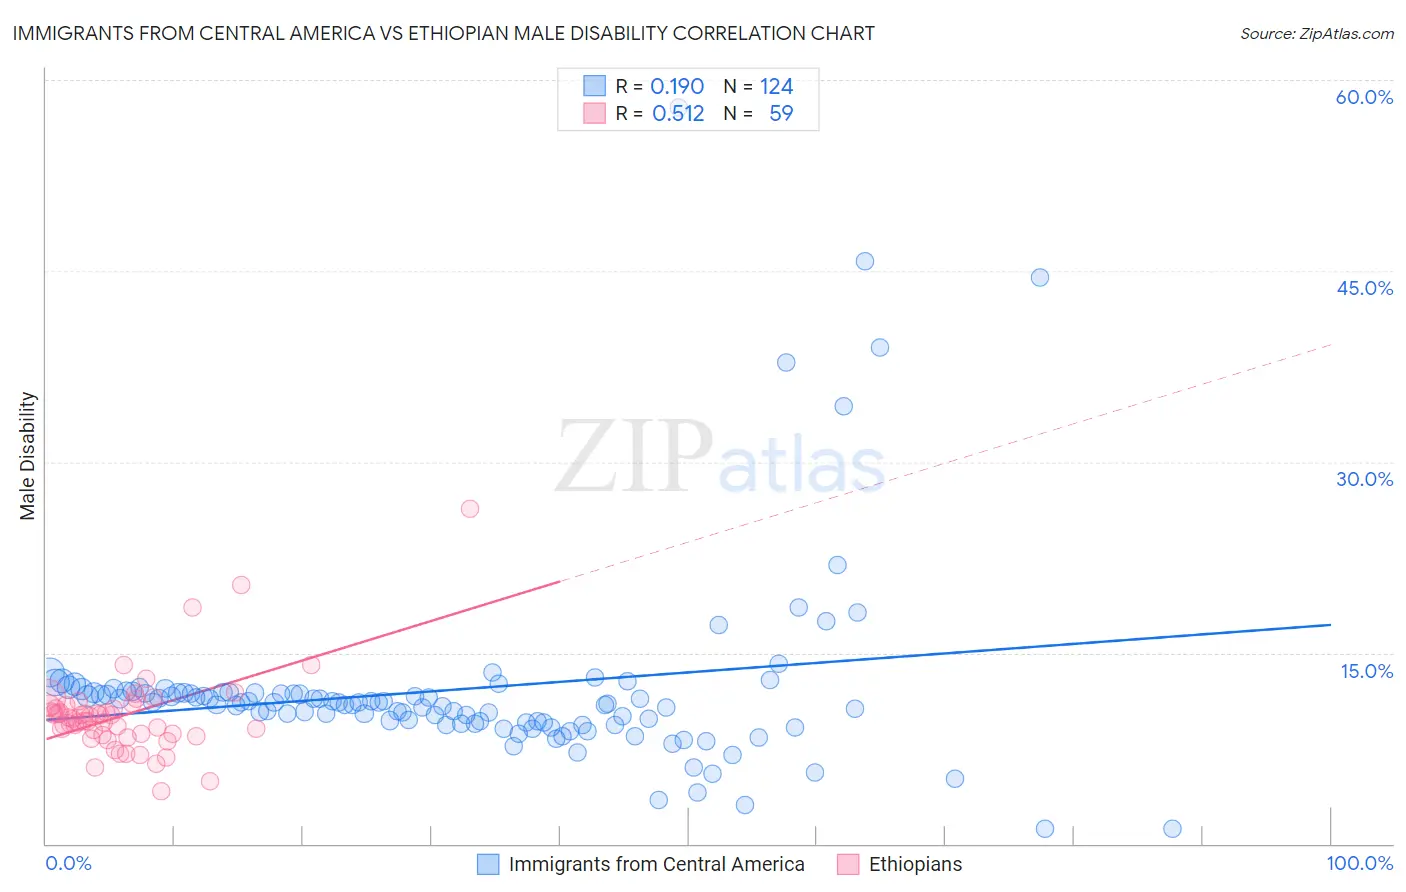
Immigrants from Central America vs Ethiopian Male Disability Correlation Chart
The statistical analysis conducted on geographies consisting of 536,294,553 people shows a poor positive correlation between the proportion of Immigrants from Central America and percentage of males with a disability in the United States with a correlation coefficient (R) of 0.190 and weighted average of 11.3%. Similarly, the statistical analysis conducted on geographies consisting of 223,232,754 people shows a substantial positive correlation between the proportion of Ethiopians and percentage of males with a disability in the United States with a correlation coefficient (R) of 0.512 and weighted average of 10.2%, a difference of 11.0%.
Male Disability Correlation Summary
| Measurement | Immigrants from Central America | Ethiopian |
| Minimum | 1.2% | 4.2% |
| Maximum | 57.8% | 26.3% |
| Range | 56.6% | 22.2% |
| Mean | 12.1% | 10.1% |
| Median | 11.1% | 9.8% |
| Interquartile 25% (IQ1) | 9.5% | 8.5% |
| Interquartile 75% (IQ3) | 11.9% | 10.8% |
| Interquartile Range (IQR) | 2.4% | 2.3% |
| Standard Deviation (Sample) | 7.8% | 3.4% |
| Standard Deviation (Population) | 7.7% | 3.4% |
Similar Demographics by Male Disability
Demographics Similar to Immigrants from Central America by Male Disability
In terms of male disability, the demographic groups most similar to Immigrants from Central America are Immigrants from Belize (11.3%, a difference of 0.050%), Immigrants from Senegal (11.3%, a difference of 0.090%), Iraqi (11.3%, a difference of 0.15%), Pakistani (11.3%, a difference of 0.16%), and Immigrants from Zaire (11.4%, a difference of 0.34%).
| Demographics | Rating | Rank | Male Disability |
| Syrians | 46.6 /100 | #176 | Average 11.2% |
| Immigrants | Norway | 44.2 /100 | #177 | Average 11.3% |
| Australians | 42.2 /100 | #178 | Average 11.3% |
| Immigrants | Caribbean | 41.4 /100 | #179 | Average 11.3% |
| Hondurans | 41.1 /100 | #180 | Average 11.3% |
| Immigrants | Senegal | 34.4 /100 | #181 | Fair 11.3% |
| Immigrants | Belize | 33.7 /100 | #182 | Fair 11.3% |
| Immigrants | Central America | 32.9 /100 | #183 | Fair 11.3% |
| Iraqis | 30.5 /100 | #184 | Fair 11.3% |
| Pakistanis | 30.3 /100 | #185 | Fair 11.3% |
| Immigrants | Zaire | 27.6 /100 | #186 | Fair 11.4% |
| Immigrants | Austria | 27.3 /100 | #187 | Fair 11.4% |
| Estonians | 26.8 /100 | #188 | Fair 11.4% |
| Immigrants | Netherlands | 25.9 /100 | #189 | Fair 11.4% |
| Immigrants | Bosnia and Herzegovina | 25.4 /100 | #190 | Fair 11.4% |
Demographics Similar to Ethiopians by Male Disability
In terms of male disability, the demographic groups most similar to Ethiopians are Immigrants from Argentina (10.2%, a difference of 0.050%), Immigrants from Indonesia (10.2%, a difference of 0.070%), Immigrants from Turkey (10.2%, a difference of 0.16%), Immigrants from Ethiopia (10.2%, a difference of 0.22%), and Immigrants from Kuwait (10.2%, a difference of 0.24%).
| Demographics | Rating | Rank | Male Disability |
| Venezuelans | 99.9 /100 | #29 | Exceptional 10.1% |
| Immigrants | Egypt | 99.9 /100 | #30 | Exceptional 10.1% |
| Soviet Union | 99.9 /100 | #31 | Exceptional 10.1% |
| Argentineans | 99.9 /100 | #32 | Exceptional 10.1% |
| Immigrants | Ethiopia | 99.9 /100 | #33 | Exceptional 10.2% |
| Immigrants | Turkey | 99.9 /100 | #34 | Exceptional 10.2% |
| Immigrants | Argentina | 99.9 /100 | #35 | Exceptional 10.2% |
| Ethiopians | 99.8 /100 | #36 | Exceptional 10.2% |
| Immigrants | Indonesia | 99.8 /100 | #37 | Exceptional 10.2% |
| Immigrants | Kuwait | 99.8 /100 | #38 | Exceptional 10.2% |
| Afghans | 99.8 /100 | #39 | Exceptional 10.2% |
| Immigrants | Nepal | 99.8 /100 | #40 | Exceptional 10.3% |
| Taiwanese | 99.8 /100 | #41 | Exceptional 10.3% |
| Mongolians | 99.7 /100 | #42 | Exceptional 10.3% |
| Immigrants | Bangladesh | 99.7 /100 | #43 | Exceptional 10.3% |