Immigrants from Cameroon vs Immigrants from Dominican Republic Disability Age 35 to 64
COMPARE
Immigrants from Cameroon
Immigrants from Dominican Republic
Disability Age 35 to 64
Disability Age 35 to 64 Comparison
Immigrants from Cameroon
Immigrants from Dominican Republic
10.9%
DISABILITY AGE 35 TO 64
81.1/ 100
METRIC RATING
149th/ 347
METRIC RANK
12.9%
DISABILITY AGE 35 TO 64
0.1/ 100
METRIC RATING
277th/ 347
METRIC RANK
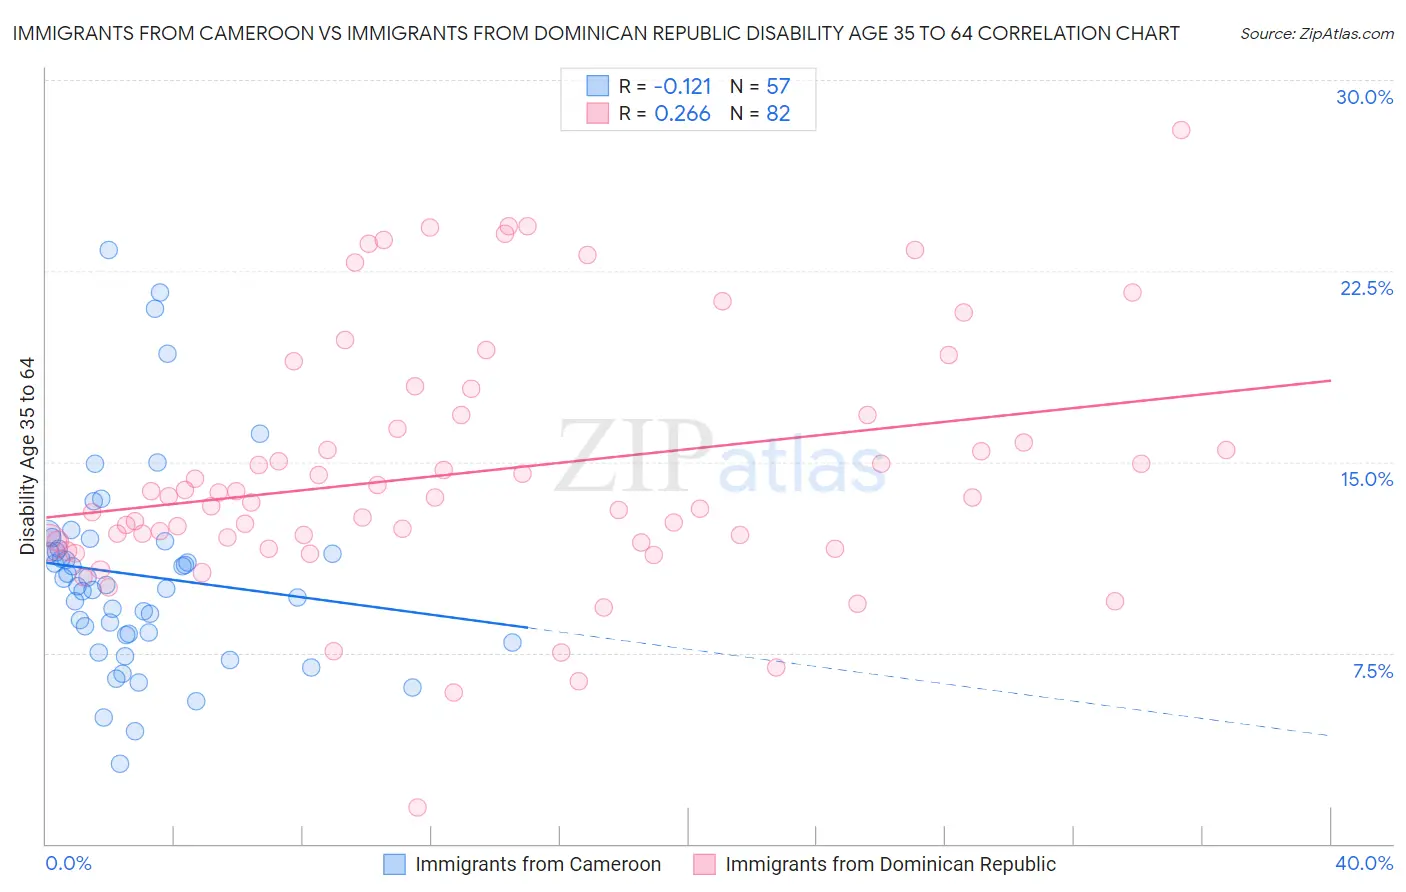
Immigrants from Cameroon vs Immigrants from Dominican Republic Disability Age 35 to 64 Correlation Chart
The statistical analysis conducted on geographies consisting of 130,721,109 people shows a poor negative correlation between the proportion of Immigrants from Cameroon and percentage of population with a disability between the ages 34 and 64 in the United States with a correlation coefficient (R) of -0.121 and weighted average of 10.9%. Similarly, the statistical analysis conducted on geographies consisting of 274,934,526 people shows a weak positive correlation between the proportion of Immigrants from Dominican Republic and percentage of population with a disability between the ages 34 and 64 in the United States with a correlation coefficient (R) of 0.266 and weighted average of 12.9%, a difference of 18.0%.
Disability Age 35 to 64 Correlation Summary
| Measurement | Immigrants from Cameroon | Immigrants from Dominican Republic |
| Minimum | 3.2% | 1.4% |
| Maximum | 23.3% | 28.0% |
| Range | 20.2% | 26.6% |
| Mean | 10.5% | 14.6% |
| Median | 10.2% | 13.6% |
| Interquartile 25% (IQ1) | 8.2% | 11.9% |
| Interquartile 75% (IQ3) | 11.7% | 16.8% |
| Interquartile Range (IQR) | 3.5% | 5.0% |
| Standard Deviation (Sample) | 4.0% | 4.9% |
| Standard Deviation (Population) | 3.9% | 4.9% |
Similar Demographics by Disability Age 35 to 64
Demographics Similar to Immigrants from Cameroon by Disability Age 35 to 64
In terms of disability age 35 to 64, the demographic groups most similar to Immigrants from Cameroon are Syrian (11.0%, a difference of 0.17%), Arab (10.9%, a difference of 0.22%), New Zealander (11.0%, a difference of 0.24%), Immigrants from Eritrea (10.9%, a difference of 0.32%), and South American Indian (10.9%, a difference of 0.34%).
| Demographics | Rating | Rank | Disability Age 35 to 64 |
| Immigrants | Saudi Arabia | 90.6 /100 | #142 | Exceptional 10.8% |
| Sierra Leoneans | 89.7 /100 | #143 | Excellent 10.8% |
| Lithuanians | 88.7 /100 | #144 | Excellent 10.8% |
| Immigrants | Bangladesh | 85.6 /100 | #145 | Excellent 10.9% |
| South American Indians | 83.5 /100 | #146 | Excellent 10.9% |
| Immigrants | Eritrea | 83.4 /100 | #147 | Excellent 10.9% |
| Arabs | 82.7 /100 | #148 | Excellent 10.9% |
| Immigrants | Cameroon | 81.1 /100 | #149 | Excellent 10.9% |
| Syrians | 79.8 /100 | #150 | Good 11.0% |
| New Zealanders | 79.3 /100 | #151 | Good 11.0% |
| Ukrainians | 78.0 /100 | #152 | Good 11.0% |
| Immigrants | England | 77.4 /100 | #153 | Good 11.0% |
| Immigrants | Canada | 76.7 /100 | #154 | Good 11.0% |
| Moroccans | 76.4 /100 | #155 | Good 11.0% |
| Immigrants | Sierra Leone | 76.2 /100 | #156 | Good 11.0% |
Demographics Similar to Immigrants from Dominican Republic by Disability Age 35 to 64
In terms of disability age 35 to 64, the demographic groups most similar to Immigrants from Dominican Republic are French Canadian (12.9%, a difference of 0.030%), Immigrants from Micronesia (12.9%, a difference of 0.050%), Somali (12.9%, a difference of 0.20%), Liberian (12.9%, a difference of 0.22%), and Dominican (12.9%, a difference of 0.31%).
| Demographics | Rating | Rank | Disability Age 35 to 64 |
| French | 0.2 /100 | #270 | Tragic 12.7% |
| Nepalese | 0.1 /100 | #271 | Tragic 12.8% |
| U.S. Virgin Islanders | 0.1 /100 | #272 | Tragic 12.8% |
| Pennsylvania Germans | 0.1 /100 | #273 | Tragic 12.8% |
| Celtics | 0.1 /100 | #274 | Tragic 12.9% |
| Dominicans | 0.1 /100 | #275 | Tragic 12.9% |
| Somalis | 0.1 /100 | #276 | Tragic 12.9% |
| Immigrants | Dominican Republic | 0.1 /100 | #277 | Tragic 12.9% |
| French Canadians | 0.1 /100 | #278 | Tragic 12.9% |
| Immigrants | Micronesia | 0.1 /100 | #279 | Tragic 12.9% |
| Liberians | 0.1 /100 | #280 | Tragic 12.9% |
| Scotch-Irish | 0.1 /100 | #281 | Tragic 13.0% |
| Immigrants | Laos | 0.1 /100 | #282 | Tragic 13.0% |
| Central American Indians | 0.0 /100 | #283 | Tragic 13.0% |
| Immigrants | Nonimmigrants | 0.0 /100 | #284 | Tragic 13.0% |