Immigrants from Bulgaria vs Blackfeet Unemployment Among Ages 25 to 29 years
COMPARE
Immigrants from Bulgaria
Blackfeet
Unemployment Among Ages 25 to 29 years
Unemployment Among Ages 25 to 29 years Comparison
Immigrants from Bulgaria
Blackfeet
5.9%
UNEMPLOYMENT AMONG AGES 25 TO 29 YEARS
99.9/ 100
METRIC RATING
16th/ 347
METRIC RANK
7.9%
UNEMPLOYMENT AMONG AGES 25 TO 29 YEARS
0.0/ 100
METRIC RATING
297th/ 347
METRIC RANK
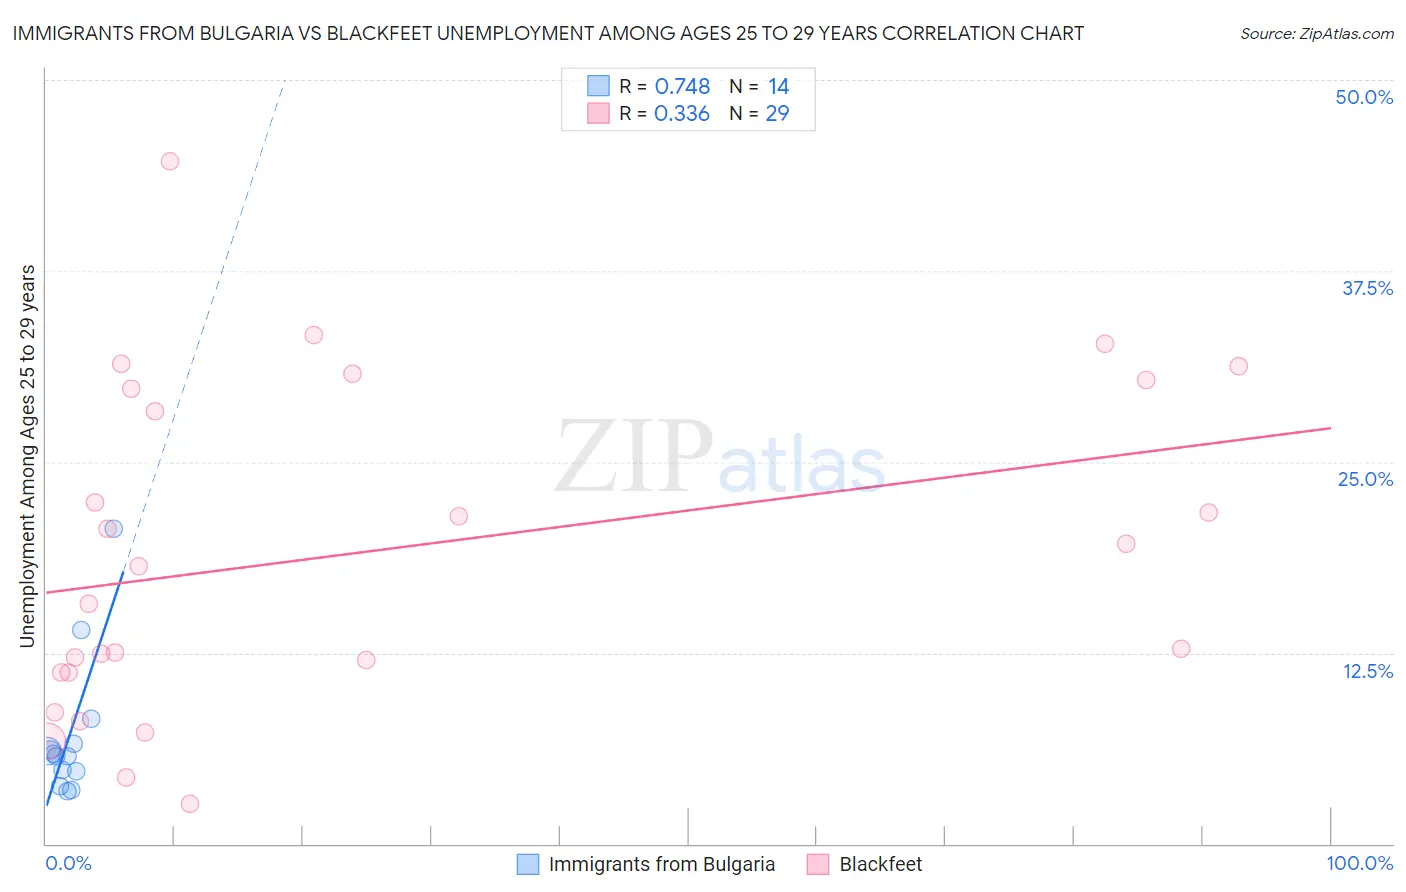
Immigrants from Bulgaria vs Blackfeet Unemployment Among Ages 25 to 29 years Correlation Chart
The statistical analysis conducted on geographies consisting of 168,605,799 people shows a strong positive correlation between the proportion of Immigrants from Bulgaria and unemployment rate among population between the ages 25 and 29 in the United States with a correlation coefficient (R) of 0.748 and weighted average of 5.9%. Similarly, the statistical analysis conducted on geographies consisting of 297,062,575 people shows a mild positive correlation between the proportion of Blackfeet and unemployment rate among population between the ages 25 and 29 in the United States with a correlation coefficient (R) of 0.336 and weighted average of 7.9%, a difference of 33.1%.
Unemployment Among Ages 25 to 29 years Correlation Summary
| Measurement | Immigrants from Bulgaria | Blackfeet |
| Minimum | 3.5% | 2.6% |
| Maximum | 20.6% | 44.7% |
| Range | 17.1% | 42.1% |
| Mean | 7.1% | 19.1% |
| Median | 5.8% | 18.2% |
| Interquartile 25% (IQ1) | 4.7% | 11.2% |
| Interquartile 75% (IQ3) | 6.5% | 30.1% |
| Interquartile Range (IQR) | 1.8% | 18.9% |
| Standard Deviation (Sample) | 4.7% | 10.7% |
| Standard Deviation (Population) | 4.5% | 10.5% |
Similar Demographics by Unemployment Among Ages 25 to 29 years
Demographics Similar to Immigrants from Bulgaria by Unemployment Among Ages 25 to 29 years
In terms of unemployment among ages 25 to 29 years, the demographic groups most similar to Immigrants from Bulgaria are Cuban (5.9%, a difference of 0.010%), Bolivian (5.9%, a difference of 0.14%), Immigrants from Singapore (5.9%, a difference of 0.25%), Immigrants from Kuwait (5.9%, a difference of 0.36%), and Thai (5.9%, a difference of 0.40%).
| Demographics | Rating | Rank | Unemployment Among Ages 25 to 29 years |
| Immigrants | Nepal | 100.0 /100 | #9 | Exceptional 5.7% |
| Immigrants | Sudan | 100.0 /100 | #10 | Exceptional 5.8% |
| Cambodians | 100.0 /100 | #11 | Exceptional 5.8% |
| Okinawans | 100.0 /100 | #12 | Exceptional 5.9% |
| Immigrants | Bolivia | 100.0 /100 | #13 | Exceptional 5.9% |
| Immigrants | Kuwait | 99.9 /100 | #14 | Exceptional 5.9% |
| Cubans | 99.9 /100 | #15 | Exceptional 5.9% |
| Immigrants | Bulgaria | 99.9 /100 | #16 | Exceptional 5.9% |
| Bolivians | 99.9 /100 | #17 | Exceptional 5.9% |
| Immigrants | Singapore | 99.9 /100 | #18 | Exceptional 5.9% |
| Thais | 99.9 /100 | #19 | Exceptional 5.9% |
| Immigrants | Eritrea | 99.9 /100 | #20 | Exceptional 5.9% |
| Immigrants | Ethiopia | 99.9 /100 | #21 | Exceptional 6.0% |
| Immigrants | Japan | 99.9 /100 | #22 | Exceptional 6.0% |
| Immigrants | Venezuela | 99.8 /100 | #23 | Exceptional 6.0% |
Demographics Similar to Blackfeet by Unemployment Among Ages 25 to 29 years
In terms of unemployment among ages 25 to 29 years, the demographic groups most similar to Blackfeet are Immigrants from Trinidad and Tobago (7.9%, a difference of 0.26%), Immigrants from West Indies (7.8%, a difference of 0.42%), Barbadian (7.9%, a difference of 0.43%), Central American Indian (7.9%, a difference of 0.45%), and West Indian (7.9%, a difference of 0.48%).
| Demographics | Rating | Rank | Unemployment Among Ages 25 to 29 years |
| Armenians | 0.0 /100 | #290 | Tragic 7.7% |
| Hispanics or Latinos | 0.0 /100 | #291 | Tragic 7.7% |
| Chippewa | 0.0 /100 | #292 | Tragic 7.8% |
| Immigrants | Belize | 0.0 /100 | #293 | Tragic 7.8% |
| Trinidadians and Tobagonians | 0.0 /100 | #294 | Tragic 7.8% |
| Comanche | 0.0 /100 | #295 | Tragic 7.8% |
| Immigrants | West Indies | 0.0 /100 | #296 | Tragic 7.8% |
| Blackfeet | 0.0 /100 | #297 | Tragic 7.9% |
| Immigrants | Trinidad and Tobago | 0.0 /100 | #298 | Tragic 7.9% |
| Barbadians | 0.0 /100 | #299 | Tragic 7.9% |
| Central American Indians | 0.0 /100 | #300 | Tragic 7.9% |
| West Indians | 0.0 /100 | #301 | Tragic 7.9% |
| Jamaicans | 0.0 /100 | #302 | Tragic 7.9% |
| Immigrants | Yemen | 0.0 /100 | #303 | Tragic 8.0% |
| Cajuns | 0.0 /100 | #304 | Tragic 8.0% |