Immigrants from Bolivia vs Soviet Union Disability Age 35 to 64
COMPARE
Immigrants from Bolivia
Soviet Union
Disability Age 35 to 64
Disability Age 35 to 64 Comparison
Immigrants from Bolivia
Soviet Union
8.7%
DISABILITY AGE 35 TO 64
100.0/ 100
METRIC RATING
10th/ 347
METRIC RANK
9.2%
DISABILITY AGE 35 TO 64
100.0/ 100
METRIC RATING
18th/ 347
METRIC RANK
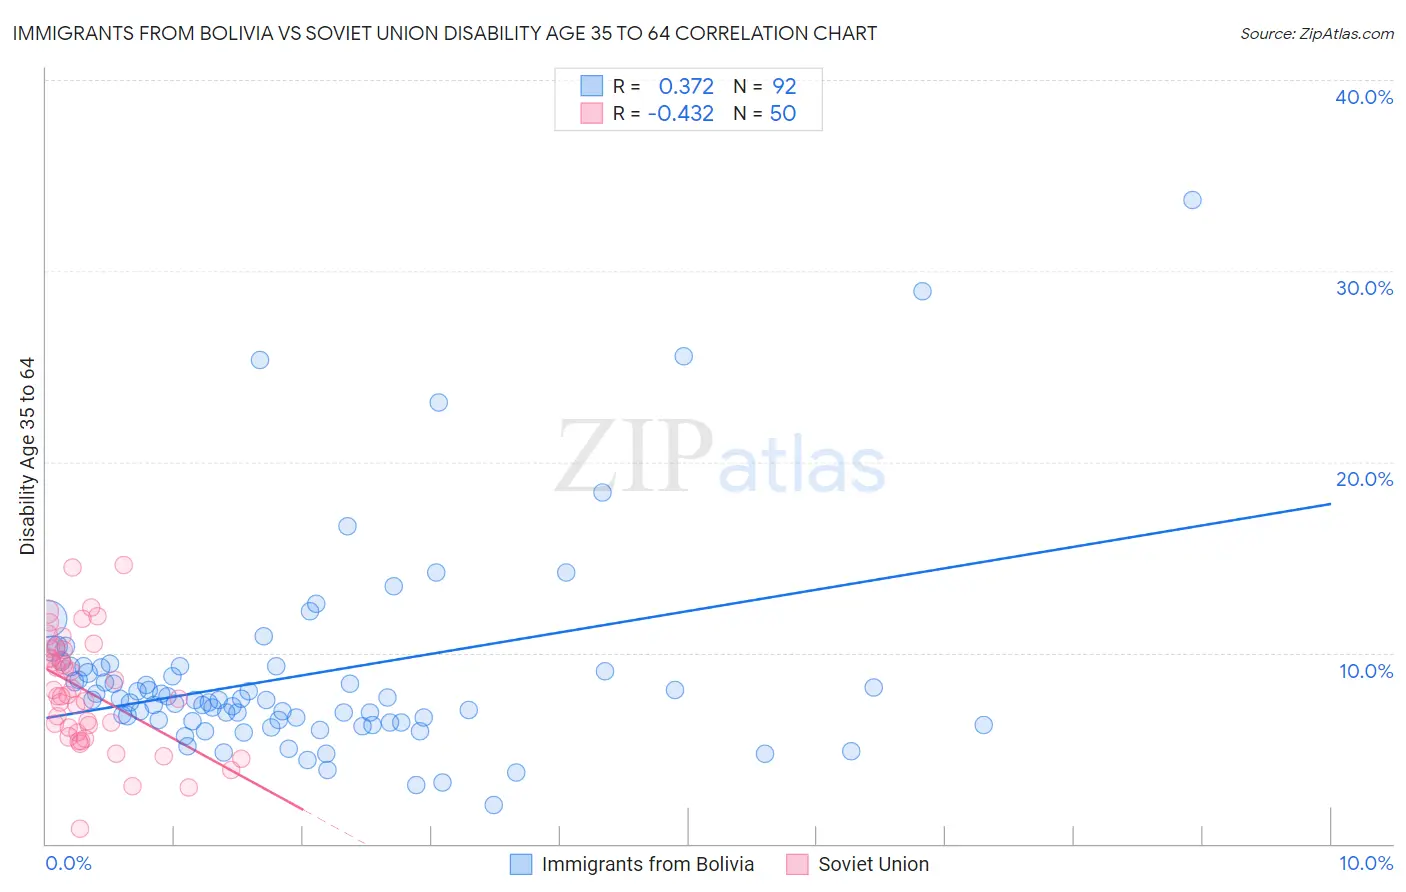
Immigrants from Bolivia vs Soviet Union Disability Age 35 to 64 Correlation Chart
The statistical analysis conducted on geographies consisting of 158,698,949 people shows a mild positive correlation between the proportion of Immigrants from Bolivia and percentage of population with a disability between the ages 34 and 64 in the United States with a correlation coefficient (R) of 0.372 and weighted average of 8.7%. Similarly, the statistical analysis conducted on geographies consisting of 43,509,630 people shows a moderate negative correlation between the proportion of Soviet Union and percentage of population with a disability between the ages 34 and 64 in the United States with a correlation coefficient (R) of -0.432 and weighted average of 9.2%, a difference of 6.0%.
Disability Age 35 to 64 Correlation Summary
| Measurement | Immigrants from Bolivia | Soviet Union |
| Minimum | 2.0% | 0.79% |
| Maximum | 33.7% | 14.6% |
| Range | 31.7% | 13.8% |
| Mean | 8.8% | 8.0% |
| Median | 7.5% | 7.8% |
| Interquartile 25% (IQ1) | 6.4% | 5.8% |
| Interquartile 75% (IQ3) | 9.2% | 10.1% |
| Interquartile Range (IQR) | 2.9% | 4.3% |
| Standard Deviation (Sample) | 5.3% | 3.0% |
| Standard Deviation (Population) | 5.2% | 2.9% |
Demographics Similar to Immigrants from Bolivia and Soviet Union by Disability Age 35 to 64
In terms of disability age 35 to 64, the demographic groups most similar to Immigrants from Bolivia are Immigrants from China (8.7%, a difference of 0.27%), Iranian (8.7%, a difference of 0.70%), Immigrants from Eastern Asia (8.8%, a difference of 0.70%), Immigrants from Israel (8.6%, a difference of 1.3%), and Indian (Asian) (8.9%, a difference of 1.5%). Similarly, the demographic groups most similar to Soviet Union are Immigrants from Venezuela (9.3%, a difference of 0.24%), Burmese (9.2%, a difference of 0.41%), Immigrants from Argentina (9.3%, a difference of 0.75%), Okinawan (9.4%, a difference of 1.2%), and Cypriot (9.4%, a difference of 1.2%).
| Demographics | Rating | Rank | Disability Age 35 to 64 |
| Immigrants | India | 100.0 /100 | #4 | Exceptional 8.3% |
| Immigrants | Iran | 100.0 /100 | #5 | Exceptional 8.5% |
| Thais | 100.0 /100 | #6 | Exceptional 8.6% |
| Immigrants | Israel | 100.0 /100 | #7 | Exceptional 8.6% |
| Iranians | 100.0 /100 | #8 | Exceptional 8.7% |
| Immigrants | China | 100.0 /100 | #9 | Exceptional 8.7% |
| Immigrants | Bolivia | 100.0 /100 | #10 | Exceptional 8.7% |
| Immigrants | Eastern Asia | 100.0 /100 | #11 | Exceptional 8.8% |
| Indians (Asian) | 100.0 /100 | #12 | Exceptional 8.9% |
| Immigrants | South Central Asia | 100.0 /100 | #13 | Exceptional 8.9% |
| Immigrants | Singapore | 100.0 /100 | #14 | Exceptional 8.9% |
| Bolivians | 100.0 /100 | #15 | Exceptional 8.9% |
| Immigrants | Korea | 100.0 /100 | #16 | Exceptional 9.0% |
| Burmese | 100.0 /100 | #17 | Exceptional 9.2% |
| Soviet Union | 100.0 /100 | #18 | Exceptional 9.2% |
| Immigrants | Venezuela | 100.0 /100 | #19 | Exceptional 9.3% |
| Immigrants | Argentina | 100.0 /100 | #20 | Exceptional 9.3% |
| Okinawans | 100.0 /100 | #21 | Exceptional 9.4% |
| Cypriots | 100.0 /100 | #22 | Exceptional 9.4% |
| Argentineans | 100.0 /100 | #23 | Exceptional 9.4% |
| Asians | 100.0 /100 | #24 | Exceptional 9.4% |