Immigrants from Belize vs Ukrainian Disability Age Under 5
COMPARE
Immigrants from Belize
Ukrainian
Disability Age Under 5
Disability Age Under 5 Comparison
Immigrants from Belize
Ukrainians
1.1%
DISABILITY AGE UNDER 5
98.7/ 100
METRIC RATING
67th/ 347
METRIC RANK
1.3%
DISABILITY AGE UNDER 5
8.3/ 100
METRIC RATING
222nd/ 347
METRIC RANK
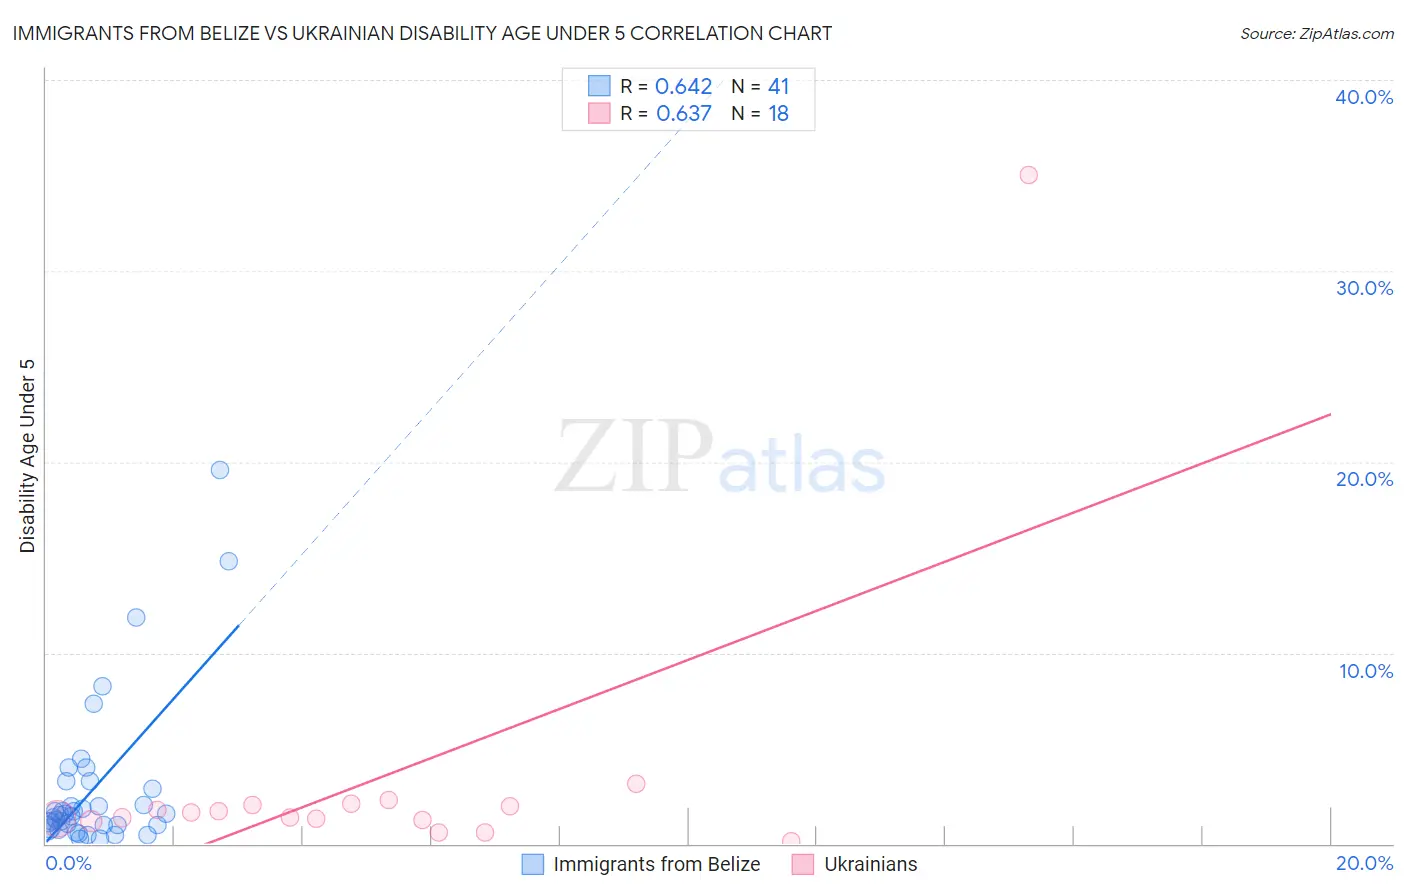
Immigrants from Belize vs Ukrainian Disability Age Under 5 Correlation Chart
The statistical analysis conducted on geographies consisting of 95,414,478 people shows a significant positive correlation between the proportion of Immigrants from Belize and percentage of population with a disability under the age of 5 in the United States with a correlation coefficient (R) of 0.642 and weighted average of 1.1%. Similarly, the statistical analysis conducted on geographies consisting of 227,368,617 people shows a significant positive correlation between the proportion of Ukrainians and percentage of population with a disability under the age of 5 in the United States with a correlation coefficient (R) of 0.637 and weighted average of 1.3%, a difference of 16.9%.
Disability Age Under 5 Correlation Summary
| Measurement | Immigrants from Belize | Ukrainian |
| Minimum | 0.27% | 0.14% |
| Maximum | 19.6% | 35.0% |
| Range | 19.3% | 34.9% |
| Mean | 2.9% | 3.4% |
| Median | 1.5% | 1.5% |
| Interquartile 25% (IQ1) | 0.89% | 1.2% |
| Interquartile 75% (IQ3) | 3.1% | 2.0% |
| Interquartile Range (IQR) | 2.2% | 0.82% |
| Standard Deviation (Sample) | 4.0% | 7.9% |
| Standard Deviation (Population) | 4.0% | 7.7% |
Similar Demographics by Disability Age Under 5
Demographics Similar to Immigrants from Belize by Disability Age Under 5
In terms of disability age under 5, the demographic groups most similar to Immigrants from Belize are South African (1.1%, a difference of 0.040%), Israeli (1.1%, a difference of 0.060%), Immigrants from Indonesia (1.1%, a difference of 0.070%), Immigrants from Ecuador (1.1%, a difference of 0.15%), and Immigrants from Korea (1.1%, a difference of 0.19%).
| Demographics | Rating | Rank | Disability Age Under 5 |
| Immigrants | Western Asia | 99.2 /100 | #60 | Exceptional 1.1% |
| Immigrants | Ethiopia | 99.2 /100 | #61 | Exceptional 1.1% |
| Immigrants | Switzerland | 99.2 /100 | #62 | Exceptional 1.1% |
| Immigrants | Vietnam | 99.1 /100 | #63 | Exceptional 1.1% |
| Egyptians | 98.9 /100 | #64 | Exceptional 1.1% |
| Immigrants | Korea | 98.8 /100 | #65 | Exceptional 1.1% |
| Immigrants | Indonesia | 98.7 /100 | #66 | Exceptional 1.1% |
| Immigrants | Belize | 98.7 /100 | #67 | Exceptional 1.1% |
| South Africans | 98.7 /100 | #68 | Exceptional 1.1% |
| Israelis | 98.7 /100 | #69 | Exceptional 1.1% |
| Immigrants | Ecuador | 98.6 /100 | #70 | Exceptional 1.1% |
| Trinidadians and Tobagonians | 98.6 /100 | #71 | Exceptional 1.1% |
| Burmese | 98.5 /100 | #72 | Exceptional 1.1% |
| Immigrants | Sri Lanka | 98.5 /100 | #73 | Exceptional 1.1% |
| Jordanians | 98.5 /100 | #74 | Exceptional 1.1% |
Demographics Similar to Ukrainians by Disability Age Under 5
In terms of disability age under 5, the demographic groups most similar to Ukrainians are Subsaharan African (1.3%, a difference of 0.0%), Hispanic or Latino (1.3%, a difference of 0.19%), Serbian (1.3%, a difference of 0.34%), Latvian (1.3%, a difference of 0.35%), and Panamanian (1.3%, a difference of 0.37%).
| Demographics | Rating | Rank | Disability Age Under 5 |
| Syrians | 16.1 /100 | #215 | Poor 1.3% |
| Bangladeshis | 15.5 /100 | #216 | Poor 1.3% |
| Cypriots | 14.9 /100 | #217 | Poor 1.3% |
| Malaysians | 13.2 /100 | #218 | Poor 1.3% |
| Immigrants | Croatia | 11.2 /100 | #219 | Poor 1.3% |
| Serbians | 9.6 /100 | #220 | Tragic 1.3% |
| Sub-Saharan Africans | 8.3 /100 | #221 | Tragic 1.3% |
| Ukrainians | 8.3 /100 | #222 | Tragic 1.3% |
| Hispanics or Latinos | 7.7 /100 | #223 | Tragic 1.3% |
| Latvians | 7.1 /100 | #224 | Tragic 1.3% |
| Panamanians | 7.1 /100 | #225 | Tragic 1.3% |
| Bahamians | 7.1 /100 | #226 | Tragic 1.3% |
| Taiwanese | 6.1 /100 | #227 | Tragic 1.3% |
| Luxembourgers | 6.1 /100 | #228 | Tragic 1.3% |
| Immigrants | Costa Rica | 5.5 /100 | #229 | Tragic 1.3% |