Immigrants from Barbados vs Norwegian Disability Age Over 75
COMPARE
Immigrants from Barbados
Norwegian
Disability Age Over 75
Disability Age Over 75 Comparison
Immigrants from Barbados
Norwegians
47.9%
DISABILITY AGE OVER 75
10.7/ 100
METRIC RATING
214th/ 347
METRIC RANK
45.5%
DISABILITY AGE OVER 75
99.9/ 100
METRIC RATING
35th/ 347
METRIC RANK
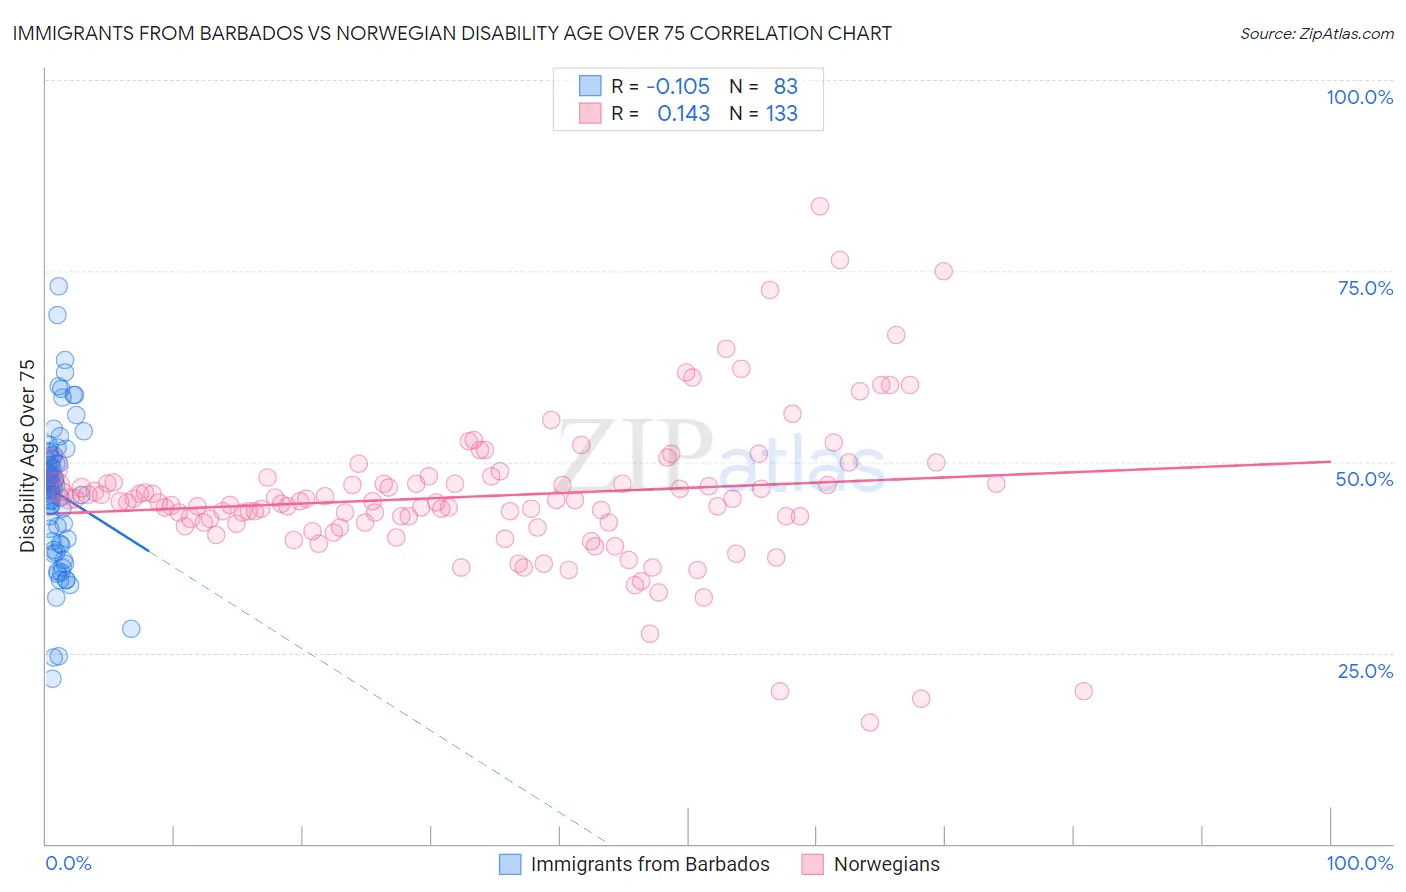
Immigrants from Barbados vs Norwegian Disability Age Over 75 Correlation Chart
The statistical analysis conducted on geographies consisting of 112,754,830 people shows a poor negative correlation between the proportion of Immigrants from Barbados and percentage of population with a disability over the age of 75 in the United States with a correlation coefficient (R) of -0.105 and weighted average of 47.9%. Similarly, the statistical analysis conducted on geographies consisting of 531,659,675 people shows a poor positive correlation between the proportion of Norwegians and percentage of population with a disability over the age of 75 in the United States with a correlation coefficient (R) of 0.143 and weighted average of 45.5%, a difference of 5.2%.
Disability Age Over 75 Correlation Summary
| Measurement | Immigrants from Barbados | Norwegian |
| Minimum | 21.7% | 15.8% |
| Maximum | 73.0% | 83.4% |
| Range | 51.3% | 67.6% |
| Mean | 45.9% | 45.5% |
| Median | 46.8% | 44.8% |
| Interquartile 25% (IQ1) | 39.6% | 42.0% |
| Interquartile 75% (IQ3) | 50.4% | 47.2% |
| Interquartile Range (IQR) | 10.8% | 5.2% |
| Standard Deviation (Sample) | 9.2% | 9.6% |
| Standard Deviation (Population) | 9.1% | 9.6% |
Similar Demographics by Disability Age Over 75
Demographics Similar to Immigrants from Barbados by Disability Age Over 75
In terms of disability age over 75, the demographic groups most similar to Immigrants from Barbados are Senegalese (47.9%, a difference of 0.0%), Immigrants from Panama (47.9%, a difference of 0.030%), Laotian (47.9%, a difference of 0.040%), Panamanian (47.9%, a difference of 0.060%), and Immigrants from Burma/Myanmar (47.9%, a difference of 0.060%).
| Demographics | Rating | Rank | Disability Age Over 75 |
| Immigrants | Syria | 17.4 /100 | #207 | Poor 47.8% |
| Immigrants | Senegal | 16.9 /100 | #208 | Poor 47.8% |
| Immigrants | Indonesia | 14.2 /100 | #209 | Poor 47.8% |
| Vietnamese | 11.9 /100 | #210 | Poor 47.9% |
| Panamanians | 11.8 /100 | #211 | Poor 47.9% |
| Immigrants | Burma/Myanmar | 11.7 /100 | #212 | Poor 47.9% |
| Laotians | 11.5 /100 | #213 | Poor 47.9% |
| Immigrants | Barbados | 10.7 /100 | #214 | Poor 47.9% |
| Senegalese | 10.7 /100 | #215 | Poor 47.9% |
| Immigrants | Panama | 10.2 /100 | #216 | Poor 47.9% |
| Immigrants | Grenada | 9.4 /100 | #217 | Tragic 47.9% |
| Immigrants | Western Africa | 8.3 /100 | #218 | Tragic 48.0% |
| Immigrants | Western Asia | 7.5 /100 | #219 | Tragic 48.0% |
| Bahamians | 7.4 /100 | #220 | Tragic 48.0% |
| Immigrants | Oceania | 7.3 /100 | #221 | Tragic 48.0% |
Demographics Similar to Norwegians by Disability Age Over 75
In terms of disability age over 75, the demographic groups most similar to Norwegians are Russian (45.5%, a difference of 0.010%), Immigrants from Taiwan (45.5%, a difference of 0.030%), South African (45.5%, a difference of 0.030%), Immigrants from Croatia (45.5%, a difference of 0.040%), and Italian (45.6%, a difference of 0.090%).
| Demographics | Rating | Rank | Disability Age Over 75 |
| Thais | 99.9 /100 | #28 | Exceptional 45.4% |
| Filipinos | 99.9 /100 | #29 | Exceptional 45.4% |
| Immigrants | Denmark | 99.9 /100 | #30 | Exceptional 45.4% |
| Immigrants | Bulgaria | 99.9 /100 | #31 | Exceptional 45.5% |
| Immigrants | Australia | 99.9 /100 | #32 | Exceptional 45.5% |
| Immigrants | Croatia | 99.9 /100 | #33 | Exceptional 45.5% |
| Russians | 99.9 /100 | #34 | Exceptional 45.5% |
| Norwegians | 99.9 /100 | #35 | Exceptional 45.5% |
| Immigrants | Taiwan | 99.9 /100 | #36 | Exceptional 45.5% |
| South Africans | 99.9 /100 | #37 | Exceptional 45.5% |
| Italians | 99.9 /100 | #38 | Exceptional 45.6% |
| Estonians | 99.9 /100 | #39 | Exceptional 45.6% |
| Slovenes | 99.9 /100 | #40 | Exceptional 45.6% |
| Immigrants | Singapore | 99.8 /100 | #41 | Exceptional 45.6% |
| Greeks | 99.8 /100 | #42 | Exceptional 45.6% |