Immigrants from Bahamas vs Immigrants from Bulgaria Disability Age Over 75
COMPARE
Immigrants from Bahamas
Immigrants from Bulgaria
Disability Age Over 75
Disability Age Over 75 Comparison
Immigrants from Bahamas
Immigrants from Bulgaria
47.7%
DISABILITY AGE OVER 75
20.7/ 100
METRIC RATING
202nd/ 347
METRIC RANK
45.5%
DISABILITY AGE OVER 75
99.9/ 100
METRIC RATING
31st/ 347
METRIC RANK
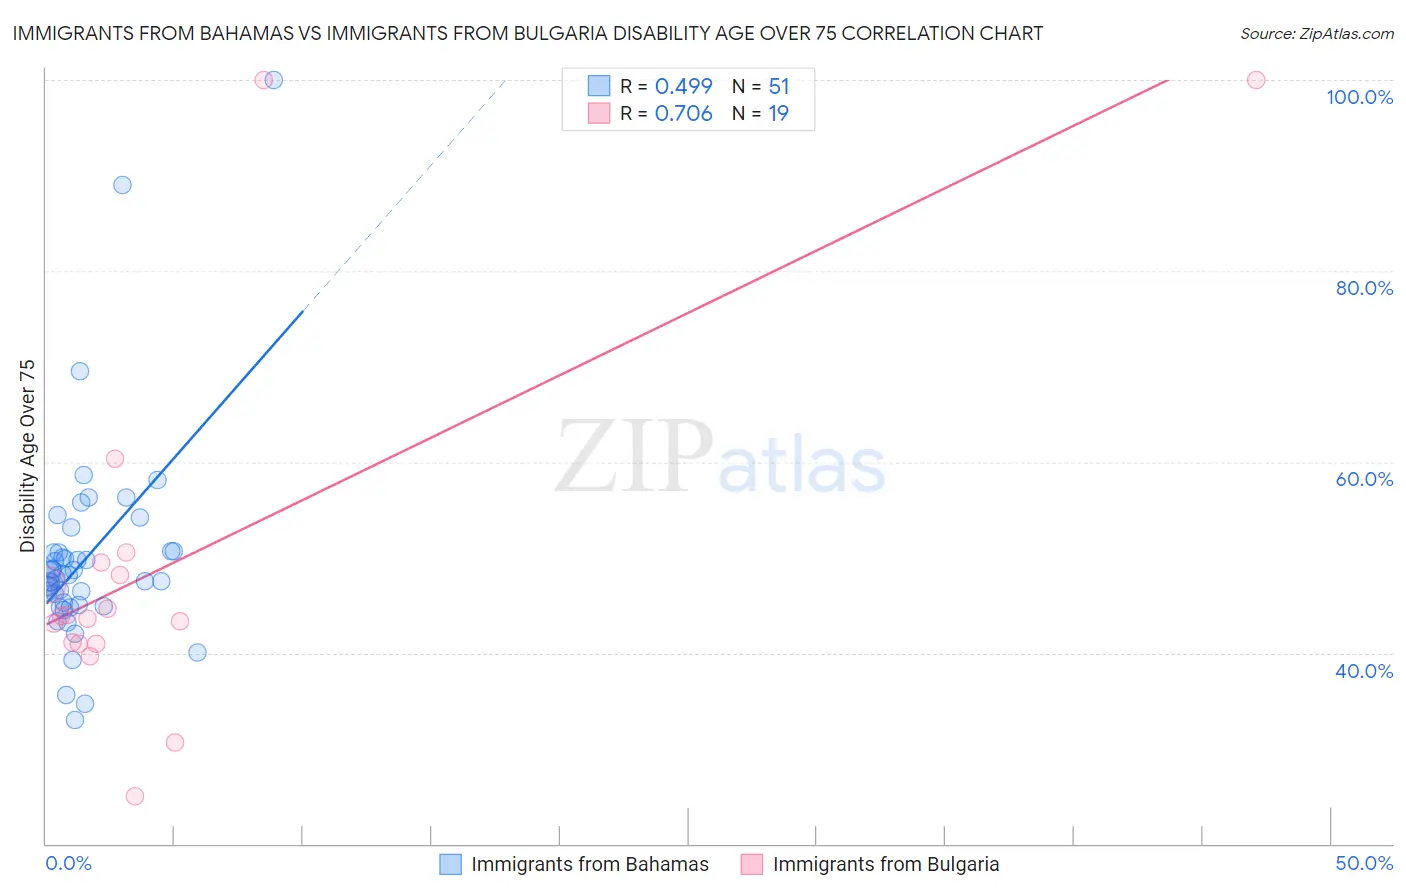
Immigrants from Bahamas vs Immigrants from Bulgaria Disability Age Over 75 Correlation Chart
The statistical analysis conducted on geographies consisting of 104,589,625 people shows a moderate positive correlation between the proportion of Immigrants from Bahamas and percentage of population with a disability over the age of 75 in the United States with a correlation coefficient (R) of 0.499 and weighted average of 47.7%. Similarly, the statistical analysis conducted on geographies consisting of 172,507,314 people shows a strong positive correlation between the proportion of Immigrants from Bulgaria and percentage of population with a disability over the age of 75 in the United States with a correlation coefficient (R) of 0.706 and weighted average of 45.5%, a difference of 4.9%.
Disability Age Over 75 Correlation Summary
| Measurement | Immigrants from Bahamas | Immigrants from Bulgaria |
| Minimum | 33.0% | 24.9% |
| Maximum | 100.0% | 100.0% |
| Range | 67.0% | 75.1% |
| Mean | 49.9% | 49.3% |
| Median | 48.2% | 43.9% |
| Interquartile 25% (IQ1) | 45.0% | 41.0% |
| Interquartile 75% (IQ3) | 50.7% | 49.5% |
| Interquartile Range (IQR) | 5.6% | 8.5% |
| Standard Deviation (Sample) | 11.0% | 19.3% |
| Standard Deviation (Population) | 10.9% | 18.8% |
Similar Demographics by Disability Age Over 75
Demographics Similar to Immigrants from Bahamas by Disability Age Over 75
In terms of disability age over 75, the demographic groups most similar to Immigrants from Bahamas are Immigrants from Cuba (47.7%, a difference of 0.010%), Immigrants from Somalia (47.7%, a difference of 0.020%), Trinidadian and Tobagonian (47.7%, a difference of 0.020%), Nigerian (47.7%, a difference of 0.050%), and Immigrants from Eritrea (47.7%, a difference of 0.060%).
| Demographics | Rating | Rank | Disability Age Over 75 |
| Immigrants | Trinidad and Tobago | 25.3 /100 | #195 | Fair 47.6% |
| Immigrants | Portugal | 23.8 /100 | #196 | Fair 47.6% |
| Pakistanis | 23.4 /100 | #197 | Fair 47.7% |
| Immigrants | Ukraine | 23.2 /100 | #198 | Fair 47.7% |
| Immigrants | Eritrea | 22.4 /100 | #199 | Fair 47.7% |
| Immigrants | Somalia | 21.4 /100 | #200 | Fair 47.7% |
| Immigrants | Cuba | 20.9 /100 | #201 | Fair 47.7% |
| Immigrants | Bahamas | 20.7 /100 | #202 | Fair 47.7% |
| Trinidadians and Tobagonians | 20.0 /100 | #203 | Fair 47.7% |
| Nigerians | 19.2 /100 | #204 | Poor 47.7% |
| Immigrants | Ghana | 19.1 /100 | #205 | Poor 47.7% |
| Jamaicans | 19.0 /100 | #206 | Poor 47.7% |
| Immigrants | Syria | 17.4 /100 | #207 | Poor 47.8% |
| Immigrants | Senegal | 16.9 /100 | #208 | Poor 47.8% |
| Immigrants | Indonesia | 14.2 /100 | #209 | Poor 47.8% |
Demographics Similar to Immigrants from Bulgaria by Disability Age Over 75
In terms of disability age over 75, the demographic groups most similar to Immigrants from Bulgaria are Immigrants from Australia (45.5%, a difference of 0.030%), Immigrants from Denmark (45.4%, a difference of 0.070%), Filipino (45.4%, a difference of 0.090%), Immigrants from Croatia (45.5%, a difference of 0.10%), and Thai (45.4%, a difference of 0.13%).
| Demographics | Rating | Rank | Disability Age Over 75 |
| Poles | 99.9 /100 | #24 | Exceptional 45.3% |
| Immigrants | Bolivia | 99.9 /100 | #25 | Exceptional 45.4% |
| Macedonians | 99.9 /100 | #26 | Exceptional 45.4% |
| Immigrants | Poland | 99.9 /100 | #27 | Exceptional 45.4% |
| Thais | 99.9 /100 | #28 | Exceptional 45.4% |
| Filipinos | 99.9 /100 | #29 | Exceptional 45.4% |
| Immigrants | Denmark | 99.9 /100 | #30 | Exceptional 45.4% |
| Immigrants | Bulgaria | 99.9 /100 | #31 | Exceptional 45.5% |
| Immigrants | Australia | 99.9 /100 | #32 | Exceptional 45.5% |
| Immigrants | Croatia | 99.9 /100 | #33 | Exceptional 45.5% |
| Russians | 99.9 /100 | #34 | Exceptional 45.5% |
| Norwegians | 99.9 /100 | #35 | Exceptional 45.5% |
| Immigrants | Taiwan | 99.9 /100 | #36 | Exceptional 45.5% |
| South Africans | 99.9 /100 | #37 | Exceptional 45.5% |
| Italians | 99.9 /100 | #38 | Exceptional 45.6% |