Hopi vs Iraqi Ambulatory Disability
COMPARE
Hopi
Iraqi
Ambulatory Disability
Ambulatory Disability Comparison
Hopi
Iraqis
7.6%
AMBULATORY DISABILITY
0.0/ 100
METRIC RATING
328th/ 347
METRIC RANK
6.1%
AMBULATORY DISABILITY
62.8/ 100
METRIC RATING
166th/ 347
METRIC RANK
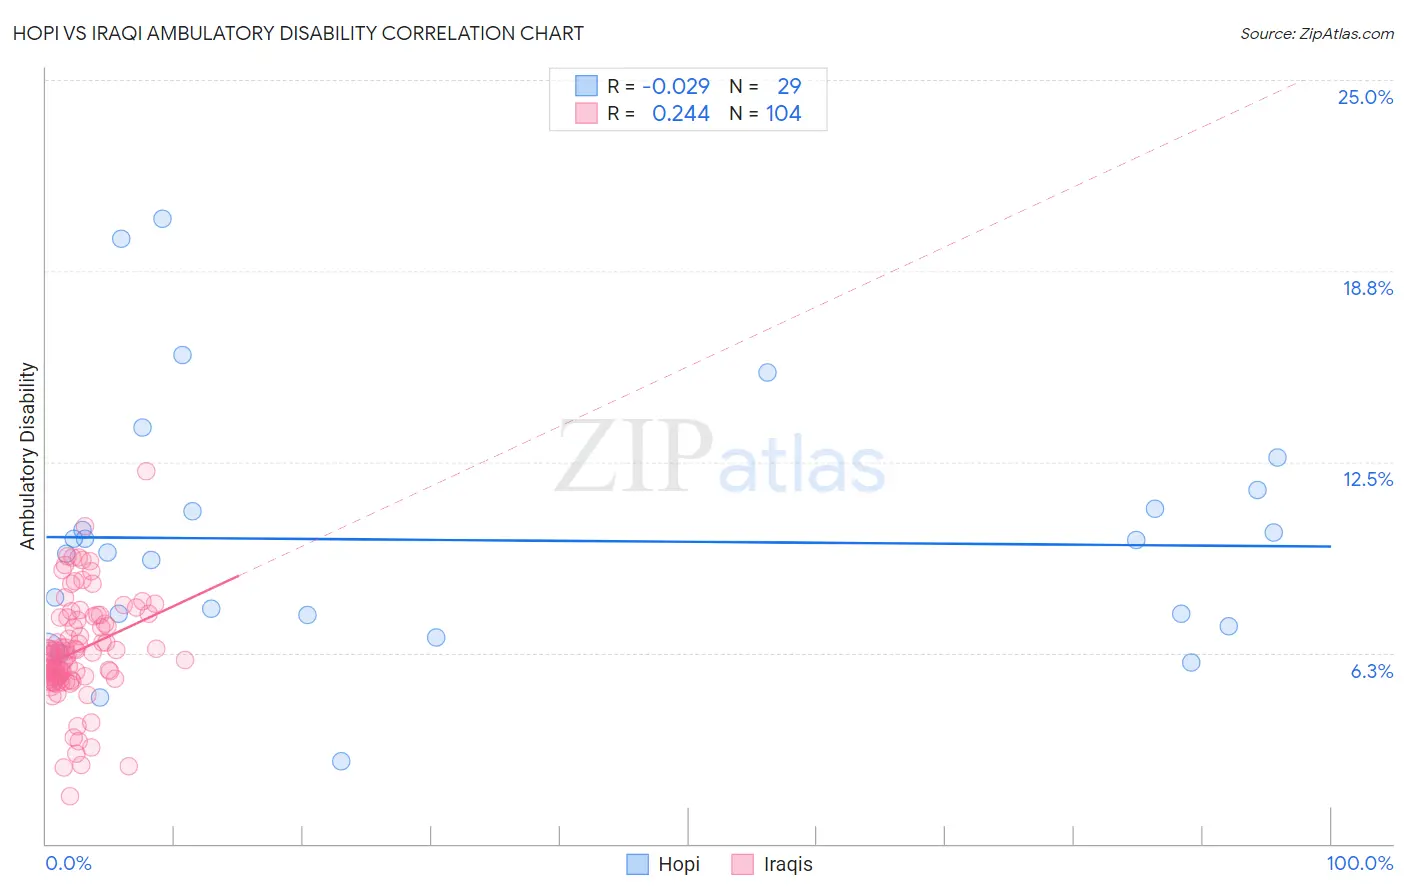
Hopi vs Iraqi Ambulatory Disability Correlation Chart
The statistical analysis conducted on geographies consisting of 74,727,187 people shows no correlation between the proportion of Hopi and percentage of population with ambulatory disability in the United States with a correlation coefficient (R) of -0.029 and weighted average of 7.6%. Similarly, the statistical analysis conducted on geographies consisting of 170,645,130 people shows a weak positive correlation between the proportion of Iraqis and percentage of population with ambulatory disability in the United States with a correlation coefficient (R) of 0.244 and weighted average of 6.1%, a difference of 25.0%.
Ambulatory Disability Correlation Summary
| Measurement | Hopi | Iraqi |
| Minimum | 2.7% | 1.6% |
| Maximum | 20.4% | 12.2% |
| Range | 17.7% | 10.7% |
| Mean | 9.9% | 6.3% |
| Median | 9.5% | 6.2% |
| Interquartile 25% (IQ1) | 7.3% | 5.4% |
| Interquartile 75% (IQ3) | 11.3% | 7.4% |
| Interquartile Range (IQR) | 4.0% | 2.0% |
| Standard Deviation (Sample) | 4.1% | 1.7% |
| Standard Deviation (Population) | 4.0% | 1.7% |
Similar Demographics by Ambulatory Disability
Demographics Similar to Hopi by Ambulatory Disability
In terms of ambulatory disability, the demographic groups most similar to Hopi are Pueblo (7.6%, a difference of 0.040%), Native/Alaskan (7.5%, a difference of 0.94%), Black/African American (7.5%, a difference of 0.95%), Comanche (7.5%, a difference of 1.1%), and Navajo (7.5%, a difference of 1.1%).
| Demographics | Rating | Rank | Ambulatory Disability |
| Apache | 0.0 /100 | #321 | Tragic 7.4% |
| Osage | 0.0 /100 | #322 | Tragic 7.4% |
| Americans | 0.0 /100 | #323 | Tragic 7.4% |
| Navajo | 0.0 /100 | #324 | Tragic 7.5% |
| Comanche | 0.0 /100 | #325 | Tragic 7.5% |
| Blacks/African Americans | 0.0 /100 | #326 | Tragic 7.5% |
| Natives/Alaskans | 0.0 /100 | #327 | Tragic 7.5% |
| Hopi | 0.0 /100 | #328 | Tragic 7.6% |
| Pueblo | 0.0 /100 | #329 | Tragic 7.6% |
| Paiute | 0.0 /100 | #330 | Tragic 7.7% |
| Cajuns | 0.0 /100 | #331 | Tragic 7.8% |
| Menominee | 0.0 /100 | #332 | Tragic 7.8% |
| Cherokee | 0.0 /100 | #333 | Tragic 7.9% |
| Yuman | 0.0 /100 | #334 | Tragic 7.9% |
| Chickasaw | 0.0 /100 | #335 | Tragic 8.0% |
Demographics Similar to Iraqis by Ambulatory Disability
In terms of ambulatory disability, the demographic groups most similar to Iraqis are Nicaraguan (6.1%, a difference of 0.020%), Basque (6.1%, a difference of 0.050%), Immigrants from Oceania (6.1%, a difference of 0.12%), Ecuadorian (6.1%, a difference of 0.13%), and Lebanese (6.1%, a difference of 0.20%).
| Demographics | Rating | Rank | Ambulatory Disability |
| Immigrants | Latvia | 71.1 /100 | #159 | Good 6.0% |
| Central Americans | 69.8 /100 | #160 | Good 6.0% |
| Immigrants | Belarus | 69.2 /100 | #161 | Good 6.1% |
| Nigerians | 67.1 /100 | #162 | Good 6.1% |
| Lebanese | 66.2 /100 | #163 | Good 6.1% |
| Basques | 63.7 /100 | #164 | Good 6.1% |
| Nicaraguans | 63.2 /100 | #165 | Good 6.1% |
| Iraqis | 62.8 /100 | #166 | Good 6.1% |
| Immigrants | Oceania | 60.7 /100 | #167 | Good 6.1% |
| Ecuadorians | 60.5 /100 | #168 | Good 6.1% |
| Immigrants | Southern Europe | 58.1 /100 | #169 | Average 6.1% |
| Immigrants | Ecuador | 53.8 /100 | #170 | Average 6.1% |
| Moroccans | 52.6 /100 | #171 | Average 6.1% |
| Immigrants | Burma/Myanmar | 52.2 /100 | #172 | Average 6.1% |
| Croatians | 51.2 /100 | #173 | Average 6.1% |