Guatemalan vs Chilean Disability Age 18 to 34
COMPARE
Guatemalan
Chilean
Disability Age 18 to 34
Disability Age 18 to 34 Comparison
Guatemalans
Chileans
6.4%
DISABILITY AGE 18 TO 34
89.6/ 100
METRIC RATING
132nd/ 347
METRIC RANK
6.3%
DISABILITY AGE 18 TO 34
93.5/ 100
METRIC RATING
119th/ 347
METRIC RANK
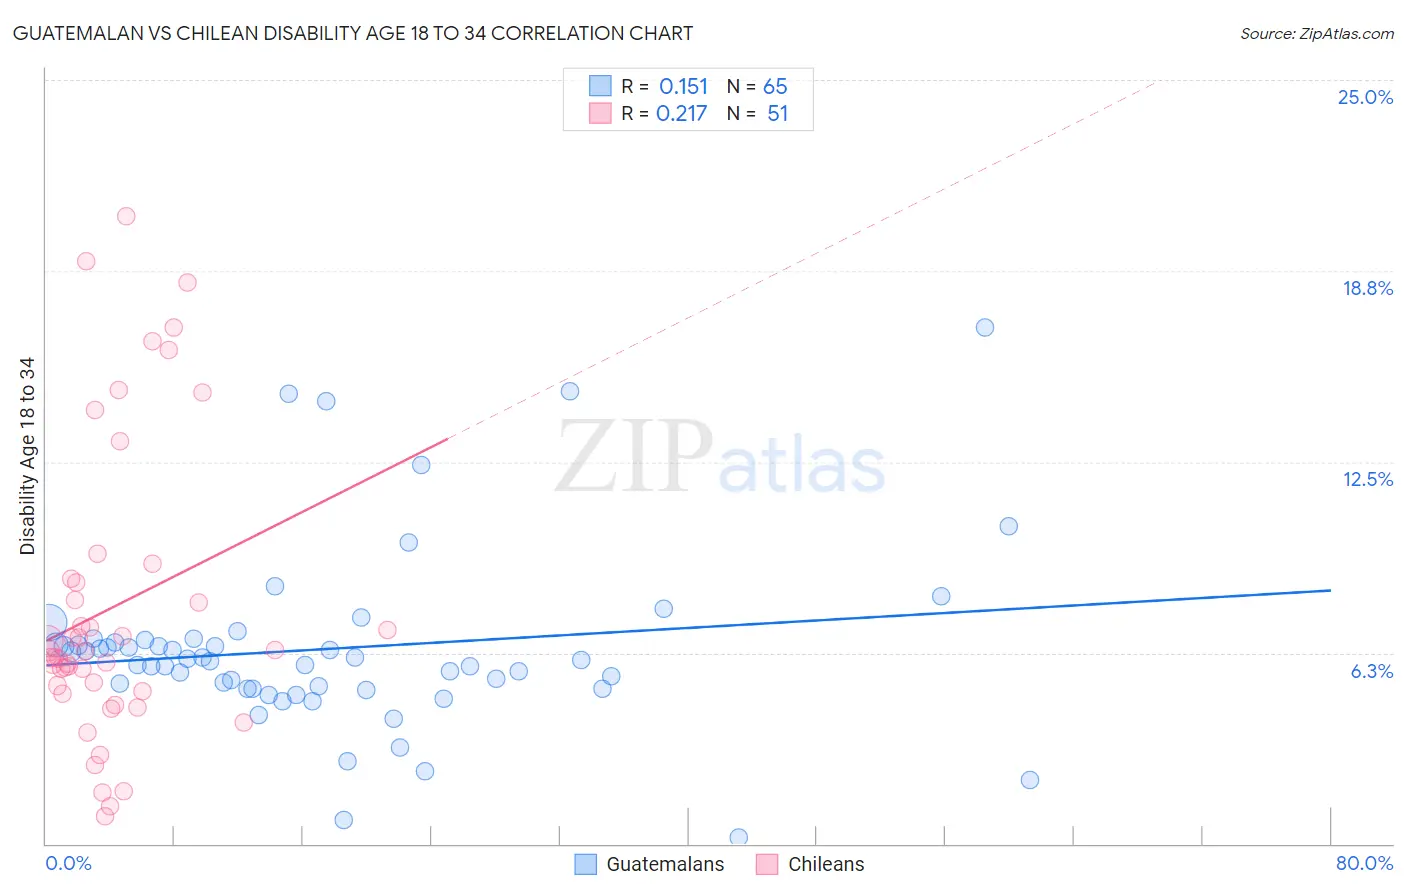
Guatemalan vs Chilean Disability Age 18 to 34 Correlation Chart
The statistical analysis conducted on geographies consisting of 408,778,912 people shows a poor positive correlation between the proportion of Guatemalans and percentage of population with a disability between the ages 18 and 35 in the United States with a correlation coefficient (R) of 0.151 and weighted average of 6.4%. Similarly, the statistical analysis conducted on geographies consisting of 256,471,605 people shows a weak positive correlation between the proportion of Chileans and percentage of population with a disability between the ages 18 and 35 in the United States with a correlation coefficient (R) of 0.217 and weighted average of 6.3%, a difference of 0.92%.
Disability Age 18 to 34 Correlation Summary
| Measurement | Guatemalan | Chilean |
| Minimum | 0.22% | 0.92% |
| Maximum | 16.9% | 20.5% |
| Range | 16.7% | 19.6% |
| Mean | 6.4% | 7.7% |
| Median | 6.0% | 6.3% |
| Interquartile 25% (IQ1) | 5.1% | 5.0% |
| Interquartile 75% (IQ3) | 6.6% | 8.7% |
| Interquartile Range (IQR) | 1.6% | 3.7% |
| Standard Deviation (Sample) | 3.0% | 4.8% |
| Standard Deviation (Population) | 2.9% | 4.8% |
Demographics Similar to Guatemalans and Chileans by Disability Age 18 to 34
In terms of disability age 18 to 34, the demographic groups most similar to Guatemalans are Brazilian (6.4%, a difference of 0.12%), Immigrants from Europe (6.4%, a difference of 0.15%), Immigrants from Saudi Arabia (6.3%, a difference of 0.16%), Immigrants from Dominica (6.3%, a difference of 0.18%), and Immigrants from Italy (6.3%, a difference of 0.19%). Similarly, the demographic groups most similar to Chileans are Immigrants from Ukraine (6.3%, a difference of 0.030%), Immigrants from Guatemala (6.3%, a difference of 0.030%), Immigrants from Nepal (6.3%, a difference of 0.050%), Immigrants from Czechoslovakia (6.3%, a difference of 0.050%), and Immigrants from Costa Rica (6.3%, a difference of 0.15%).
| Demographics | Rating | Rank | Disability Age 18 to 34 |
| Koreans | 94.1 /100 | #115 | Exceptional 6.3% |
| Immigrants | Costa Rica | 94.0 /100 | #116 | Exceptional 6.3% |
| Immigrants | Jordan | 94.0 /100 | #117 | Exceptional 6.3% |
| Immigrants | Nepal | 93.7 /100 | #118 | Exceptional 6.3% |
| Chileans | 93.5 /100 | #119 | Exceptional 6.3% |
| Immigrants | Ukraine | 93.4 /100 | #120 | Exceptional 6.3% |
| Immigrants | Guatemala | 93.4 /100 | #121 | Exceptional 6.3% |
| Immigrants | Czechoslovakia | 93.3 /100 | #122 | Exceptional 6.3% |
| Costa Ricans | 92.9 /100 | #123 | Exceptional 6.3% |
| Immigrants | Morocco | 92.9 /100 | #124 | Exceptional 6.3% |
| Macedonians | 92.6 /100 | #125 | Exceptional 6.3% |
| Immigrants | Switzerland | 92.5 /100 | #126 | Exceptional 6.3% |
| West Indians | 92.0 /100 | #127 | Exceptional 6.3% |
| Chinese | 91.9 /100 | #128 | Exceptional 6.3% |
| Immigrants | Italy | 90.5 /100 | #129 | Exceptional 6.3% |
| Immigrants | Dominica | 90.5 /100 | #130 | Exceptional 6.3% |
| Immigrants | Saudi Arabia | 90.4 /100 | #131 | Exceptional 6.3% |
| Guatemalans | 89.6 /100 | #132 | Excellent 6.4% |
| Brazilians | 89.0 /100 | #133 | Excellent 6.4% |
| Immigrants | Europe | 88.8 /100 | #134 | Excellent 6.4% |
| Palestinians | 88.5 /100 | #135 | Excellent 6.4% |