Bhutanese vs Chilean Disability Age 18 to 34
COMPARE
Bhutanese
Chilean
Disability Age 18 to 34
Disability Age 18 to 34 Comparison
Bhutanese
Chileans
6.2%
DISABILITY AGE 18 TO 34
96.2/ 100
METRIC RATING
105th/ 347
METRIC RANK
6.3%
DISABILITY AGE 18 TO 34
93.5/ 100
METRIC RATING
119th/ 347
METRIC RANK
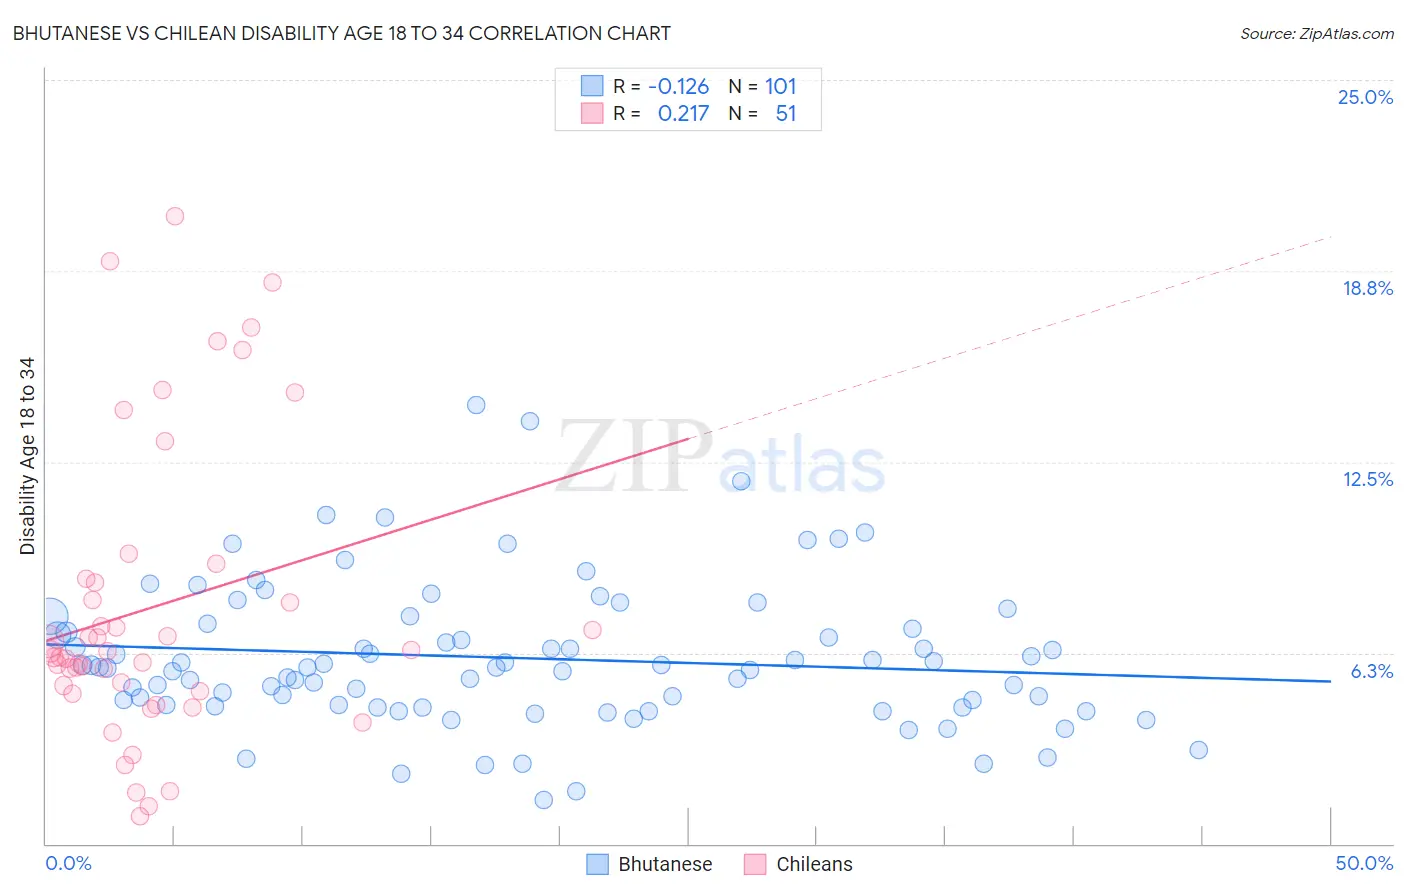
Bhutanese vs Chilean Disability Age 18 to 34 Correlation Chart
The statistical analysis conducted on geographies consisting of 454,199,995 people shows a poor negative correlation between the proportion of Bhutanese and percentage of population with a disability between the ages 18 and 35 in the United States with a correlation coefficient (R) of -0.126 and weighted average of 6.2%. Similarly, the statistical analysis conducted on geographies consisting of 256,471,605 people shows a weak positive correlation between the proportion of Chileans and percentage of population with a disability between the ages 18 and 35 in the United States with a correlation coefficient (R) of 0.217 and weighted average of 6.3%, a difference of 1.0%.
Disability Age 18 to 34 Correlation Summary
| Measurement | Bhutanese | Chilean |
| Minimum | 1.4% | 0.92% |
| Maximum | 14.4% | 20.5% |
| Range | 12.9% | 19.6% |
| Mean | 6.1% | 7.7% |
| Median | 5.8% | 6.3% |
| Interquartile 25% (IQ1) | 4.5% | 5.0% |
| Interquartile 75% (IQ3) | 7.1% | 8.7% |
| Interquartile Range (IQR) | 2.6% | 3.7% |
| Standard Deviation (Sample) | 2.4% | 4.8% |
| Standard Deviation (Population) | 2.3% | 4.8% |
Demographics Similar to Bhutanese and Chileans by Disability Age 18 to 34
In terms of disability age 18 to 34, the demographic groups most similar to Bhutanese are Mongolian (6.2%, a difference of 0.0%), Laotian (6.2%, a difference of 0.090%), Immigrants from Bulgaria (6.2%, a difference of 0.090%), Immigrants from Afghanistan (6.2%, a difference of 0.15%), and Ethiopian (6.2%, a difference of 0.19%). Similarly, the demographic groups most similar to Chileans are Immigrants from Ukraine (6.3%, a difference of 0.030%), Immigrants from Guatemala (6.3%, a difference of 0.030%), Immigrants from Nepal (6.3%, a difference of 0.050%), Immigrants from Czechoslovakia (6.3%, a difference of 0.050%), and Immigrants from Costa Rica (6.3%, a difference of 0.15%).
| Demographics | Rating | Rank | Disability Age 18 to 34 |
| Laotians | 96.4 /100 | #102 | Exceptional 6.2% |
| Immigrants | Bulgaria | 96.3 /100 | #103 | Exceptional 6.2% |
| Mongolians | 96.2 /100 | #104 | Exceptional 6.2% |
| Bhutanese | 96.2 /100 | #105 | Exceptional 6.2% |
| Immigrants | Afghanistan | 95.9 /100 | #106 | Exceptional 6.2% |
| Ethiopians | 95.8 /100 | #107 | Exceptional 6.2% |
| Immigrants | Croatia | 95.7 /100 | #108 | Exceptional 6.2% |
| Sri Lankans | 95.5 /100 | #109 | Exceptional 6.2% |
| Immigrants | Brazil | 95.2 /100 | #110 | Exceptional 6.3% |
| Immigrants | France | 95.1 /100 | #111 | Exceptional 6.3% |
| Immigrants | Romania | 94.9 /100 | #112 | Exceptional 6.3% |
| Immigrants | Latin America | 94.9 /100 | #113 | Exceptional 6.3% |
| Immigrants | South Eastern Asia | 94.4 /100 | #114 | Exceptional 6.3% |
| Koreans | 94.1 /100 | #115 | Exceptional 6.3% |
| Immigrants | Costa Rica | 94.0 /100 | #116 | Exceptional 6.3% |
| Immigrants | Jordan | 94.0 /100 | #117 | Exceptional 6.3% |
| Immigrants | Nepal | 93.7 /100 | #118 | Exceptional 6.3% |
| Chileans | 93.5 /100 | #119 | Exceptional 6.3% |
| Immigrants | Ukraine | 93.4 /100 | #120 | Exceptional 6.3% |
| Immigrants | Guatemala | 93.4 /100 | #121 | Exceptional 6.3% |
| Immigrants | Czechoslovakia | 93.3 /100 | #122 | Exceptional 6.3% |