Greek vs Immigrants from Panama Disability Age 65 to 74
COMPARE
Greek
Immigrants from Panama
Disability Age 65 to 74
Disability Age 65 to 74 Comparison
Greeks
Immigrants from Panama
21.8%
DISABILITY AGE 65 TO 74
99.0/ 100
METRIC RATING
76th/ 347
METRIC RANK
24.1%
DISABILITY AGE 65 TO 74
8.6/ 100
METRIC RATING
224th/ 347
METRIC RANK
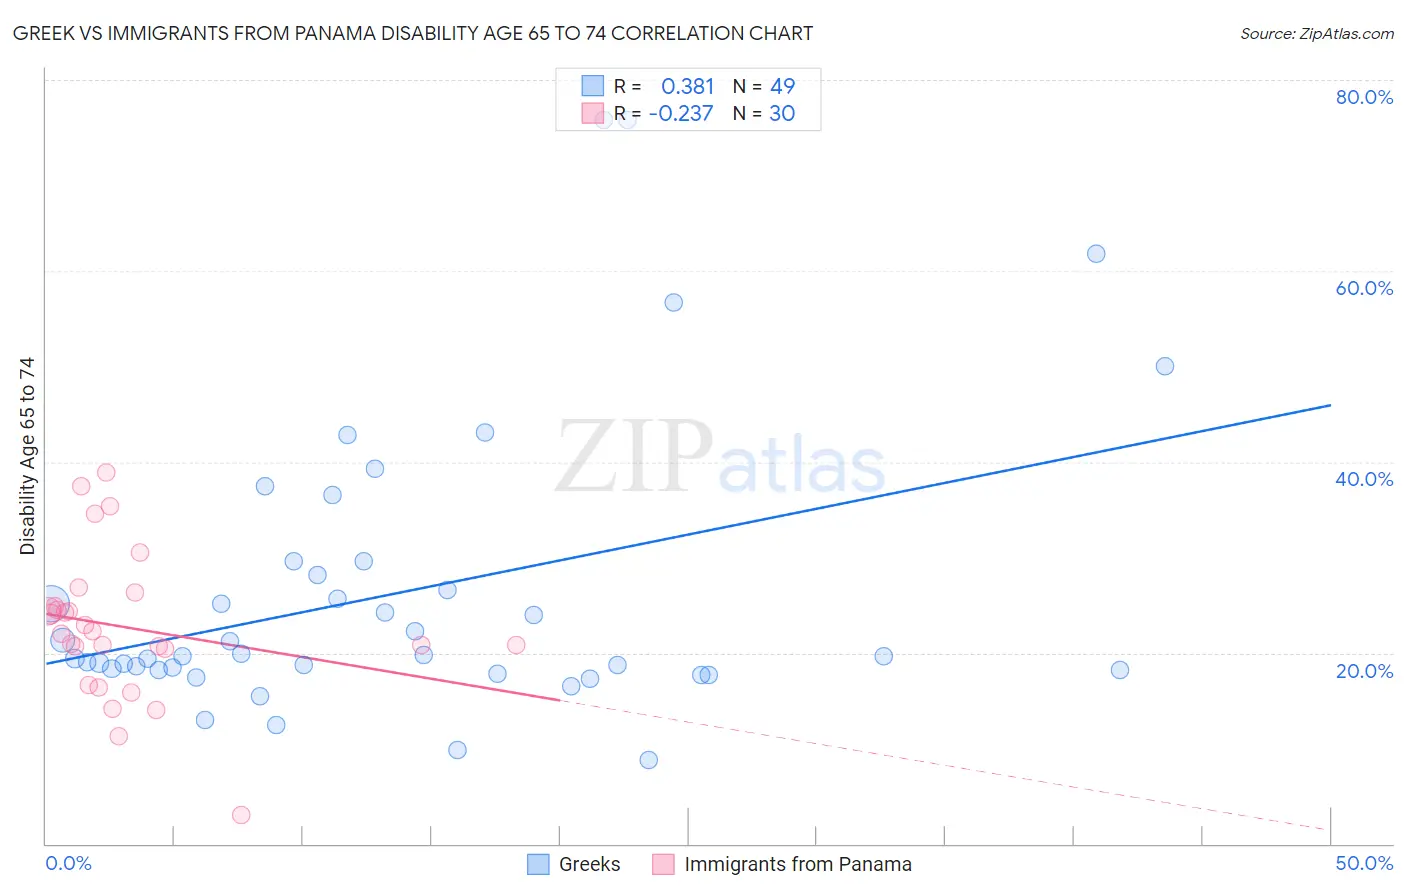
Greek vs Immigrants from Panama Disability Age 65 to 74 Correlation Chart
The statistical analysis conducted on geographies consisting of 481,507,065 people shows a mild positive correlation between the proportion of Greeks and percentage of population with a disability between the ages 65 and 75 in the United States with a correlation coefficient (R) of 0.381 and weighted average of 21.8%. Similarly, the statistical analysis conducted on geographies consisting of 221,053,627 people shows a weak negative correlation between the proportion of Immigrants from Panama and percentage of population with a disability between the ages 65 and 75 in the United States with a correlation coefficient (R) of -0.237 and weighted average of 24.1%, a difference of 10.9%.
Disability Age 65 to 74 Correlation Summary
| Measurement | Greek | Immigrants from Panama |
| Minimum | 8.8% | 3.0% |
| Maximum | 75.9% | 38.9% |
| Range | 67.1% | 35.9% |
| Mean | 26.3% | 22.7% |
| Median | 19.6% | 22.1% |
| Interquartile 25% (IQ1) | 18.2% | 20.4% |
| Interquartile 75% (IQ3) | 28.9% | 24.9% |
| Interquartile Range (IQR) | 10.7% | 4.4% |
| Standard Deviation (Sample) | 15.2% | 7.7% |
| Standard Deviation (Population) | 15.1% | 7.5% |
Similar Demographics by Disability Age 65 to 74
Demographics Similar to Greeks by Disability Age 65 to 74
In terms of disability age 65 to 74, the demographic groups most similar to Greeks are Mongolian (21.8%, a difference of 0.010%), Cambodian (21.8%, a difference of 0.030%), Immigrants from Venezuela (21.8%, a difference of 0.040%), Immigrants from Poland (21.8%, a difference of 0.060%), and Immigrants from Eastern Europe (21.8%, a difference of 0.11%).
| Demographics | Rating | Rank | Disability Age 65 to 74 |
| Immigrants | Egypt | 99.2 /100 | #69 | Exceptional 21.7% |
| Chinese | 99.2 /100 | #70 | Exceptional 21.7% |
| Immigrants | Belarus | 99.2 /100 | #71 | Exceptional 21.7% |
| Immigrants | Hungary | 99.2 /100 | #72 | Exceptional 21.7% |
| Immigrants | Venezuela | 99.0 /100 | #73 | Exceptional 21.8% |
| Cambodians | 99.0 /100 | #74 | Exceptional 21.8% |
| Mongolians | 99.0 /100 | #75 | Exceptional 21.8% |
| Greeks | 99.0 /100 | #76 | Exceptional 21.8% |
| Immigrants | Poland | 99.0 /100 | #77 | Exceptional 21.8% |
| Immigrants | Eastern Europe | 99.0 /100 | #78 | Exceptional 21.8% |
| Venezuelans | 99.0 /100 | #79 | Exceptional 21.8% |
| Immigrants | Norway | 98.9 /100 | #80 | Exceptional 21.8% |
| Croatians | 98.9 /100 | #81 | Exceptional 21.8% |
| Immigrants | Indonesia | 98.7 /100 | #82 | Exceptional 21.9% |
| Immigrants | Brazil | 98.5 /100 | #83 | Exceptional 21.9% |
Demographics Similar to Immigrants from Panama by Disability Age 65 to 74
In terms of disability age 65 to 74, the demographic groups most similar to Immigrants from Panama are Immigrants from Middle Africa (24.1%, a difference of 0.050%), Bermudan (24.2%, a difference of 0.090%), Iraqi (24.2%, a difference of 0.090%), Native Hawaiian (24.1%, a difference of 0.12%), and Nigerian (24.2%, a difference of 0.16%).
| Demographics | Rating | Rank | Disability Age 65 to 74 |
| Immigrants | Portugal | 11.7 /100 | #217 | Poor 24.0% |
| Immigrants | Nigeria | 11.7 /100 | #218 | Poor 24.0% |
| Immigrants | Burma/Myanmar | 11.6 /100 | #219 | Poor 24.0% |
| Ghanaians | 10.4 /100 | #220 | Poor 24.1% |
| Immigrants | Nicaragua | 9.8 /100 | #221 | Tragic 24.1% |
| Native Hawaiians | 9.3 /100 | #222 | Tragic 24.1% |
| Immigrants | Middle Africa | 8.9 /100 | #223 | Tragic 24.1% |
| Immigrants | Panama | 8.6 /100 | #224 | Tragic 24.1% |
| Bermudans | 8.2 /100 | #225 | Tragic 24.2% |
| Iraqis | 8.1 /100 | #226 | Tragic 24.2% |
| Nigerians | 7.8 /100 | #227 | Tragic 24.2% |
| Whites/Caucasians | 6.6 /100 | #228 | Tragic 24.2% |
| Celtics | 6.4 /100 | #229 | Tragic 24.2% |
| Barbadians | 6.0 /100 | #230 | Tragic 24.3% |
| Immigrants | Thailand | 5.2 /100 | #231 | Tragic 24.3% |