Macedonian vs Immigrants from Panama Disability Age 65 to 74
COMPARE
Macedonian
Immigrants from Panama
Disability Age 65 to 74
Disability Age 65 to 74 Comparison
Macedonians
Immigrants from Panama
21.3%
DISABILITY AGE 65 TO 74
99.7/ 100
METRIC RATING
42nd/ 347
METRIC RANK
24.1%
DISABILITY AGE 65 TO 74
8.6/ 100
METRIC RATING
224th/ 347
METRIC RANK
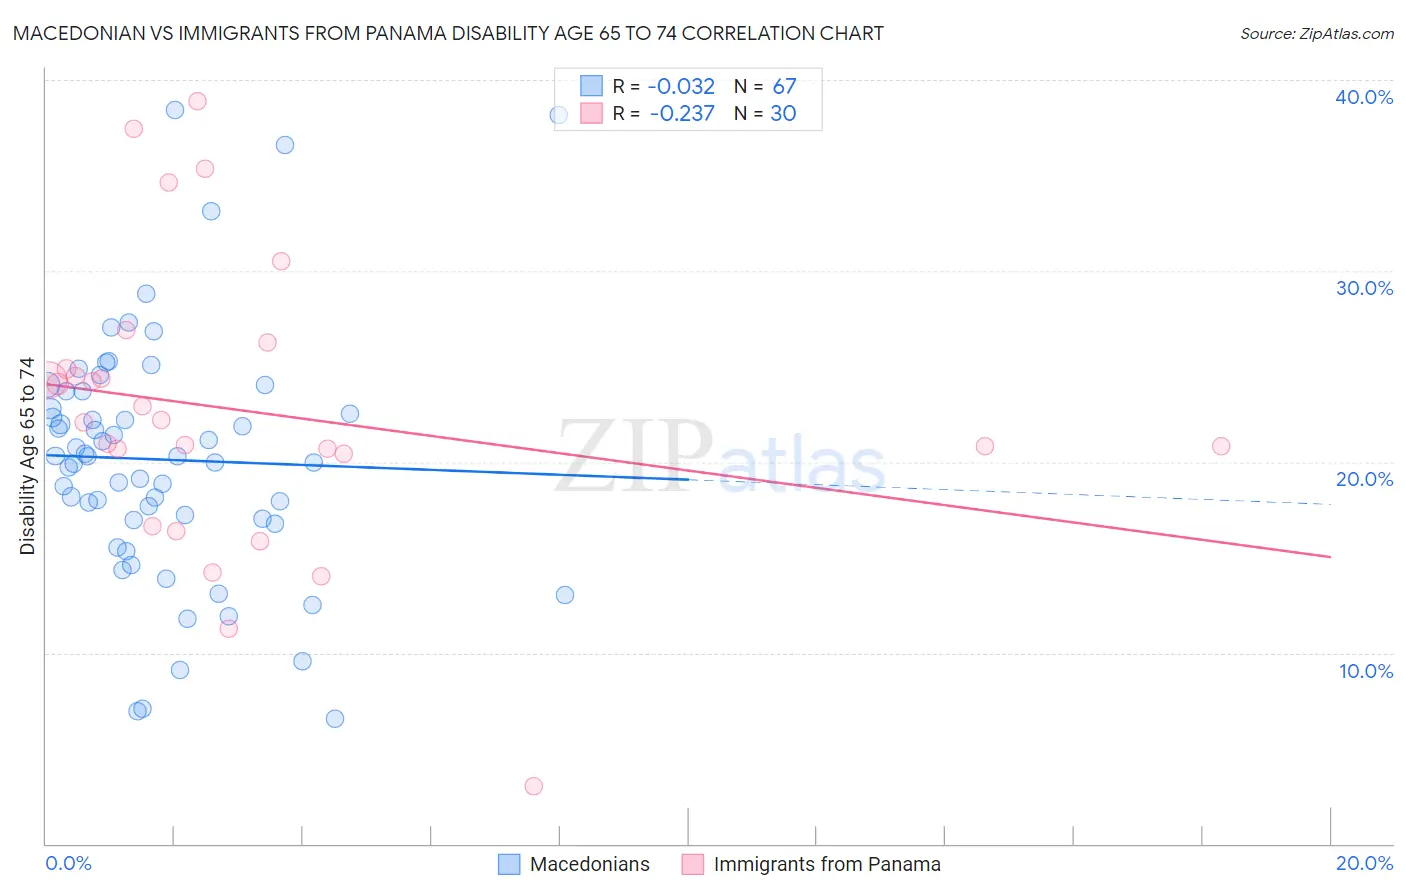
Macedonian vs Immigrants from Panama Disability Age 65 to 74 Correlation Chart
The statistical analysis conducted on geographies consisting of 132,559,709 people shows no correlation between the proportion of Macedonians and percentage of population with a disability between the ages 65 and 75 in the United States with a correlation coefficient (R) of -0.032 and weighted average of 21.3%. Similarly, the statistical analysis conducted on geographies consisting of 221,053,627 people shows a weak negative correlation between the proportion of Immigrants from Panama and percentage of population with a disability between the ages 65 and 75 in the United States with a correlation coefficient (R) of -0.237 and weighted average of 24.1%, a difference of 13.1%.
Disability Age 65 to 74 Correlation Summary
| Measurement | Macedonian | Immigrants from Panama |
| Minimum | 6.6% | 3.0% |
| Maximum | 38.4% | 38.9% |
| Range | 31.8% | 35.9% |
| Mean | 20.1% | 22.7% |
| Median | 20.3% | 22.1% |
| Interquartile 25% (IQ1) | 17.0% | 20.4% |
| Interquartile 75% (IQ3) | 23.7% | 24.9% |
| Interquartile Range (IQR) | 6.7% | 4.4% |
| Standard Deviation (Sample) | 6.5% | 7.7% |
| Standard Deviation (Population) | 6.5% | 7.5% |
Similar Demographics by Disability Age 65 to 74
Demographics Similar to Macedonians by Disability Age 65 to 74
In terms of disability age 65 to 74, the demographic groups most similar to Macedonians are Immigrants from Croatia (21.3%, a difference of 0.020%), Estonian (21.4%, a difference of 0.15%), Asian (21.4%, a difference of 0.17%), Immigrants from Turkey (21.4%, a difference of 0.20%), and Immigrants from Bulgaria (21.4%, a difference of 0.20%).
| Demographics | Rating | Rank | Disability Age 65 to 74 |
| Bulgarians | 99.9 /100 | #35 | Exceptional 21.1% |
| Immigrants | Switzerland | 99.8 /100 | #36 | Exceptional 21.1% |
| Israelis | 99.8 /100 | #37 | Exceptional 21.2% |
| Russians | 99.8 /100 | #38 | Exceptional 21.2% |
| Argentineans | 99.8 /100 | #39 | Exceptional 21.2% |
| Latvians | 99.8 /100 | #40 | Exceptional 21.2% |
| Immigrants | Austria | 99.8 /100 | #41 | Exceptional 21.2% |
| Macedonians | 99.7 /100 | #42 | Exceptional 21.3% |
| Immigrants | Croatia | 99.7 /100 | #43 | Exceptional 21.3% |
| Estonians | 99.7 /100 | #44 | Exceptional 21.4% |
| Asians | 99.7 /100 | #45 | Exceptional 21.4% |
| Immigrants | Turkey | 99.7 /100 | #46 | Exceptional 21.4% |
| Immigrants | Bulgaria | 99.7 /100 | #47 | Exceptional 21.4% |
| Lithuanians | 99.7 /100 | #48 | Exceptional 21.4% |
| Luxembourgers | 99.7 /100 | #49 | Exceptional 21.4% |
Demographics Similar to Immigrants from Panama by Disability Age 65 to 74
In terms of disability age 65 to 74, the demographic groups most similar to Immigrants from Panama are Immigrants from Middle Africa (24.1%, a difference of 0.050%), Bermudan (24.2%, a difference of 0.090%), Iraqi (24.2%, a difference of 0.090%), Native Hawaiian (24.1%, a difference of 0.12%), and Nigerian (24.2%, a difference of 0.16%).
| Demographics | Rating | Rank | Disability Age 65 to 74 |
| Immigrants | Portugal | 11.7 /100 | #217 | Poor 24.0% |
| Immigrants | Nigeria | 11.7 /100 | #218 | Poor 24.0% |
| Immigrants | Burma/Myanmar | 11.6 /100 | #219 | Poor 24.0% |
| Ghanaians | 10.4 /100 | #220 | Poor 24.1% |
| Immigrants | Nicaragua | 9.8 /100 | #221 | Tragic 24.1% |
| Native Hawaiians | 9.3 /100 | #222 | Tragic 24.1% |
| Immigrants | Middle Africa | 8.9 /100 | #223 | Tragic 24.1% |
| Immigrants | Panama | 8.6 /100 | #224 | Tragic 24.1% |
| Bermudans | 8.2 /100 | #225 | Tragic 24.2% |
| Iraqis | 8.1 /100 | #226 | Tragic 24.2% |
| Nigerians | 7.8 /100 | #227 | Tragic 24.2% |
| Whites/Caucasians | 6.6 /100 | #228 | Tragic 24.2% |
| Celtics | 6.4 /100 | #229 | Tragic 24.2% |
| Barbadians | 6.0 /100 | #230 | Tragic 24.3% |
| Immigrants | Thailand | 5.2 /100 | #231 | Tragic 24.3% |