Estonian vs Immigrants from Somalia Disability Age 65 to 74
COMPARE
Estonian
Immigrants from Somalia
Disability Age 65 to 74
Disability Age 65 to 74 Comparison
Estonians
Immigrants from Somalia
21.4%
DISABILITY AGE 65 TO 74
99.7/ 100
METRIC RATING
44th/ 347
METRIC RANK
25.2%
DISABILITY AGE 65 TO 74
0.4/ 100
METRIC RATING
256th/ 347
METRIC RANK
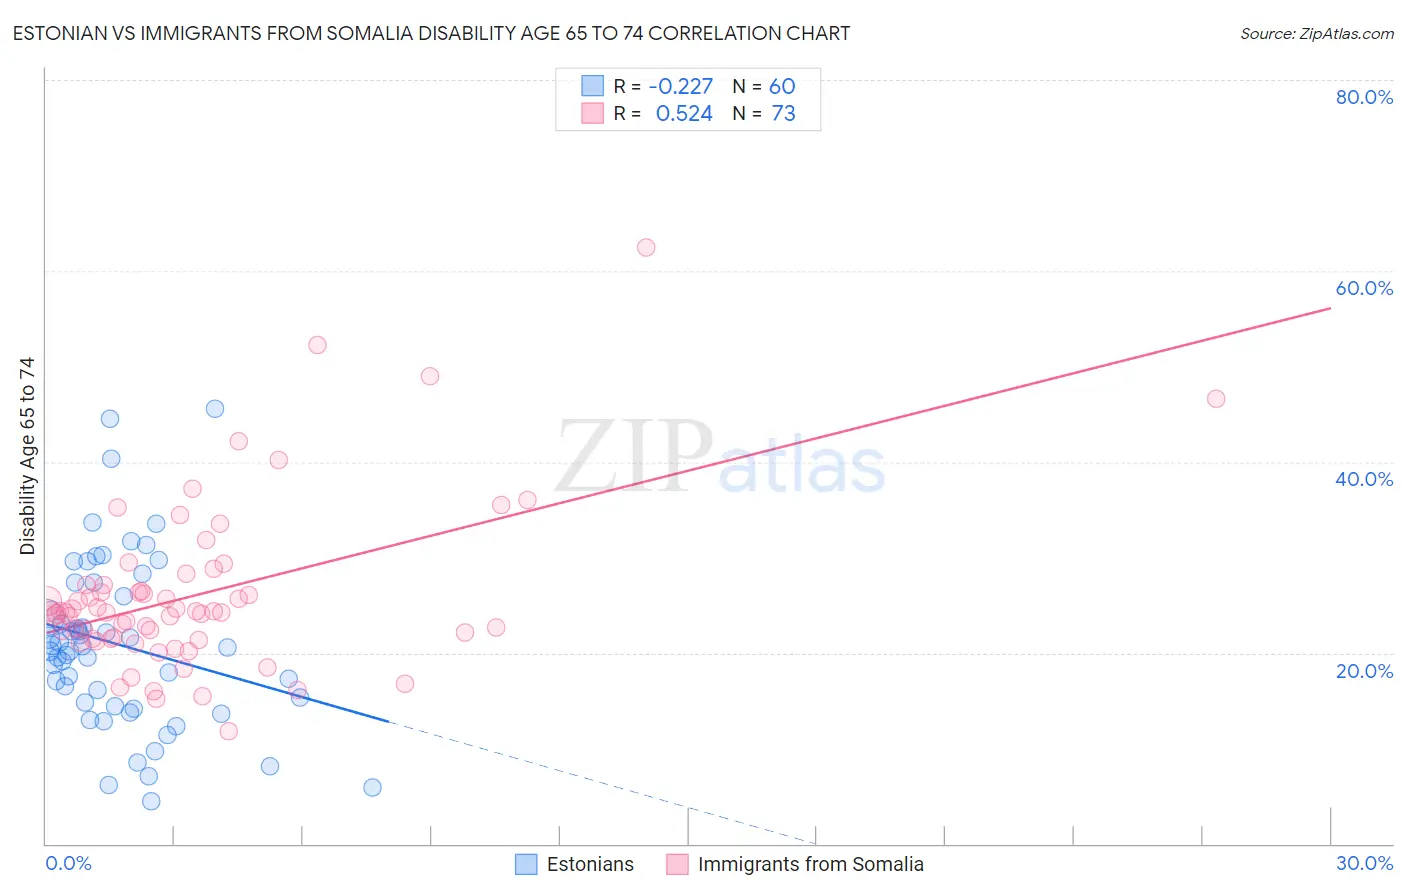
Estonian vs Immigrants from Somalia Disability Age 65 to 74 Correlation Chart
The statistical analysis conducted on geographies consisting of 123,436,234 people shows a weak negative correlation between the proportion of Estonians and percentage of population with a disability between the ages 65 and 75 in the United States with a correlation coefficient (R) of -0.227 and weighted average of 21.4%. Similarly, the statistical analysis conducted on geographies consisting of 92,082,399 people shows a substantial positive correlation between the proportion of Immigrants from Somalia and percentage of population with a disability between the ages 65 and 75 in the United States with a correlation coefficient (R) of 0.524 and weighted average of 25.2%, a difference of 18.1%.
Disability Age 65 to 74 Correlation Summary
| Measurement | Estonian | Immigrants from Somalia |
| Minimum | 4.4% | 11.8% |
| Maximum | 45.6% | 62.5% |
| Range | 41.2% | 50.7% |
| Mean | 20.8% | 26.1% |
| Median | 20.4% | 24.3% |
| Interquartile 25% (IQ1) | 14.6% | 21.5% |
| Interquartile 75% (IQ3) | 26.6% | 27.0% |
| Interquartile Range (IQR) | 12.0% | 5.6% |
| Standard Deviation (Sample) | 8.9% | 8.7% |
| Standard Deviation (Population) | 8.8% | 8.6% |
Similar Demographics by Disability Age 65 to 74
Demographics Similar to Estonians by Disability Age 65 to 74
In terms of disability age 65 to 74, the demographic groups most similar to Estonians are Asian (21.4%, a difference of 0.020%), Immigrants from Turkey (21.4%, a difference of 0.050%), Immigrants from Bulgaria (21.4%, a difference of 0.050%), Lithuanian (21.4%, a difference of 0.10%), and Luxembourger (21.4%, a difference of 0.10%).
| Demographics | Rating | Rank | Disability Age 65 to 74 |
| Israelis | 99.8 /100 | #37 | Exceptional 21.2% |
| Russians | 99.8 /100 | #38 | Exceptional 21.2% |
| Argentineans | 99.8 /100 | #39 | Exceptional 21.2% |
| Latvians | 99.8 /100 | #40 | Exceptional 21.2% |
| Immigrants | Austria | 99.8 /100 | #41 | Exceptional 21.2% |
| Macedonians | 99.7 /100 | #42 | Exceptional 21.3% |
| Immigrants | Croatia | 99.7 /100 | #43 | Exceptional 21.3% |
| Estonians | 99.7 /100 | #44 | Exceptional 21.4% |
| Asians | 99.7 /100 | #45 | Exceptional 21.4% |
| Immigrants | Turkey | 99.7 /100 | #46 | Exceptional 21.4% |
| Immigrants | Bulgaria | 99.7 /100 | #47 | Exceptional 21.4% |
| Lithuanians | 99.7 /100 | #48 | Exceptional 21.4% |
| Luxembourgers | 99.7 /100 | #49 | Exceptional 21.4% |
| Immigrants | Malaysia | 99.7 /100 | #50 | Exceptional 21.4% |
| Immigrants | Serbia | 99.6 /100 | #51 | Exceptional 21.4% |
Demographics Similar to Immigrants from Somalia by Disability Age 65 to 74
In terms of disability age 65 to 74, the demographic groups most similar to Immigrants from Somalia are Guamanian/Chamorro (25.3%, a difference of 0.17%), Marshallese (25.3%, a difference of 0.23%), Immigrants from Cambodia (25.3%, a difference of 0.32%), Central American (25.1%, a difference of 0.41%), and Somali (25.1%, a difference of 0.57%).
| Demographics | Rating | Rank | Disability Age 65 to 74 |
| Immigrants | Fiji | 0.8 /100 | #249 | Tragic 25.0% |
| Salvadorans | 0.8 /100 | #250 | Tragic 25.0% |
| Immigrants | Nonimmigrants | 0.7 /100 | #251 | Tragic 25.0% |
| Immigrants | El Salvador | 0.6 /100 | #252 | Tragic 25.1% |
| Sub-Saharan Africans | 0.6 /100 | #253 | Tragic 25.1% |
| Somalis | 0.6 /100 | #254 | Tragic 25.1% |
| Central Americans | 0.5 /100 | #255 | Tragic 25.1% |
| Immigrants | Somalia | 0.4 /100 | #256 | Tragic 25.2% |
| Guamanians/Chamorros | 0.3 /100 | #257 | Tragic 25.3% |
| Marshallese | 0.3 /100 | #258 | Tragic 25.3% |
| Immigrants | Cambodia | 0.3 /100 | #259 | Tragic 25.3% |
| Malaysians | 0.2 /100 | #260 | Tragic 25.4% |
| Cape Verdeans | 0.2 /100 | #261 | Tragic 25.4% |
| Samoans | 0.2 /100 | #262 | Tragic 25.4% |
| Iroquois | 0.2 /100 | #263 | Tragic 25.4% |