Eastern European vs South American Indian Disability Age 35 to 64
COMPARE
Eastern European
South American Indian
Disability Age 35 to 64
Disability Age 35 to 64 Comparison
Eastern Europeans
South American Indians
10.0%
DISABILITY AGE 35 TO 64
99.7/ 100
METRIC RATING
62nd/ 347
METRIC RANK
10.9%
DISABILITY AGE 35 TO 64
83.5/ 100
METRIC RATING
146th/ 347
METRIC RANK
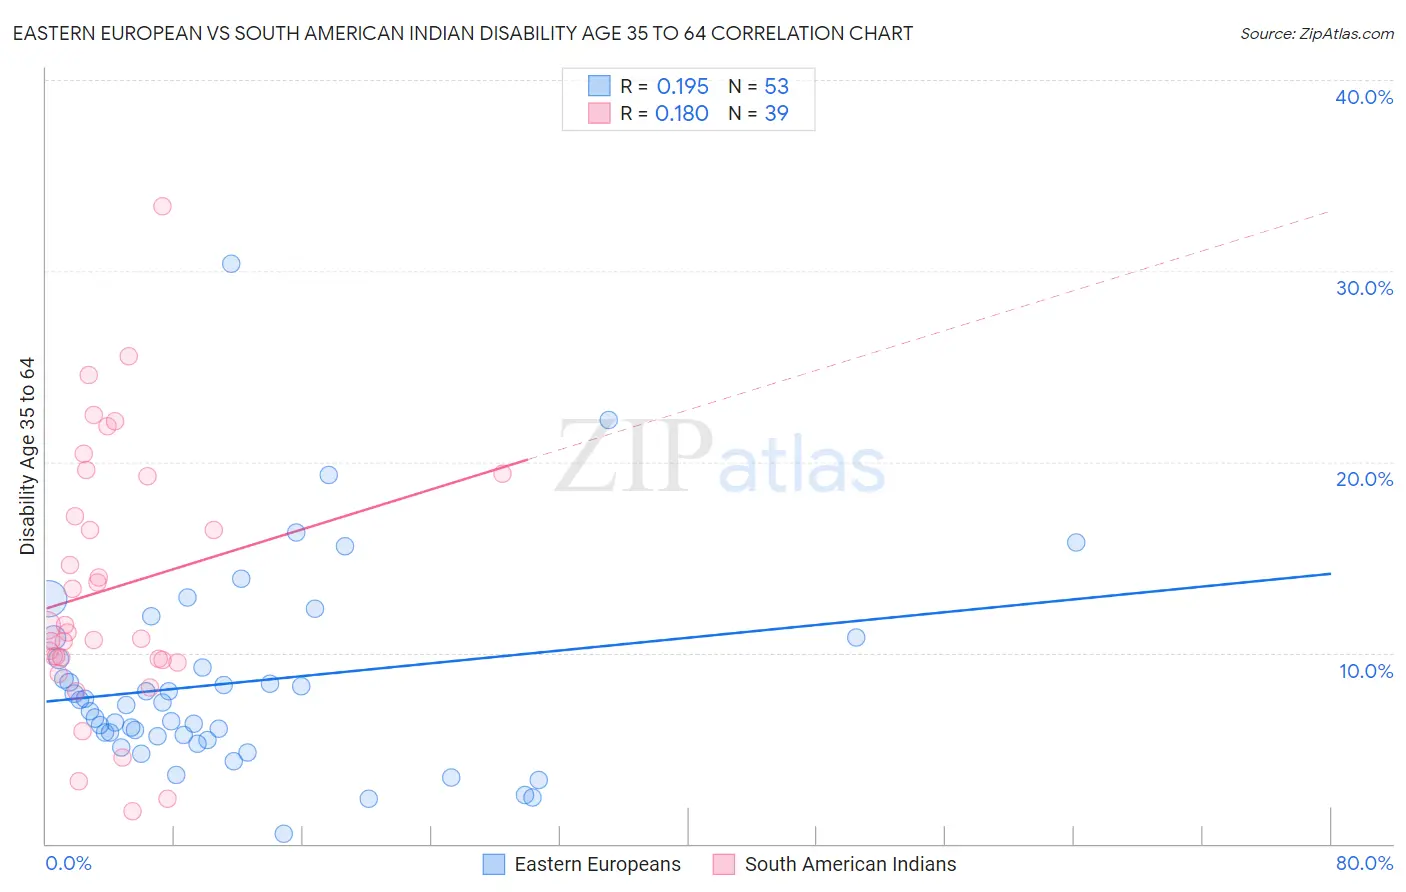
Eastern European vs South American Indian Disability Age 35 to 64 Correlation Chart
The statistical analysis conducted on geographies consisting of 460,814,379 people shows a poor positive correlation between the proportion of Eastern Europeans and percentage of population with a disability between the ages 34 and 64 in the United States with a correlation coefficient (R) of 0.195 and weighted average of 10.0%. Similarly, the statistical analysis conducted on geographies consisting of 164,539,388 people shows a poor positive correlation between the proportion of South American Indians and percentage of population with a disability between the ages 34 and 64 in the United States with a correlation coefficient (R) of 0.180 and weighted average of 10.9%, a difference of 9.5%.
Disability Age 35 to 64 Correlation Summary
| Measurement | Eastern European | South American Indian |
| Minimum | 0.52% | 1.7% |
| Maximum | 30.4% | 33.4% |
| Range | 29.8% | 31.7% |
| Mean | 8.4% | 13.4% |
| Median | 7.3% | 11.1% |
| Interquartile 25% (IQ1) | 5.5% | 9.6% |
| Interquartile 75% (IQ3) | 10.2% | 19.3% |
| Interquartile Range (IQR) | 4.7% | 9.6% |
| Standard Deviation (Sample) | 5.3% | 6.9% |
| Standard Deviation (Population) | 5.2% | 6.8% |
Similar Demographics by Disability Age 35 to 64
Demographics Similar to Eastern Europeans by Disability Age 35 to 64
In terms of disability age 35 to 64, the demographic groups most similar to Eastern Europeans are Immigrants from Spain (10.0%, a difference of 0.10%), Immigrants from Czechoslovakia (10.0%, a difference of 0.12%), Immigrants from South America (9.9%, a difference of 0.22%), Immigrants from Romania (10.0%, a difference of 0.31%), and Immigrants from Poland (10.0%, a difference of 0.39%).
| Demographics | Rating | Rank | Disability Age 35 to 64 |
| Peruvians | 99.8 /100 | #55 | Exceptional 9.9% |
| South Americans | 99.8 /100 | #56 | Exceptional 9.9% |
| Colombians | 99.8 /100 | #57 | Exceptional 9.9% |
| Armenians | 99.8 /100 | #58 | Exceptional 9.9% |
| Immigrants | Sweden | 99.7 /100 | #59 | Exceptional 9.9% |
| Immigrants | South America | 99.7 /100 | #60 | Exceptional 9.9% |
| Immigrants | Spain | 99.7 /100 | #61 | Exceptional 10.0% |
| Eastern Europeans | 99.7 /100 | #62 | Exceptional 10.0% |
| Immigrants | Czechoslovakia | 99.7 /100 | #63 | Exceptional 10.0% |
| Immigrants | Romania | 99.7 /100 | #64 | Exceptional 10.0% |
| Immigrants | Poland | 99.6 /100 | #65 | Exceptional 10.0% |
| Cubans | 99.6 /100 | #66 | Exceptional 10.0% |
| Immigrants | Uzbekistan | 99.5 /100 | #67 | Exceptional 10.1% |
| Immigrants | Switzerland | 99.5 /100 | #68 | Exceptional 10.1% |
| Immigrants | Eastern Europe | 99.5 /100 | #69 | Exceptional 10.1% |
Demographics Similar to South American Indians by Disability Age 35 to 64
In terms of disability age 35 to 64, the demographic groups most similar to South American Indians are Immigrants from Eritrea (10.9%, a difference of 0.020%), Arab (10.9%, a difference of 0.12%), Immigrants from Bangladesh (10.9%, a difference of 0.34%), Immigrants from Cameroon (10.9%, a difference of 0.34%), and Syrian (11.0%, a difference of 0.51%).
| Demographics | Rating | Rank | Disability Age 35 to 64 |
| Costa Ricans | 91.4 /100 | #139 | Exceptional 10.7% |
| Immigrants | Scotland | 91.3 /100 | #140 | Exceptional 10.7% |
| Australians | 90.7 /100 | #141 | Exceptional 10.8% |
| Immigrants | Saudi Arabia | 90.6 /100 | #142 | Exceptional 10.8% |
| Sierra Leoneans | 89.7 /100 | #143 | Excellent 10.8% |
| Lithuanians | 88.7 /100 | #144 | Excellent 10.8% |
| Immigrants | Bangladesh | 85.6 /100 | #145 | Excellent 10.9% |
| South American Indians | 83.5 /100 | #146 | Excellent 10.9% |
| Immigrants | Eritrea | 83.4 /100 | #147 | Excellent 10.9% |
| Arabs | 82.7 /100 | #148 | Excellent 10.9% |
| Immigrants | Cameroon | 81.1 /100 | #149 | Excellent 10.9% |
| Syrians | 79.8 /100 | #150 | Good 11.0% |
| New Zealanders | 79.3 /100 | #151 | Good 11.0% |
| Ukrainians | 78.0 /100 | #152 | Good 11.0% |
| Immigrants | England | 77.4 /100 | #153 | Good 11.0% |