Eastern European vs Immigrants from Middle Africa Disability Age 35 to 64
COMPARE
Eastern European
Immigrants from Middle Africa
Disability Age 35 to 64
Disability Age 35 to 64 Comparison
Eastern Europeans
Immigrants from Middle Africa
10.0%
DISABILITY AGE 35 TO 64
99.7/ 100
METRIC RATING
62nd/ 347
METRIC RANK
12.0%
DISABILITY AGE 35 TO 64
4.5/ 100
METRIC RATING
236th/ 347
METRIC RANK
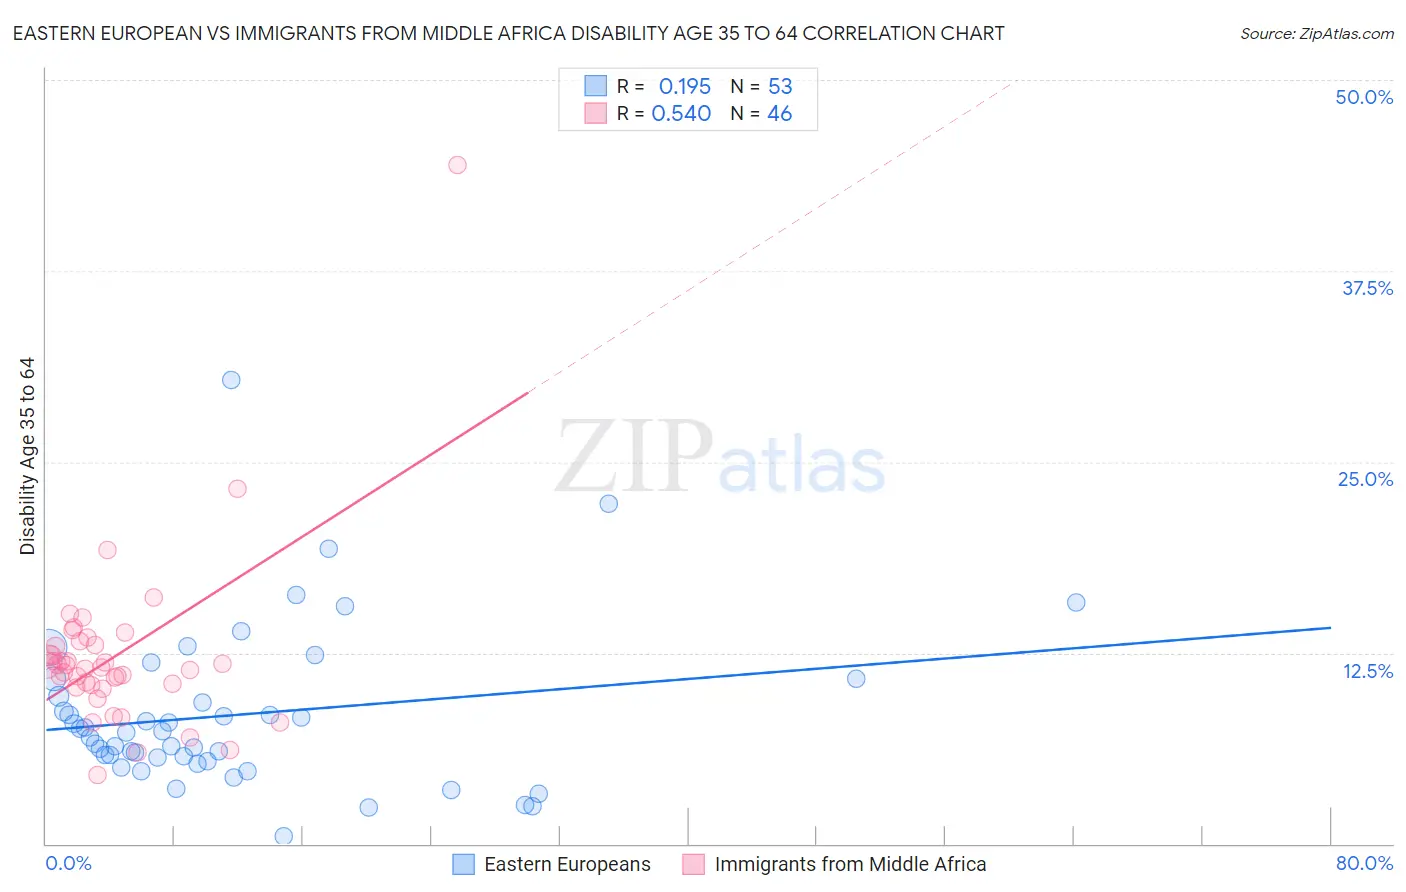
Eastern European vs Immigrants from Middle Africa Disability Age 35 to 64 Correlation Chart
The statistical analysis conducted on geographies consisting of 460,814,379 people shows a poor positive correlation between the proportion of Eastern Europeans and percentage of population with a disability between the ages 34 and 64 in the United States with a correlation coefficient (R) of 0.195 and weighted average of 10.0%. Similarly, the statistical analysis conducted on geographies consisting of 202,632,875 people shows a substantial positive correlation between the proportion of Immigrants from Middle Africa and percentage of population with a disability between the ages 34 and 64 in the United States with a correlation coefficient (R) of 0.540 and weighted average of 12.0%, a difference of 20.1%.
Disability Age 35 to 64 Correlation Summary
| Measurement | Eastern European | Immigrants from Middle Africa |
| Minimum | 0.52% | 4.5% |
| Maximum | 30.4% | 44.4% |
| Range | 29.8% | 40.0% |
| Mean | 8.4% | 12.3% |
| Median | 7.3% | 11.6% |
| Interquartile 25% (IQ1) | 5.5% | 10.4% |
| Interquartile 75% (IQ3) | 10.2% | 13.0% |
| Interquartile Range (IQR) | 4.7% | 2.6% |
| Standard Deviation (Sample) | 5.3% | 5.8% |
| Standard Deviation (Population) | 5.2% | 5.8% |
Similar Demographics by Disability Age 35 to 64
Demographics Similar to Eastern Europeans by Disability Age 35 to 64
In terms of disability age 35 to 64, the demographic groups most similar to Eastern Europeans are Immigrants from Spain (10.0%, a difference of 0.10%), Immigrants from Czechoslovakia (10.0%, a difference of 0.12%), Immigrants from South America (9.9%, a difference of 0.22%), Immigrants from Romania (10.0%, a difference of 0.31%), and Immigrants from Poland (10.0%, a difference of 0.39%).
| Demographics | Rating | Rank | Disability Age 35 to 64 |
| Peruvians | 99.8 /100 | #55 | Exceptional 9.9% |
| South Americans | 99.8 /100 | #56 | Exceptional 9.9% |
| Colombians | 99.8 /100 | #57 | Exceptional 9.9% |
| Armenians | 99.8 /100 | #58 | Exceptional 9.9% |
| Immigrants | Sweden | 99.7 /100 | #59 | Exceptional 9.9% |
| Immigrants | South America | 99.7 /100 | #60 | Exceptional 9.9% |
| Immigrants | Spain | 99.7 /100 | #61 | Exceptional 10.0% |
| Eastern Europeans | 99.7 /100 | #62 | Exceptional 10.0% |
| Immigrants | Czechoslovakia | 99.7 /100 | #63 | Exceptional 10.0% |
| Immigrants | Romania | 99.7 /100 | #64 | Exceptional 10.0% |
| Immigrants | Poland | 99.6 /100 | #65 | Exceptional 10.0% |
| Cubans | 99.6 /100 | #66 | Exceptional 10.0% |
| Immigrants | Uzbekistan | 99.5 /100 | #67 | Exceptional 10.1% |
| Immigrants | Switzerland | 99.5 /100 | #68 | Exceptional 10.1% |
| Immigrants | Eastern Europe | 99.5 /100 | #69 | Exceptional 10.1% |
Demographics Similar to Immigrants from Middle Africa by Disability Age 35 to 64
In terms of disability age 35 to 64, the demographic groups most similar to Immigrants from Middle Africa are Belizean (12.0%, a difference of 0.020%), Portuguese (11.9%, a difference of 0.15%), Bermudan (11.9%, a difference of 0.23%), Immigrants from Cambodia (12.0%, a difference of 0.26%), and Sudanese (11.9%, a difference of 0.33%).
| Demographics | Rating | Rank | Disability Age 35 to 64 |
| British West Indians | 6.1 /100 | #229 | Tragic 11.9% |
| Panamanians | 5.8 /100 | #230 | Tragic 11.9% |
| Jamaicans | 5.7 /100 | #231 | Tragic 11.9% |
| Sudanese | 5.3 /100 | #232 | Tragic 11.9% |
| Bermudans | 5.0 /100 | #233 | Tragic 11.9% |
| Portuguese | 4.9 /100 | #234 | Tragic 11.9% |
| Belizeans | 4.5 /100 | #235 | Tragic 12.0% |
| Immigrants | Middle Africa | 4.5 /100 | #236 | Tragic 12.0% |
| Immigrants | Cambodia | 3.9 /100 | #237 | Tragic 12.0% |
| West Indians | 3.7 /100 | #238 | Tragic 12.0% |
| Immigrants | Western Africa | 3.3 /100 | #239 | Tragic 12.0% |
| Immigrants | Thailand | 3.3 /100 | #240 | Tragic 12.0% |
| Mexican American Indians | 3.2 /100 | #241 | Tragic 12.0% |
| Samoans | 2.8 /100 | #242 | Tragic 12.1% |
| Slovaks | 2.7 /100 | #243 | Tragic 12.1% |