Cree vs Delaware Disability Age 35 to 64
COMPARE
Cree
Delaware
Disability Age 35 to 64
Disability Age 35 to 64 Comparison
Cree
Delaware
14.1%
DISABILITY AGE 35 TO 64
0.0/ 100
METRIC RATING
309th/ 347
METRIC RANK
13.7%
DISABILITY AGE 35 TO 64
0.0/ 100
METRIC RATING
300th/ 347
METRIC RANK
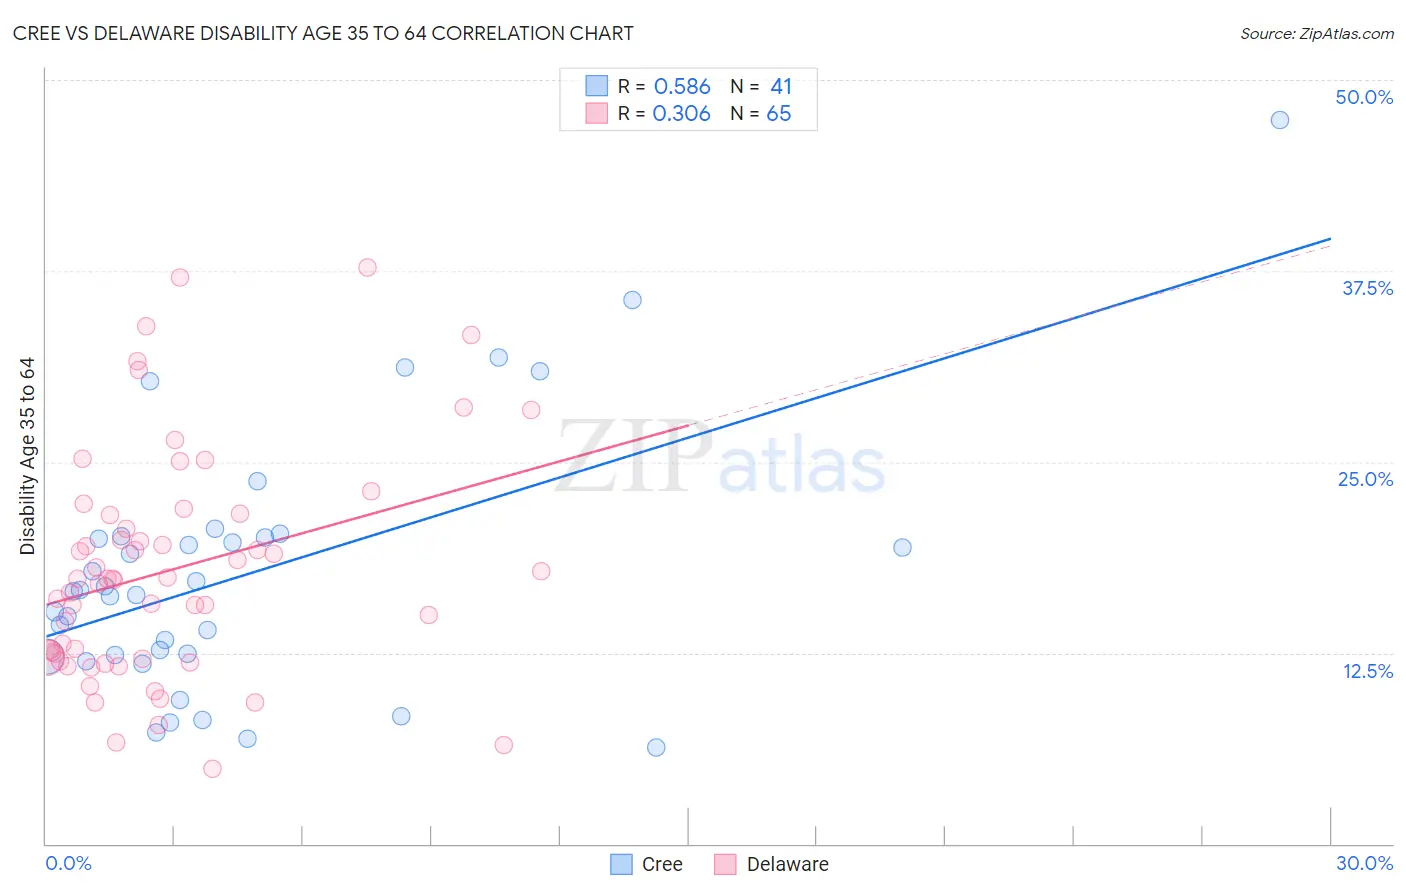
Cree vs Delaware Disability Age 35 to 64 Correlation Chart
The statistical analysis conducted on geographies consisting of 76,205,381 people shows a substantial positive correlation between the proportion of Cree and percentage of population with a disability between the ages 34 and 64 in the United States with a correlation coefficient (R) of 0.586 and weighted average of 14.1%. Similarly, the statistical analysis conducted on geographies consisting of 96,224,166 people shows a mild positive correlation between the proportion of Delaware and percentage of population with a disability between the ages 34 and 64 in the United States with a correlation coefficient (R) of 0.306 and weighted average of 13.7%, a difference of 2.9%.
Disability Age 35 to 64 Correlation Summary
| Measurement | Cree | Delaware |
| Minimum | 6.3% | 4.9% |
| Maximum | 47.4% | 37.7% |
| Range | 41.1% | 32.8% |
| Mean | 17.7% | 17.9% |
| Median | 16.5% | 17.3% |
| Interquartile 25% (IQ1) | 12.3% | 12.2% |
| Interquartile 75% (IQ3) | 20.1% | 21.6% |
| Interquartile Range (IQR) | 7.8% | 9.4% |
| Standard Deviation (Sample) | 8.6% | 7.4% |
| Standard Deviation (Population) | 8.5% | 7.4% |
Demographics Similar to Cree and Delaware by Disability Age 35 to 64
In terms of disability age 35 to 64, the demographic groups most similar to Cree are Inupiat (14.1%, a difference of 0.070%), Blackfeet (14.1%, a difference of 0.10%), Immigrants from Yemen (14.0%, a difference of 0.26%), Cape Verdean (14.1%, a difference of 0.47%), and American (13.9%, a difference of 1.1%). Similarly, the demographic groups most similar to Delaware are Spanish American (13.7%, a difference of 0.080%), Cheyenne (13.6%, a difference of 0.28%), French American Indian (13.7%, a difference of 0.30%), Bangladeshi (13.6%, a difference of 0.31%), and African (13.6%, a difference of 0.66%).
| Demographics | Rating | Rank | Disability Age 35 to 64 |
| Yaqui | 0.0 /100 | #294 | Tragic 13.5% |
| Yakama | 0.0 /100 | #295 | Tragic 13.6% |
| Africans | 0.0 /100 | #296 | Tragic 13.6% |
| Bangladeshis | 0.0 /100 | #297 | Tragic 13.6% |
| Cheyenne | 0.0 /100 | #298 | Tragic 13.6% |
| Spanish Americans | 0.0 /100 | #299 | Tragic 13.7% |
| Delaware | 0.0 /100 | #300 | Tragic 13.7% |
| French American Indians | 0.0 /100 | #301 | Tragic 13.7% |
| Aleuts | 0.0 /100 | #302 | Tragic 13.8% |
| Sioux | 0.0 /100 | #303 | Tragic 13.9% |
| Hopi | 0.0 /100 | #304 | Tragic 13.9% |
| Americans | 0.0 /100 | #305 | Tragic 13.9% |
| Immigrants | Yemen | 0.0 /100 | #306 | Tragic 14.0% |
| Blackfeet | 0.0 /100 | #307 | Tragic 14.1% |
| Inupiat | 0.0 /100 | #308 | Tragic 14.1% |
| Cree | 0.0 /100 | #309 | Tragic 14.1% |
| Cape Verdeans | 0.0 /100 | #310 | Tragic 14.1% |
| Immigrants | Azores | 0.0 /100 | #311 | Tragic 14.3% |
| Paiute | 0.0 /100 | #312 | Tragic 14.3% |
| Iroquois | 0.0 /100 | #313 | Tragic 14.4% |
| Shoshone | 0.0 /100 | #314 | Tragic 14.5% |