Immigrants from North America vs Immigrants from Eritrea Disability Age 18 to 34
COMPARE
Immigrants from North America
Immigrants from Eritrea
Disability Age 18 to 34
Disability Age 18 to 34 Comparison
Immigrants from North America
Immigrants from Eritrea
7.0%
DISABILITY AGE 18 TO 34
3.9/ 100
METRIC RATING
230th/ 347
METRIC RANK
6.5%
DISABILITY AGE 18 TO 34
77.4/ 100
METRIC RATING
153rd/ 347
METRIC RANK
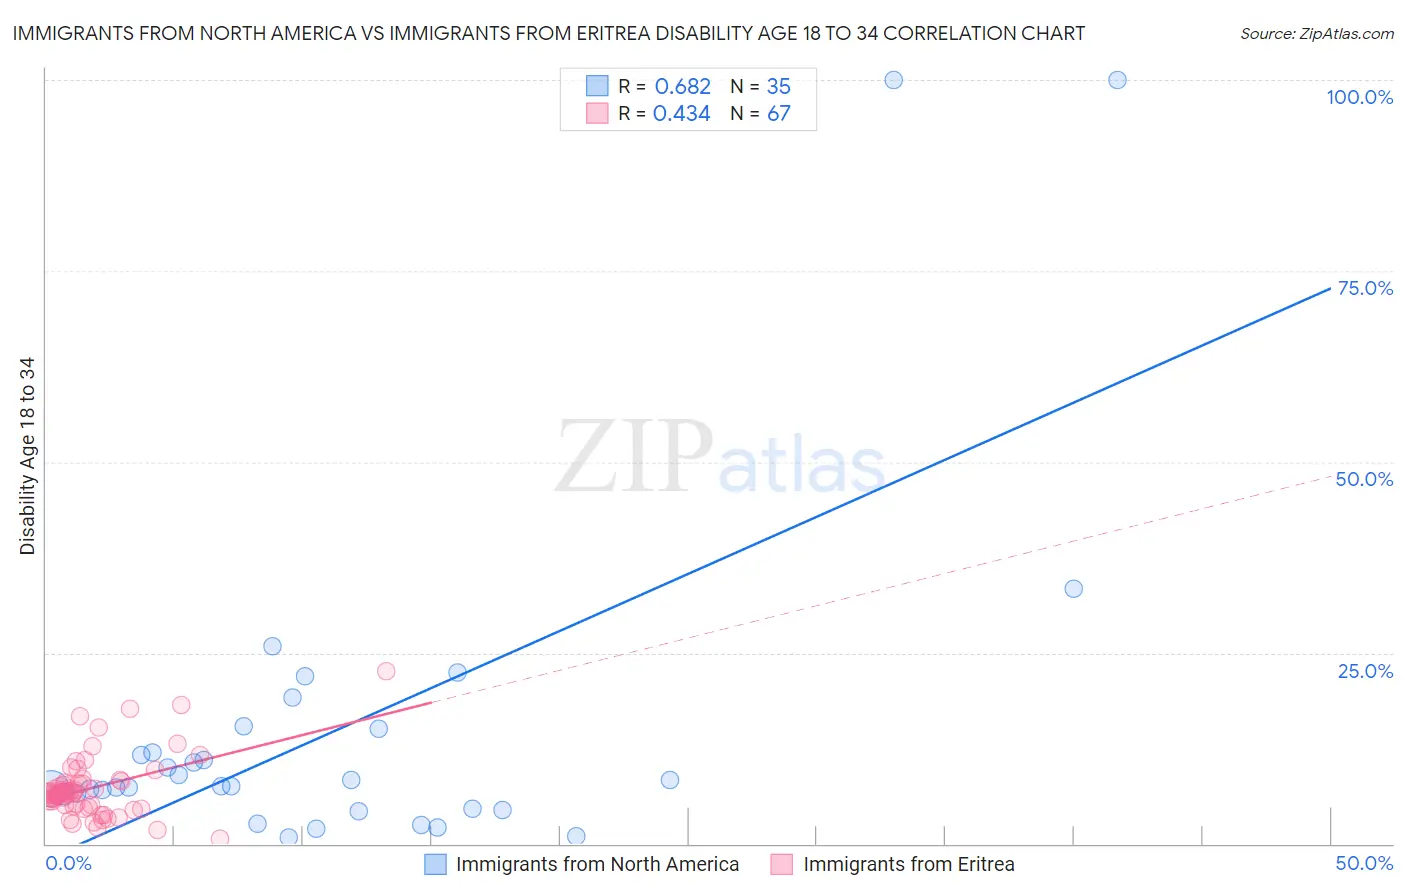
Immigrants from North America vs Immigrants from Eritrea Disability Age 18 to 34 Correlation Chart
The statistical analysis conducted on geographies consisting of 460,575,007 people shows a significant positive correlation between the proportion of Immigrants from North America and percentage of population with a disability between the ages 18 and 35 in the United States with a correlation coefficient (R) of 0.682 and weighted average of 7.0%. Similarly, the statistical analysis conducted on geographies consisting of 104,844,582 people shows a moderate positive correlation between the proportion of Immigrants from Eritrea and percentage of population with a disability between the ages 18 and 35 in the United States with a correlation coefficient (R) of 0.434 and weighted average of 6.5%, a difference of 7.9%.
Disability Age 18 to 34 Correlation Summary
| Measurement | Immigrants from North America | Immigrants from Eritrea |
| Minimum | 0.83% | 0.58% |
| Maximum | 100.0% | 22.6% |
| Range | 99.2% | 22.0% |
| Mean | 14.9% | 7.3% |
| Median | 7.6% | 6.6% |
| Interquartile 25% (IQ1) | 4.5% | 5.0% |
| Interquartile 75% (IQ3) | 15.0% | 8.1% |
| Interquartile Range (IQR) | 10.5% | 3.1% |
| Standard Deviation (Sample) | 22.5% | 4.0% |
| Standard Deviation (Population) | 22.1% | 4.0% |
Similar Demographics by Disability Age 18 to 34
Demographics Similar to Immigrants from North America by Disability Age 18 to 34
In terms of disability age 18 to 34, the demographic groups most similar to Immigrants from North America are Ute (7.0%, a difference of 0.020%), Lithuanian (7.0%, a difference of 0.090%), Immigrants from Yemen (7.0%, a difference of 0.12%), Immigrants from Canada (7.0%, a difference of 0.18%), and Ugandan (6.9%, a difference of 0.22%).
| Demographics | Rating | Rank | Disability Age 18 to 34 |
| Carpatho Rusyns | 5.2 /100 | #223 | Tragic 6.9% |
| Senegalese | 4.9 /100 | #224 | Tragic 6.9% |
| Central American Indians | 4.7 /100 | #225 | Tragic 6.9% |
| Ugandans | 4.4 /100 | #226 | Tragic 6.9% |
| Immigrants | Canada | 4.3 /100 | #227 | Tragic 7.0% |
| Immigrants | Yemen | 4.2 /100 | #228 | Tragic 7.0% |
| Lithuanians | 4.1 /100 | #229 | Tragic 7.0% |
| Immigrants | North America | 3.9 /100 | #230 | Tragic 7.0% |
| Ute | 3.8 /100 | #231 | Tragic 7.0% |
| Samoans | 3.2 /100 | #232 | Tragic 7.0% |
| New Zealanders | 2.7 /100 | #233 | Tragic 7.0% |
| Alsatians | 2.1 /100 | #234 | Tragic 7.0% |
| Sub-Saharan Africans | 1.7 /100 | #235 | Tragic 7.1% |
| Liberians | 1.5 /100 | #236 | Tragic 7.1% |
| Austrians | 1.3 /100 | #237 | Tragic 7.1% |
Demographics Similar to Immigrants from Eritrea by Disability Age 18 to 34
In terms of disability age 18 to 34, the demographic groups most similar to Immigrants from Eritrea are Immigrants from Central America (6.5%, a difference of 0.060%), Inupiat (6.5%, a difference of 0.070%), Bulgarian (6.5%, a difference of 0.090%), Immigrants from Panama (6.5%, a difference of 0.20%), and Immigrants from Sierra Leone (6.5%, a difference of 0.23%).
| Demographics | Rating | Rank | Disability Age 18 to 34 |
| Belizeans | 84.9 /100 | #146 | Excellent 6.4% |
| Immigrants | South Africa | 83.7 /100 | #147 | Excellent 6.4% |
| Immigrants | Belgium | 83.5 /100 | #148 | Excellent 6.4% |
| Hondurans | 83.1 /100 | #149 | Excellent 6.4% |
| Immigrants | Dominican Republic | 82.7 /100 | #150 | Excellent 6.4% |
| Tongans | 81.9 /100 | #151 | Excellent 6.4% |
| Bulgarians | 78.3 /100 | #152 | Good 6.5% |
| Immigrants | Eritrea | 77.4 /100 | #153 | Good 6.5% |
| Immigrants | Central America | 76.8 /100 | #154 | Good 6.5% |
| Inupiat | 76.7 /100 | #155 | Good 6.5% |
| Immigrants | Panama | 75.3 /100 | #156 | Good 6.5% |
| Immigrants | Sierra Leone | 75.0 /100 | #157 | Good 6.5% |
| Zimbabweans | 74.7 /100 | #158 | Good 6.5% |
| Dominicans | 73.6 /100 | #159 | Good 6.5% |
| Immigrants | Southern Europe | 72.5 /100 | #160 | Good 6.5% |