Immigrants from Western Europe vs Immigrants from China Disability Age Over 75
COMPARE
Immigrants from Western Europe
Immigrants from China
Disability Age Over 75
Disability Age Over 75 Comparison
Immigrants from Western Europe
Immigrants from China
46.2%
DISABILITY AGE OVER 75
98.8/ 100
METRIC RATING
78th/ 347
METRIC RANK
46.3%
DISABILITY AGE OVER 75
98.0/ 100
METRIC RATING
96th/ 347
METRIC RANK
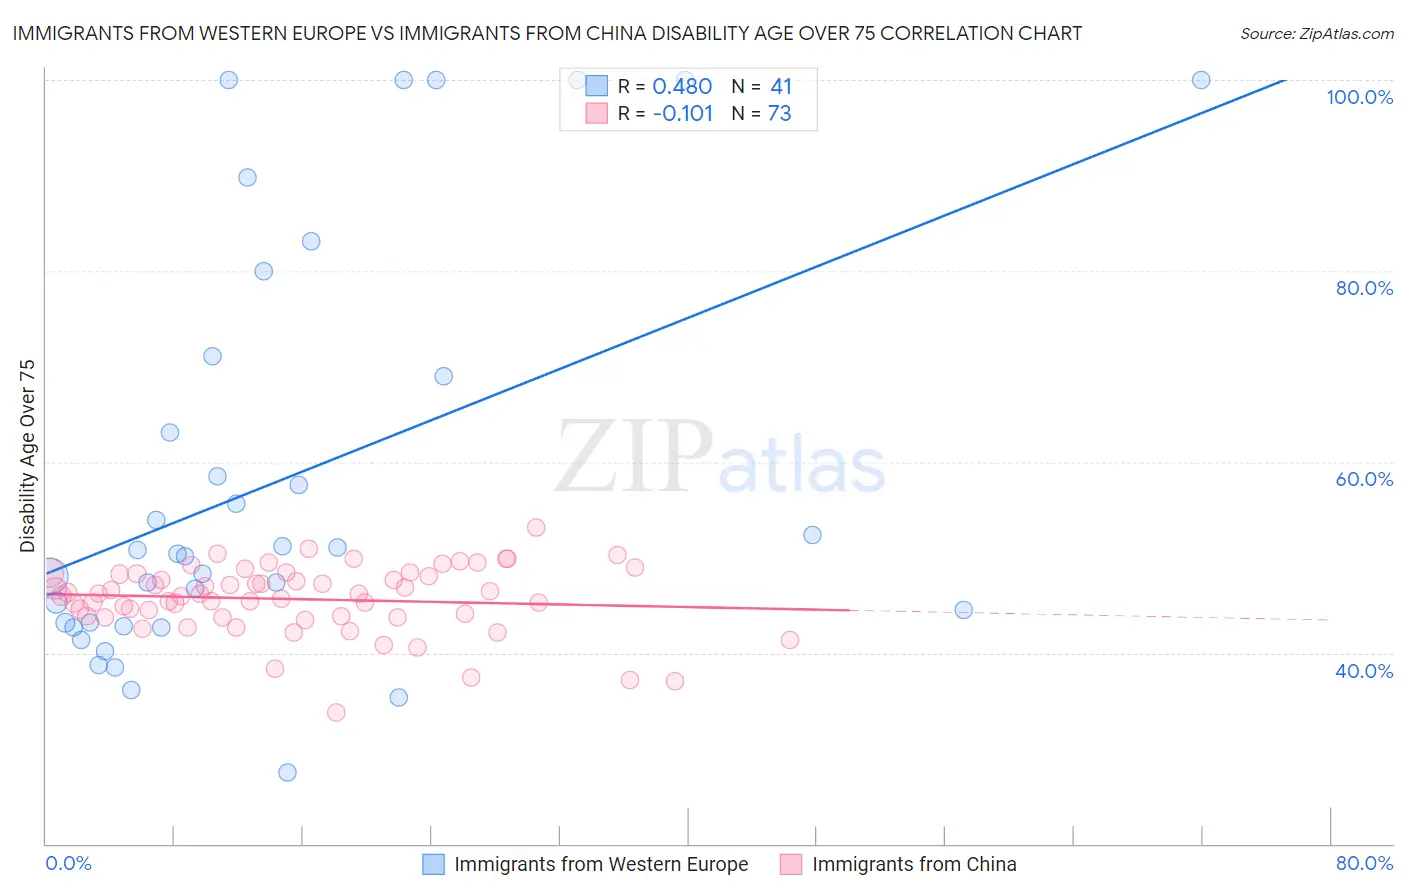
Immigrants from Western Europe vs Immigrants from China Disability Age Over 75 Correlation Chart
The statistical analysis conducted on geographies consisting of 493,053,123 people shows a moderate positive correlation between the proportion of Immigrants from Western Europe and percentage of population with a disability over the age of 75 in the United States with a correlation coefficient (R) of 0.480 and weighted average of 46.2%. Similarly, the statistical analysis conducted on geographies consisting of 455,855,137 people shows a poor negative correlation between the proportion of Immigrants from China and percentage of population with a disability over the age of 75 in the United States with a correlation coefficient (R) of -0.101 and weighted average of 46.3%, a difference of 0.33%.
Disability Age Over 75 Correlation Summary
| Measurement | Immigrants from Western Europe | Immigrants from China |
| Minimum | 27.5% | 33.8% |
| Maximum | 100.0% | 53.1% |
| Range | 72.5% | 19.3% |
| Mean | 58.2% | 45.6% |
| Median | 50.4% | 46.2% |
| Interquartile 25% (IQ1) | 42.9% | 43.8% |
| Interquartile 75% (IQ3) | 70.0% | 48.3% |
| Interquartile Range (IQR) | 27.1% | 4.5% |
| Standard Deviation (Sample) | 21.6% | 3.6% |
| Standard Deviation (Population) | 21.3% | 3.5% |
Demographics Similar to Immigrants from Western Europe and Immigrants from China by Disability Age Over 75
In terms of disability age over 75, the demographic groups most similar to Immigrants from Western Europe are Immigrants from Eastern Asia (46.2%, a difference of 0.010%), Swiss (46.2%, a difference of 0.040%), Soviet Union (46.2%, a difference of 0.040%), New Zealander (46.2%, a difference of 0.050%), and Immigrants from Latvia (46.2%, a difference of 0.060%). Similarly, the demographic groups most similar to Immigrants from China are Immigrants from Brazil (46.3%, a difference of 0.010%), Finnish (46.3%, a difference of 0.020%), Albanian (46.3%, a difference of 0.030%), Ugandan (46.3%, a difference of 0.060%), and German (46.3%, a difference of 0.070%).
| Demographics | Rating | Rank | Disability Age Over 75 |
| Immigrants | Eastern Asia | 98.9 /100 | #77 | Exceptional 46.2% |
| Immigrants | Western Europe | 98.8 /100 | #78 | Exceptional 46.2% |
| Swiss | 98.8 /100 | #79 | Exceptional 46.2% |
| Soviet Union | 98.8 /100 | #80 | Exceptional 46.2% |
| New Zealanders | 98.8 /100 | #81 | Exceptional 46.2% |
| Immigrants | Latvia | 98.7 /100 | #82 | Exceptional 46.2% |
| Argentineans | 98.7 /100 | #83 | Exceptional 46.2% |
| Immigrants | Jordan | 98.7 /100 | #84 | Exceptional 46.2% |
| Immigrants | Southern Europe | 98.6 /100 | #85 | Exceptional 46.2% |
| Romanians | 98.6 /100 | #86 | Exceptional 46.2% |
| Danes | 98.6 /100 | #87 | Exceptional 46.2% |
| Uruguayans | 98.4 /100 | #88 | Exceptional 46.2% |
| Immigrants | Saudi Arabia | 98.4 /100 | #89 | Exceptional 46.3% |
| Northern Europeans | 98.3 /100 | #90 | Exceptional 46.3% |
| Immigrants | Egypt | 98.3 /100 | #91 | Exceptional 46.3% |
| Germans | 98.2 /100 | #92 | Exceptional 46.3% |
| Ugandans | 98.2 /100 | #93 | Exceptional 46.3% |
| Albanians | 98.1 /100 | #94 | Exceptional 46.3% |
| Immigrants | Brazil | 98.0 /100 | #95 | Exceptional 46.3% |
| Immigrants | China | 98.0 /100 | #96 | Exceptional 46.3% |
| Finns | 97.9 /100 | #97 | Exceptional 46.3% |