Basque vs Japanese Disability Age 35 to 64
COMPARE
Basque
Japanese
Disability Age 35 to 64
Disability Age 35 to 64 Comparison
Basques
Japanese
11.6%
DISABILITY AGE 35 TO 64
19.5/ 100
METRIC RATING
199th/ 347
METRIC RANK
12.3%
DISABILITY AGE 35 TO 64
0.8/ 100
METRIC RATING
255th/ 347
METRIC RANK
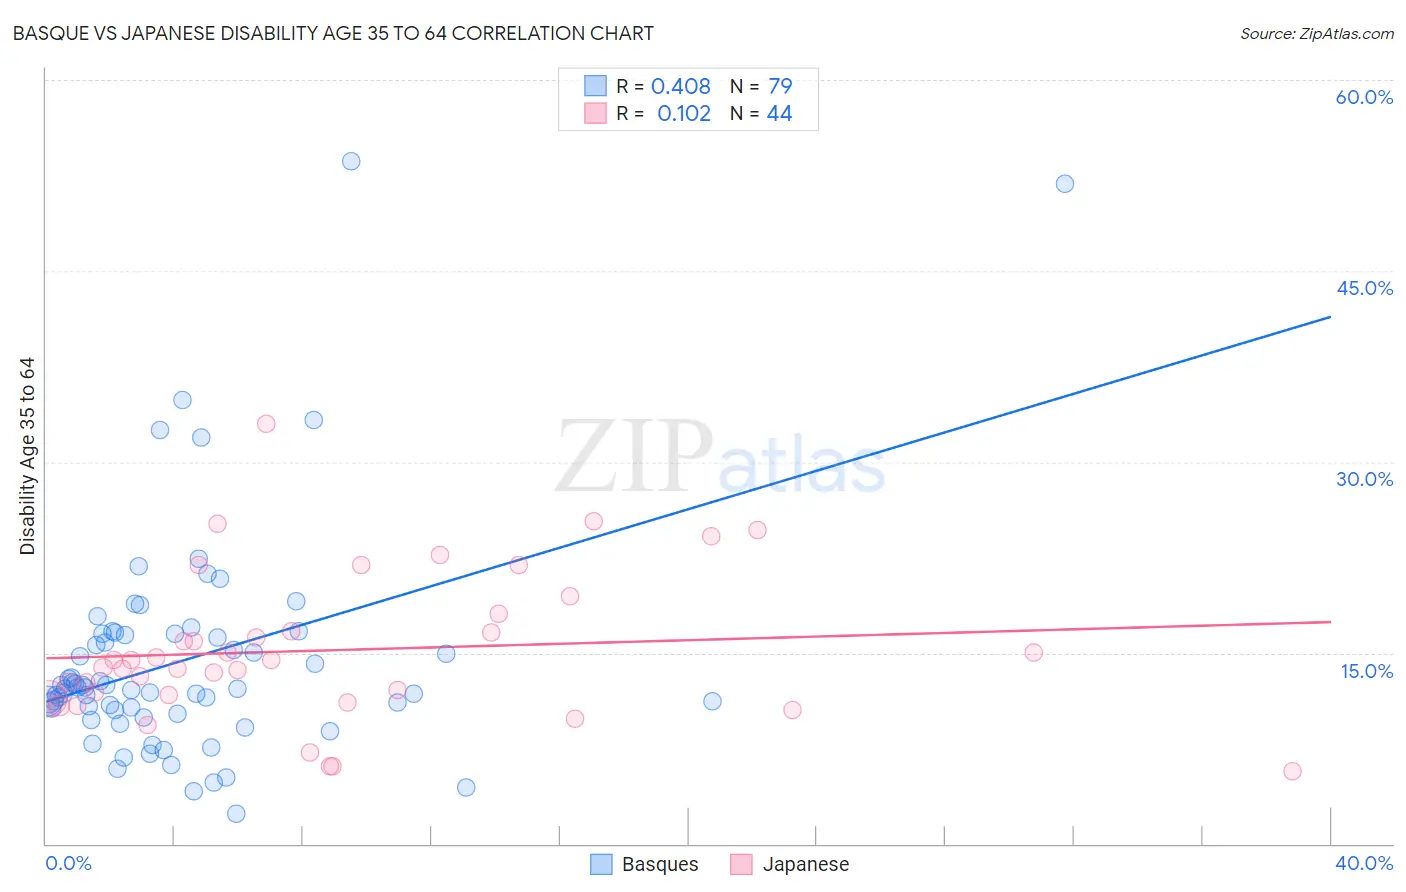
Basque vs Japanese Disability Age 35 to 64 Correlation Chart
The statistical analysis conducted on geographies consisting of 165,739,455 people shows a moderate positive correlation between the proportion of Basques and percentage of population with a disability between the ages 34 and 64 in the United States with a correlation coefficient (R) of 0.408 and weighted average of 11.6%. Similarly, the statistical analysis conducted on geographies consisting of 249,049,051 people shows a poor positive correlation between the proportion of Japanese and percentage of population with a disability between the ages 34 and 64 in the United States with a correlation coefficient (R) of 0.102 and weighted average of 12.3%, a difference of 6.5%.
Disability Age 35 to 64 Correlation Summary
| Measurement | Basque | Japanese |
| Minimum | 2.4% | 5.7% |
| Maximum | 53.6% | 33.0% |
| Range | 51.2% | 27.4% |
| Mean | 14.4% | 15.2% |
| Median | 12.2% | 14.1% |
| Interquartile 25% (IQ1) | 10.5% | 11.5% |
| Interquartile 75% (IQ3) | 16.5% | 17.4% |
| Interquartile Range (IQR) | 5.9% | 5.9% |
| Standard Deviation (Sample) | 8.8% | 5.8% |
| Standard Deviation (Population) | 8.7% | 5.7% |
Similar Demographics by Disability Age 35 to 64
Demographics Similar to Basques by Disability Age 35 to 64
In terms of disability age 35 to 64, the demographic groups most similar to Basques are Swiss (11.6%, a difference of 0.10%), Immigrants from Panama (11.6%, a difference of 0.11%), Immigrants from Iraq (11.6%, a difference of 0.19%), Immigrants from Kenya (11.6%, a difference of 0.23%), and Immigrants from Guatemala (11.6%, a difference of 0.25%).
| Demographics | Rating | Rank | Disability Age 35 to 64 |
| Norwegians | 29.7 /100 | #192 | Fair 11.5% |
| Immigrants | Africa | 29.0 /100 | #193 | Fair 11.5% |
| Immigrants | Latin America | 27.5 /100 | #194 | Fair 11.5% |
| Carpatho Rusyns | 25.3 /100 | #195 | Fair 11.5% |
| Iraqis | 24.2 /100 | #196 | Fair 11.5% |
| Immigrants | Iraq | 21.0 /100 | #197 | Fair 11.6% |
| Immigrants | Panama | 20.4 /100 | #198 | Fair 11.6% |
| Basques | 19.5 /100 | #199 | Poor 11.6% |
| Swiss | 18.7 /100 | #200 | Poor 11.6% |
| Immigrants | Kenya | 17.7 /100 | #201 | Poor 11.6% |
| Immigrants | Guatemala | 17.5 /100 | #202 | Poor 11.6% |
| British | 17.0 /100 | #203 | Poor 11.6% |
| Nigerians | 16.3 /100 | #204 | Poor 11.6% |
| Slavs | 15.5 /100 | #205 | Poor 11.7% |
| Native Hawaiians | 14.8 /100 | #206 | Poor 11.7% |
Demographics Similar to Japanese by Disability Age 35 to 64
In terms of disability age 35 to 64, the demographic groups most similar to Japanese are Hawaiian (12.3%, a difference of 0.13%), Scottish (12.4%, a difference of 0.17%), Dutch (12.3%, a difference of 0.25%), Irish (12.3%, a difference of 0.28%), and Mexican (12.4%, a difference of 0.42%).
| Demographics | Rating | Rank | Disability Age 35 to 64 |
| Spaniards | 1.3 /100 | #248 | Tragic 12.3% |
| Hispanics or Latinos | 1.3 /100 | #249 | Tragic 12.3% |
| Immigrants | Burma/Myanmar | 1.2 /100 | #250 | Tragic 12.3% |
| Germans | 1.1 /100 | #251 | Tragic 12.3% |
| Irish | 1.0 /100 | #252 | Tragic 12.3% |
| Dutch | 1.0 /100 | #253 | Tragic 12.3% |
| Hawaiians | 0.9 /100 | #254 | Tragic 12.3% |
| Japanese | 0.8 /100 | #255 | Tragic 12.3% |
| Scottish | 0.8 /100 | #256 | Tragic 12.4% |
| Mexicans | 0.7 /100 | #257 | Tragic 12.4% |
| Welsh | 0.6 /100 | #258 | Tragic 12.4% |
| English | 0.6 /100 | #259 | Tragic 12.4% |
| German Russians | 0.5 /100 | #260 | Tragic 12.5% |
| Malaysians | 0.5 /100 | #261 | Tragic 12.5% |
| Senegalese | 0.5 /100 | #262 | Tragic 12.5% |