Aleut vs Immigrants from Iraq Disability Age 18 to 34
COMPARE
Aleut
Immigrants from Iraq
Disability Age 18 to 34
Disability Age 18 to 34 Comparison
Aleuts
Immigrants from Iraq
8.1%
DISABILITY AGE 18 TO 34
0.0/ 100
METRIC RATING
319th/ 347
METRIC RANK
6.7%
DISABILITY AGE 18 TO 34
37.4/ 100
METRIC RATING
183rd/ 347
METRIC RANK
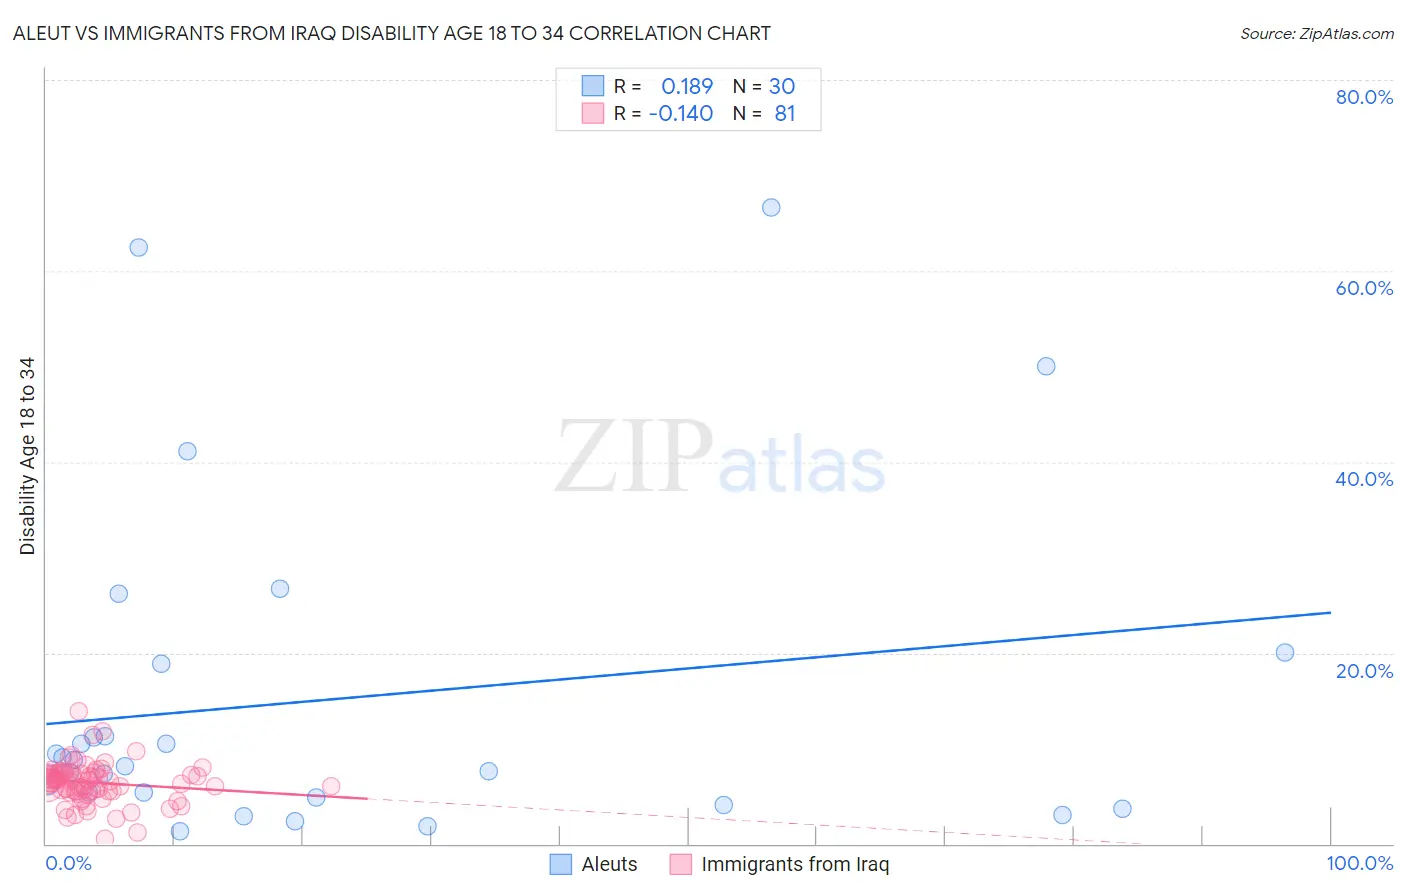
Aleut vs Immigrants from Iraq Disability Age 18 to 34 Correlation Chart
The statistical analysis conducted on geographies consisting of 61,734,200 people shows a poor positive correlation between the proportion of Aleuts and percentage of population with a disability between the ages 18 and 35 in the United States with a correlation coefficient (R) of 0.189 and weighted average of 8.1%. Similarly, the statistical analysis conducted on geographies consisting of 194,718,945 people shows a poor negative correlation between the proportion of Immigrants from Iraq and percentage of population with a disability between the ages 18 and 35 in the United States with a correlation coefficient (R) of -0.140 and weighted average of 6.7%, a difference of 21.5%.
Disability Age 18 to 34 Correlation Summary
| Measurement | Aleut | Immigrants from Iraq |
| Minimum | 1.4% | 0.58% |
| Maximum | 66.7% | 13.9% |
| Range | 65.3% | 13.3% |
| Mean | 15.2% | 6.4% |
| Median | 8.5% | 6.6% |
| Interquartile 25% (IQ1) | 4.9% | 5.5% |
| Interquartile 75% (IQ3) | 18.9% | 7.4% |
| Interquartile Range (IQR) | 14.1% | 1.8% |
| Standard Deviation (Sample) | 17.6% | 2.1% |
| Standard Deviation (Population) | 17.3% | 2.1% |
Similar Demographics by Disability Age 18 to 34
Demographics Similar to Aleuts by Disability Age 18 to 34
In terms of disability age 18 to 34, the demographic groups most similar to Aleuts are French Canadian (8.1%, a difference of 0.040%), Navajo (8.1%, a difference of 0.050%), Blackfeet (8.1%, a difference of 0.41%), Cree (8.1%, a difference of 0.46%), and Hmong (8.1%, a difference of 0.47%).
| Demographics | Rating | Rank | Disability Age 18 to 34 |
| Spanish Americans | 0.0 /100 | #312 | Tragic 7.9% |
| Iroquois | 0.0 /100 | #313 | Tragic 7.9% |
| Colville | 0.0 /100 | #314 | Tragic 7.9% |
| Americans | 0.0 /100 | #315 | Tragic 8.0% |
| Puerto Ricans | 0.0 /100 | #316 | Tragic 8.0% |
| Hmong | 0.0 /100 | #317 | Tragic 8.1% |
| French Canadians | 0.0 /100 | #318 | Tragic 8.1% |
| Aleuts | 0.0 /100 | #319 | Tragic 8.1% |
| Navajo | 0.0 /100 | #320 | Tragic 8.1% |
| Blackfeet | 0.0 /100 | #321 | Tragic 8.1% |
| Cree | 0.0 /100 | #322 | Tragic 8.1% |
| French American Indians | 0.0 /100 | #323 | Tragic 8.2% |
| Cajuns | 0.0 /100 | #324 | Tragic 8.2% |
| Natives/Alaskans | 0.0 /100 | #325 | Tragic 8.2% |
| Potawatomi | 0.0 /100 | #326 | Tragic 8.2% |
Demographics Similar to Immigrants from Iraq by Disability Age 18 to 34
In terms of disability age 18 to 34, the demographic groups most similar to Immigrants from Iraq are Iraqi (6.7%, a difference of 0.0%), U.S. Virgin Islander (6.7%, a difference of 0.090%), Romanian (6.6%, a difference of 0.15%), Immigrants from Oceania (6.7%, a difference of 0.15%), and Immigrants from Austria (6.6%, a difference of 0.16%).
| Demographics | Rating | Rank | Disability Age 18 to 34 |
| Immigrants | Africa | 45.9 /100 | #176 | Average 6.6% |
| Syrians | 44.3 /100 | #177 | Average 6.6% |
| Nigerians | 43.7 /100 | #178 | Average 6.6% |
| Immigrants | Ghana | 42.1 /100 | #179 | Average 6.6% |
| Immigrants | Austria | 39.6 /100 | #180 | Fair 6.6% |
| Romanians | 39.5 /100 | #181 | Fair 6.6% |
| U.S. Virgin Islanders | 38.6 /100 | #182 | Fair 6.7% |
| Immigrants | Iraq | 37.4 /100 | #183 | Fair 6.7% |
| Iraqis | 37.4 /100 | #184 | Fair 6.7% |
| Immigrants | Oceania | 35.4 /100 | #185 | Fair 6.7% |
| Yup'ik | 35.3 /100 | #186 | Fair 6.7% |
| Maltese | 34.8 /100 | #187 | Fair 6.7% |
| Immigrants | Cameroon | 34.5 /100 | #188 | Fair 6.7% |
| Pakistanis | 33.7 /100 | #189 | Fair 6.7% |
| Immigrants | Zimbabwe | 33.6 /100 | #190 | Fair 6.7% |