Immigrants from Denmark vs Immigrants from Iraq Disability Age 18 to 34
COMPARE
Immigrants from Denmark
Immigrants from Iraq
Disability Age 18 to 34
Disability Age 18 to 34 Comparison
Immigrants from Denmark
Immigrants from Iraq
6.5%
DISABILITY AGE 18 TO 34
71.7/ 100
METRIC RATING
163rd/ 347
METRIC RANK
6.7%
DISABILITY AGE 18 TO 34
37.4/ 100
METRIC RATING
183rd/ 347
METRIC RANK
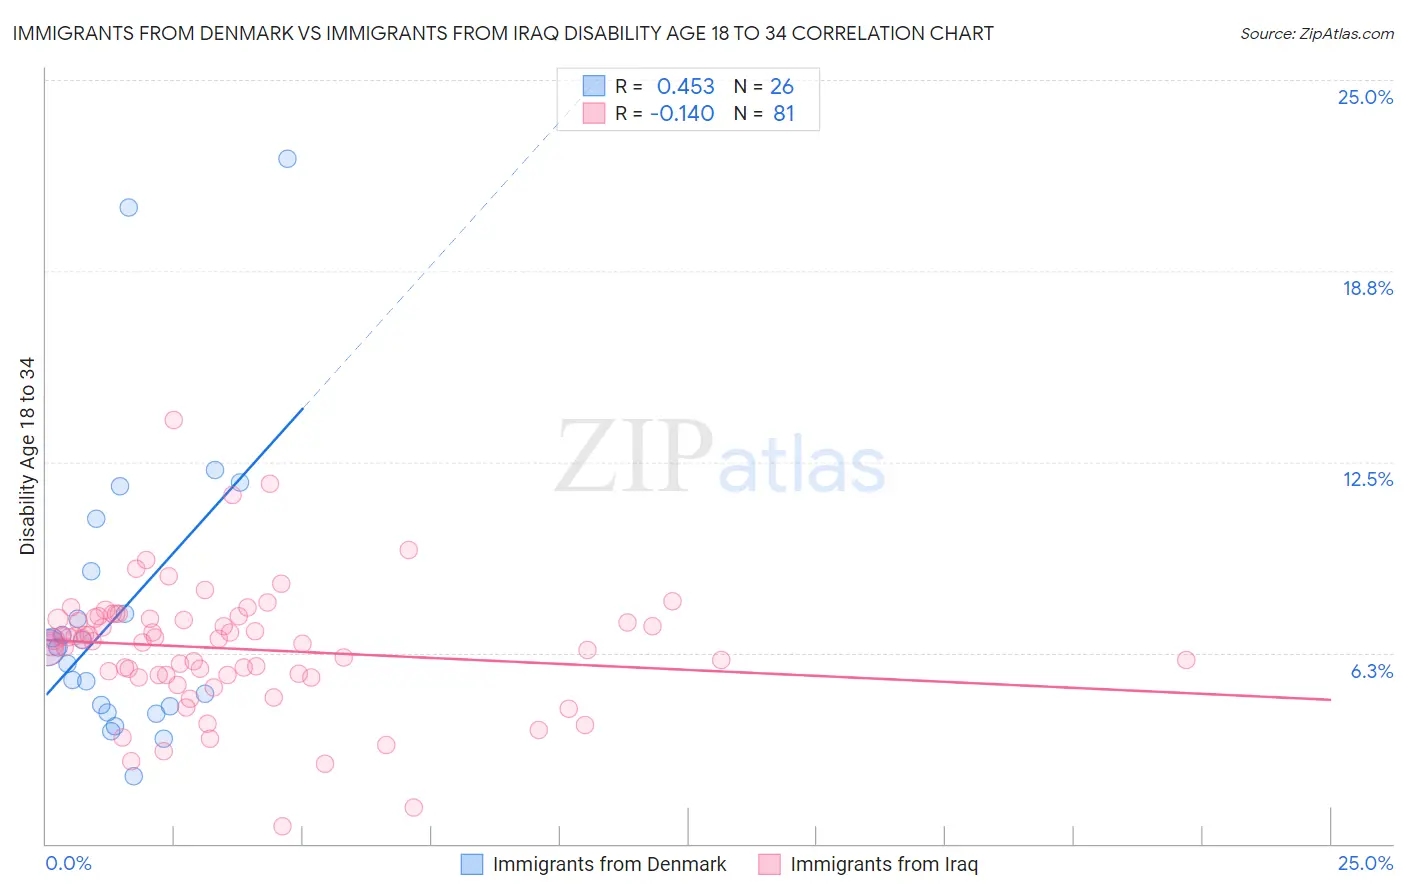
Immigrants from Denmark vs Immigrants from Iraq Disability Age 18 to 34 Correlation Chart
The statistical analysis conducted on geographies consisting of 136,291,158 people shows a moderate positive correlation between the proportion of Immigrants from Denmark and percentage of population with a disability between the ages 18 and 35 in the United States with a correlation coefficient (R) of 0.453 and weighted average of 6.5%. Similarly, the statistical analysis conducted on geographies consisting of 194,718,945 people shows a poor negative correlation between the proportion of Immigrants from Iraq and percentage of population with a disability between the ages 18 and 35 in the United States with a correlation coefficient (R) of -0.140 and weighted average of 6.7%, a difference of 2.5%.
Disability Age 18 to 34 Correlation Summary
| Measurement | Immigrants from Denmark | Immigrants from Iraq |
| Minimum | 2.2% | 0.58% |
| Maximum | 22.4% | 13.9% |
| Range | 20.2% | 13.3% |
| Mean | 7.6% | 6.4% |
| Median | 6.4% | 6.6% |
| Interquartile 25% (IQ1) | 4.5% | 5.5% |
| Interquartile 75% (IQ3) | 8.9% | 7.4% |
| Interquartile Range (IQR) | 4.4% | 1.8% |
| Standard Deviation (Sample) | 4.9% | 2.1% |
| Standard Deviation (Population) | 4.8% | 2.1% |
Demographics Similar to Immigrants from Denmark and Immigrants from Iraq by Disability Age 18 to 34
In terms of disability age 18 to 34, the demographic groups most similar to Immigrants from Denmark are Immigrants from Nigeria (6.5%, a difference of 0.11%), Immigrants from Hungary (6.5%, a difference of 0.17%), Eastern European (6.5%, a difference of 0.53%), Immigrants from Northern Europe (6.5%, a difference of 0.62%), and Immigrants from Moldova (6.5%, a difference of 0.69%). Similarly, the demographic groups most similar to Immigrants from Iraq are U.S. Virgin Islander (6.7%, a difference of 0.090%), Romanian (6.6%, a difference of 0.15%), Immigrants from Austria (6.6%, a difference of 0.16%), Immigrants from Ghana (6.6%, a difference of 0.34%), and Nigerian (6.6%, a difference of 0.45%).
| Demographics | Rating | Rank | Disability Age 18 to 34 |
| Immigrants | Denmark | 71.7 /100 | #163 | Good 6.5% |
| Immigrants | Nigeria | 70.4 /100 | #164 | Good 6.5% |
| Immigrants | Hungary | 69.6 /100 | #165 | Good 6.5% |
| Eastern Europeans | 65.1 /100 | #166 | Good 6.5% |
| Immigrants | Northern Europe | 64.1 /100 | #167 | Good 6.5% |
| Immigrants | Moldova | 63.1 /100 | #168 | Good 6.5% |
| Russians | 60.2 /100 | #169 | Good 6.5% |
| Immigrants | Bahamas | 57.9 /100 | #170 | Average 6.6% |
| Bahamians | 55.5 /100 | #171 | Average 6.6% |
| Ghanaians | 54.7 /100 | #172 | Average 6.6% |
| Immigrants | Mexico | 54.1 /100 | #173 | Average 6.6% |
| Native Hawaiians | 50.0 /100 | #174 | Average 6.6% |
| Immigrants | Cambodia | 46.5 /100 | #175 | Average 6.6% |
| Immigrants | Africa | 45.9 /100 | #176 | Average 6.6% |
| Syrians | 44.3 /100 | #177 | Average 6.6% |
| Nigerians | 43.7 /100 | #178 | Average 6.6% |
| Immigrants | Ghana | 42.1 /100 | #179 | Average 6.6% |
| Immigrants | Austria | 39.6 /100 | #180 | Fair 6.6% |
| Romanians | 39.5 /100 | #181 | Fair 6.6% |
| U.S. Virgin Islanders | 38.6 /100 | #182 | Fair 6.7% |
| Immigrants | Iraq | 37.4 /100 | #183 | Fair 6.7% |