Aleut vs Immigrants from Lebanon Disability Age 18 to 34
COMPARE
Aleut
Immigrants from Lebanon
Disability Age 18 to 34
Disability Age 18 to 34 Comparison
Aleuts
Immigrants from Lebanon
8.1%
DISABILITY AGE 18 TO 34
0.0/ 100
METRIC RATING
319th/ 347
METRIC RANK
6.0%
DISABILITY AGE 18 TO 34
99.2/ 100
METRIC RATING
72nd/ 347
METRIC RANK
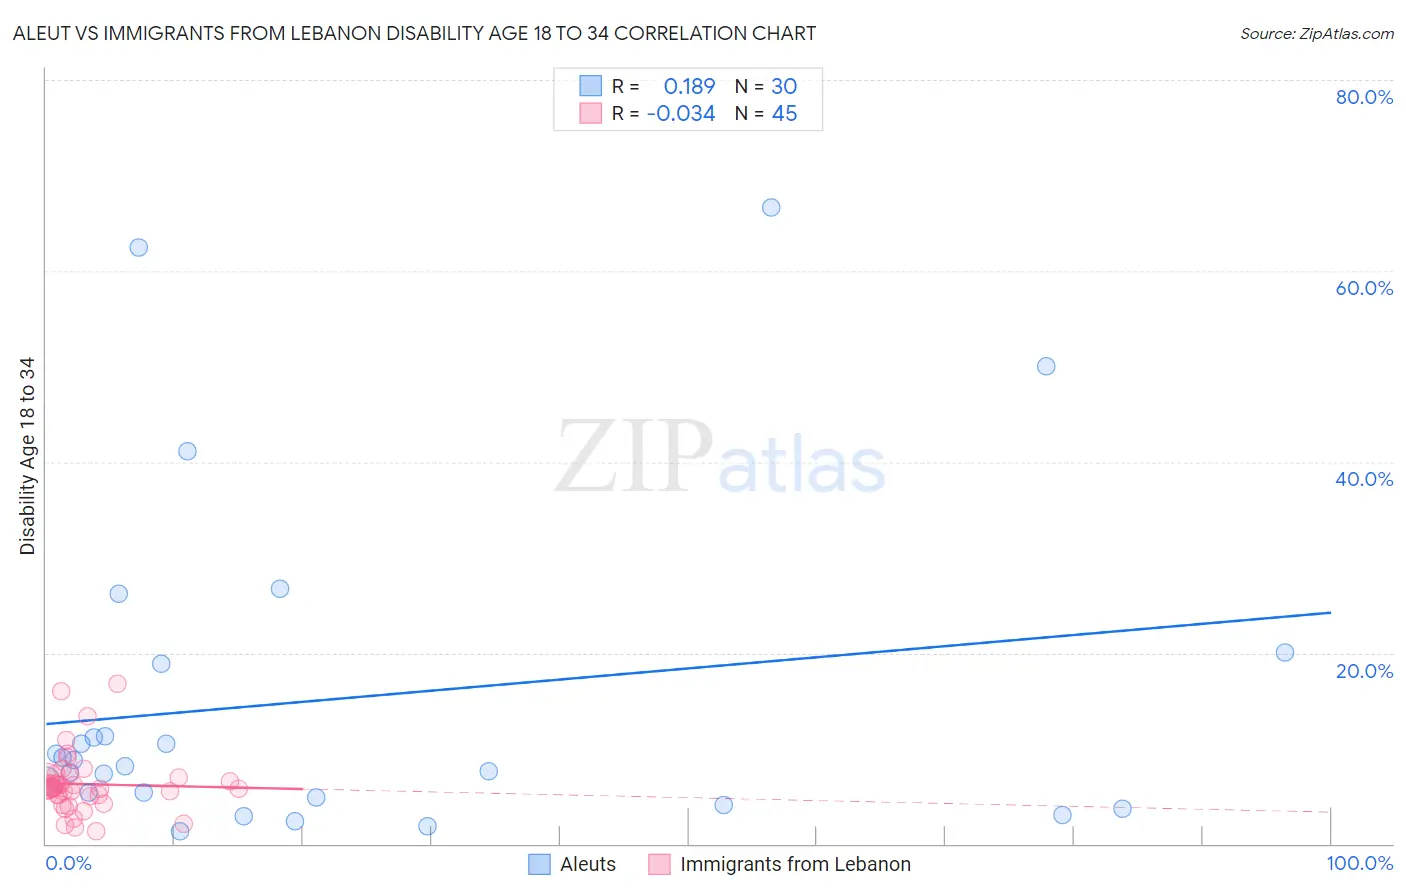
Aleut vs Immigrants from Lebanon Disability Age 18 to 34 Correlation Chart
The statistical analysis conducted on geographies consisting of 61,734,200 people shows a poor positive correlation between the proportion of Aleuts and percentage of population with a disability between the ages 18 and 35 in the United States with a correlation coefficient (R) of 0.189 and weighted average of 8.1%. Similarly, the statistical analysis conducted on geographies consisting of 216,986,941 people shows no correlation between the proportion of Immigrants from Lebanon and percentage of population with a disability between the ages 18 and 35 in the United States with a correlation coefficient (R) of -0.034 and weighted average of 6.0%, a difference of 33.9%.
Disability Age 18 to 34 Correlation Summary
| Measurement | Aleut | Immigrants from Lebanon |
| Minimum | 1.4% | 1.3% |
| Maximum | 66.7% | 16.7% |
| Range | 65.3% | 15.5% |
| Mean | 15.2% | 6.3% |
| Median | 8.5% | 5.8% |
| Interquartile 25% (IQ1) | 4.9% | 5.0% |
| Interquartile 75% (IQ3) | 18.9% | 6.8% |
| Interquartile Range (IQR) | 14.1% | 1.8% |
| Standard Deviation (Sample) | 17.6% | 3.1% |
| Standard Deviation (Population) | 17.3% | 3.1% |
Similar Demographics by Disability Age 18 to 34
Demographics Similar to Aleuts by Disability Age 18 to 34
In terms of disability age 18 to 34, the demographic groups most similar to Aleuts are French Canadian (8.1%, a difference of 0.040%), Navajo (8.1%, a difference of 0.050%), Blackfeet (8.1%, a difference of 0.41%), Cree (8.1%, a difference of 0.46%), and Hmong (8.1%, a difference of 0.47%).
| Demographics | Rating | Rank | Disability Age 18 to 34 |
| Spanish Americans | 0.0 /100 | #312 | Tragic 7.9% |
| Iroquois | 0.0 /100 | #313 | Tragic 7.9% |
| Colville | 0.0 /100 | #314 | Tragic 7.9% |
| Americans | 0.0 /100 | #315 | Tragic 8.0% |
| Puerto Ricans | 0.0 /100 | #316 | Tragic 8.0% |
| Hmong | 0.0 /100 | #317 | Tragic 8.1% |
| French Canadians | 0.0 /100 | #318 | Tragic 8.1% |
| Aleuts | 0.0 /100 | #319 | Tragic 8.1% |
| Navajo | 0.0 /100 | #320 | Tragic 8.1% |
| Blackfeet | 0.0 /100 | #321 | Tragic 8.1% |
| Cree | 0.0 /100 | #322 | Tragic 8.1% |
| French American Indians | 0.0 /100 | #323 | Tragic 8.2% |
| Cajuns | 0.0 /100 | #324 | Tragic 8.2% |
| Natives/Alaskans | 0.0 /100 | #325 | Tragic 8.2% |
| Potawatomi | 0.0 /100 | #326 | Tragic 8.2% |
Demographics Similar to Immigrants from Lebanon by Disability Age 18 to 34
In terms of disability age 18 to 34, the demographic groups most similar to Immigrants from Lebanon are Cypriot (6.0%, a difference of 0.0%), Haitian (6.0%, a difference of 0.090%), Immigrants from Japan (6.0%, a difference of 0.12%), Immigrants from Turkey (6.1%, a difference of 0.38%), and Immigrants from Greece (6.0%, a difference of 0.39%).
| Demographics | Rating | Rank | Disability Age 18 to 34 |
| Trinidadians and Tobagonians | 99.5 /100 | #65 | Exceptional 6.0% |
| Burmese | 99.5 /100 | #66 | Exceptional 6.0% |
| Immigrants | North Macedonia | 99.5 /100 | #67 | Exceptional 6.0% |
| Immigrants | Poland | 99.5 /100 | #68 | Exceptional 6.0% |
| Immigrants | West Indies | 99.4 /100 | #69 | Exceptional 6.0% |
| Immigrants | Greece | 99.4 /100 | #70 | Exceptional 6.0% |
| Immigrants | Japan | 99.3 /100 | #71 | Exceptional 6.0% |
| Immigrants | Lebanon | 99.2 /100 | #72 | Exceptional 6.0% |
| Cypriots | 99.2 /100 | #73 | Exceptional 6.0% |
| Haitians | 99.2 /100 | #74 | Exceptional 6.0% |
| Immigrants | Turkey | 99.1 /100 | #75 | Exceptional 6.1% |
| Immigrants | Western Asia | 98.9 /100 | #76 | Exceptional 6.1% |
| Immigrants | Russia | 98.9 /100 | #77 | Exceptional 6.1% |
| Assyrians/Chaldeans/Syriacs | 98.9 /100 | #78 | Exceptional 6.1% |
| Afghans | 98.7 /100 | #79 | Exceptional 6.1% |