Zip Codes with the Highest Percentage of Population Employed in Sales & Related in Green Valley, AZ
RELATED REPORTS & OPTIONS
Sales & Related
Green Valley
Compare Zip Codes
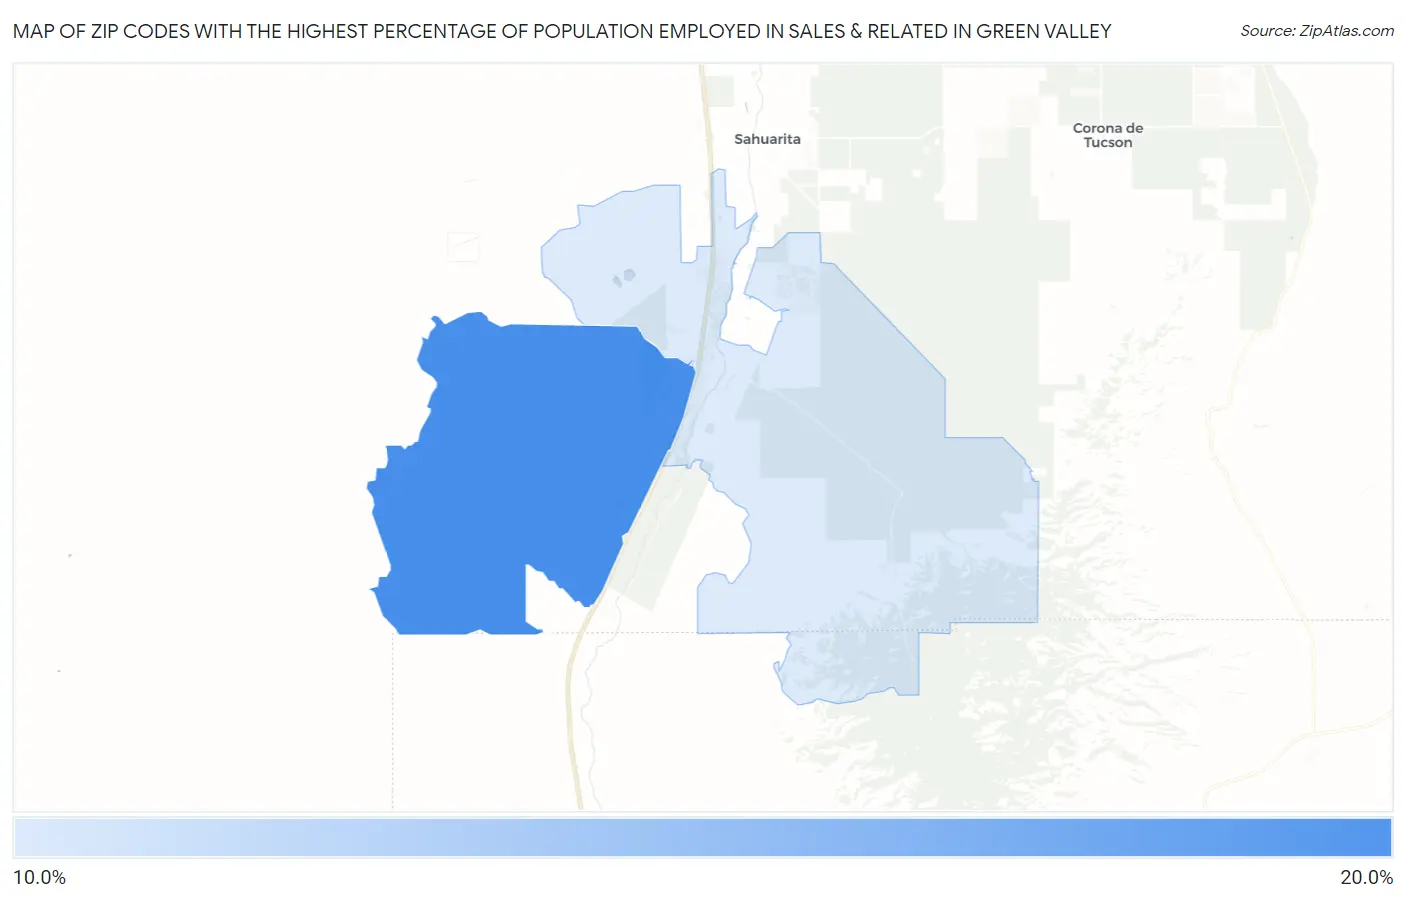
Map of Zip Codes with the Highest Percentage of Population Employed in Sales & Related in Green Valley
11.9%
15.1%
Zip Codes with the Highest Percentage of Population Employed in Sales & Related in Green Valley, AZ
| Zip Code | % Employed | vs State | vs National | |
| 1. | 85622 | 15.1% | 10.3%(+4.73)#38 | 9.6%(+5.48)#2,692 |
| 2. | 85614 | 11.9% | 10.3%(+1.60)#84 | 9.6%(+2.35)#6,148 |
1
Common Questions
What are the Top Zip Codes with the Highest Percentage of Population Employed in Sales & Related in Green Valley, AZ?
Top Zip Codes with the Highest Percentage of Population Employed in Sales & Related in Green Valley, AZ are:
What zip code has the Highest Percentage of Population Employed in Sales & Related in Green Valley, AZ?
85622 has the Highest Percentage of Population Employed in Sales & Related in Green Valley, AZ with 15.1%.
What is the Percentage of Population Employed in Sales & Related in Green Valley, AZ?
Percentage of Population Employed in Sales & Related in Green Valley is 17.0%.
What is the Percentage of Population Employed in Sales & Related in Arizona?
Percentage of Population Employed in Sales & Related in Arizona is 10.3%.
What is the Percentage of Population Employed in Sales & Related in the United States?
Percentage of Population Employed in Sales & Related in the United States is 9.6%.