Zip Codes with the Highest Inequality / Gini Index in Green Valley, AZ
RELATED REPORTS & OPTIONS
Highest Inequality / Gini Index
Green Valley
Compare Zip Codes
Map of Zip Codes with the Highest Inequality / Gini Index in Green Valley
0.44
0.46
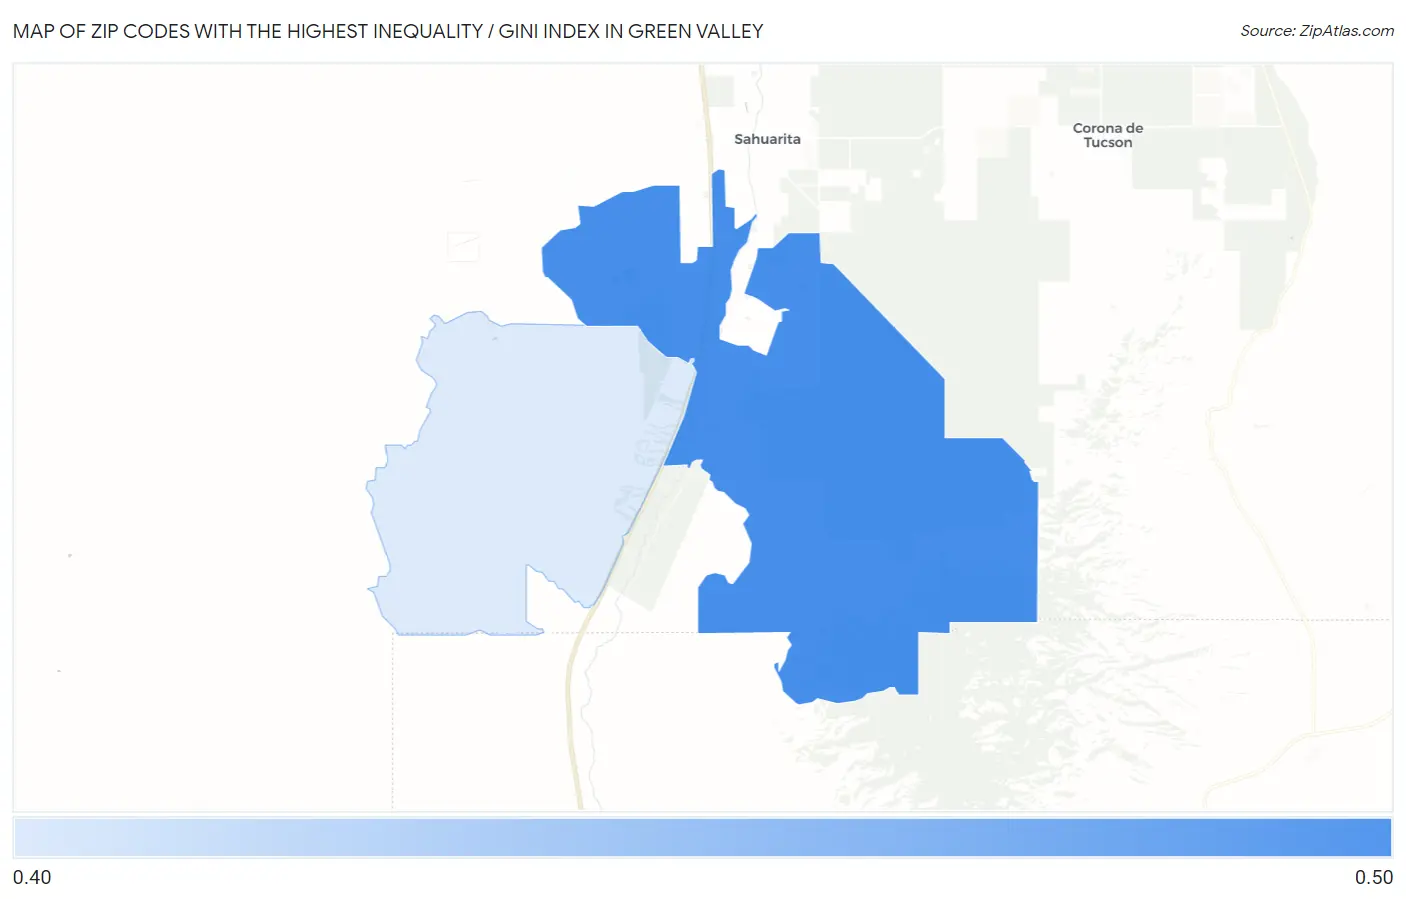
Zip Codes with the Highest Inequality / Gini Index in Green Valley, AZ
| Zip Code | Inequality / Gini Index | vs State | vs National | |
| 1. | 85614 | 0.46 | 0.46(-0.005)#109 | 0.48(-0.027)#8,659 |
| 2. | 85622 | 0.44 | 0.46(-0.024)#167 | 0.48(-0.046)#12,088 |
1
Common Questions
What are the Top Zip Codes with the Highest Inequality / Gini Index in Green Valley, AZ?
Top Zip Codes with the Highest Inequality / Gini Index in Green Valley, AZ are:
What zip code has the Highest Inequality / Gini Index in Green Valley, AZ?
85614 has the Highest Inequality / Gini Index in Green Valley, AZ with 0.46.
What is the Inequality / Gini Index in Green Valley, AZ?
Inequality / Gini Index in Green Valley is 0.45.
What is the Inequality / Gini Index in Arizona?
Inequality / Gini Index in Arizona is 0.46.
What is the Inequality / Gini Index in the United States?
Inequality / Gini Index in the United States is 0.48.