Zip Codes with the Highest Percentage of Households Heated by Bottled Gas / Liquid Propane in Green Valley, AZ
RELATED REPORTS & OPTIONS
Bottled Gas / LP Heating
Green Valley
Compare Zip Codes
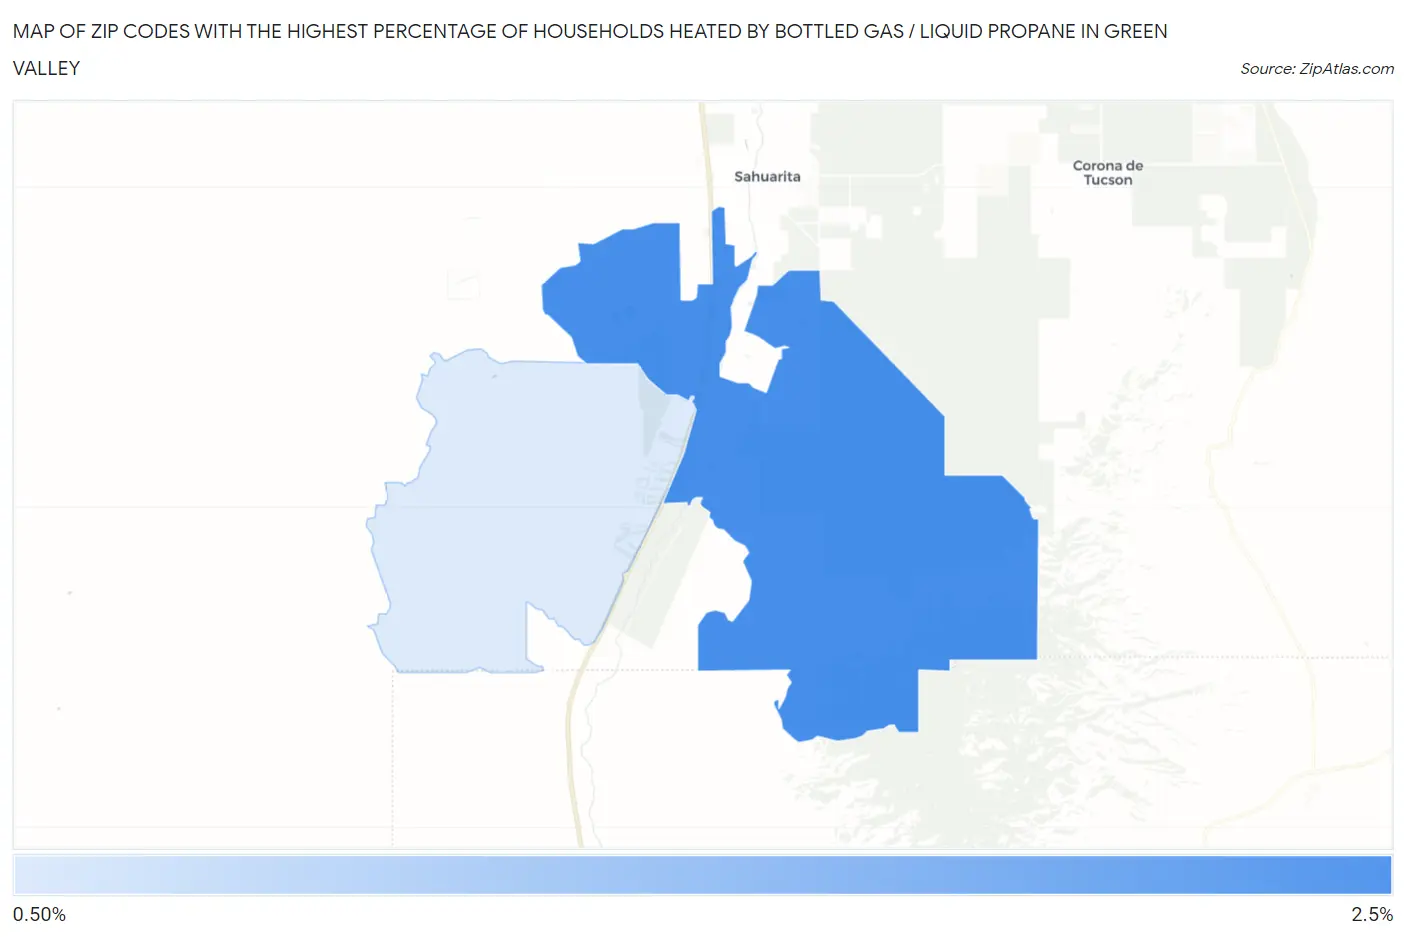
Map of Zip Codes with the Highest Percentage of Households Heated by Bottled Gas / Liquid Propane in Green Valley
0.90%
2.1%
Zip Codes with the Highest Percentage of Households Heated by Bottled Gas / Liquid Propane in Green Valley, AZ
| Zip Code | Bottled Gas / LP Heating | vs State | vs National | |
| 1. | 85614 | 2.1% | 2.8%(-0.700)#215 | 4.9%(-2.80)#22,918 |
| 2. | 85622 | 0.90% | 2.8%(-1.90)#297 | 4.9%(-4.00)#27,288 |
1
Common Questions
What are the Top Zip Codes with the Highest Percentage of Households Heated by Bottled Gas / Liquid Propane in Green Valley, AZ?
Top Zip Codes with the Highest Percentage of Households Heated by Bottled Gas / Liquid Propane in Green Valley, AZ are:
What zip code has the Highest Percentage of Households Heated by Bottled Gas / Liquid Propane in Green Valley, AZ?
85614 has the Highest Percentage of Households Heated by Bottled Gas / Liquid Propane in Green Valley, AZ with 2.1%.
What is the Percentage of Households Heated by Bottled Gas / Liquid Propane in Green Valley, AZ?
Percentage of Households Heated by Bottled Gas / Liquid Propane in Green Valley is 1.0%.
What is the Percentage of Households Heated by Bottled Gas / Liquid Propane in Arizona?
Percentage of Households Heated by Bottled Gas / Liquid Propane in Arizona is 2.8%.
What is the Percentage of Households Heated by Bottled Gas / Liquid Propane in the United States?
Percentage of Households Heated by Bottled Gas / Liquid Propane in the United States is 4.9%.