Zip Codes with the Highest Percentage of Population Taking Taxi / Cab to Work in Green Valley, AZ
RELATED REPORTS & OPTIONS
Taxi / Cab
Green Valley
Compare Zip Codes
Map of Zip Codes with the Highest Percentage of Population Taking Taxi / Cab to Work in Green Valley
67.1%
81.2%
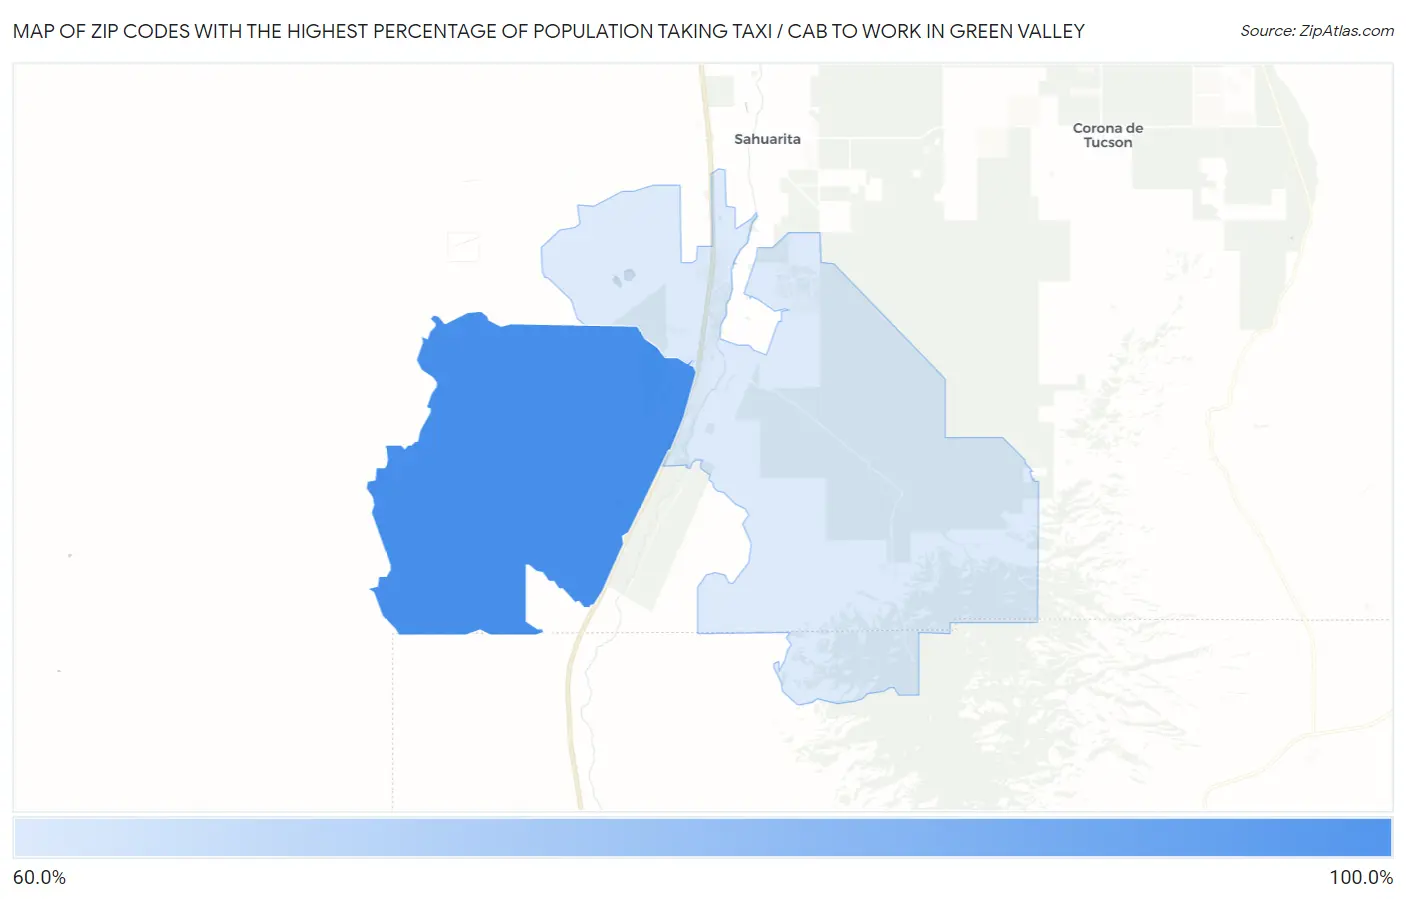
Zip Codes with the Highest Percentage of Population Taking Taxi / Cab to Work in Green Valley, AZ
| Zip Code | % Take Taxi / Cab | vs State | vs National | |
| 1. | 85622 | 81.2% | 38.4%(+42.8)#1 | 38.2%(+43.0)#7 |
| 2. | 85614 | 67.1% | 38.4%(+28.7)#5 | 38.2%(+28.9)#152 |
1
Common Questions
What are the Top Zip Codes with the Highest Percentage of Population Taking Taxi / Cab to Work in Green Valley, AZ?
Top Zip Codes with the Highest Percentage of Population Taking Taxi / Cab to Work in Green Valley, AZ are:
What zip code has the Highest Percentage of Population Taking Taxi / Cab to Work in Green Valley, AZ?
85622 has the Highest Percentage of Population Taking Taxi / Cab to Work in Green Valley, AZ with 81.2%.
What is the Percentage of Population Taking Taxi / Cab to Work in Green Valley, AZ?
Percentage of Population Taking Taxi / Cab to Work in Green Valley is 69.8%.
What is the Percentage of Population Taking Taxi / Cab to Work in Arizona?
Percentage of Population Taking Taxi / Cab to Work in Arizona is 38.4%.
What is the Percentage of Population Taking Taxi / Cab to Work in the United States?
Percentage of Population Taking Taxi / Cab to Work in the United States is 38.2%.