Zip Codes with the Most Immigrants from South Eastern Asia in Green Valley, AZ
RELATED REPORTS & OPTIONS
South Eastern Asia
Green Valley
Compare Zip Codes
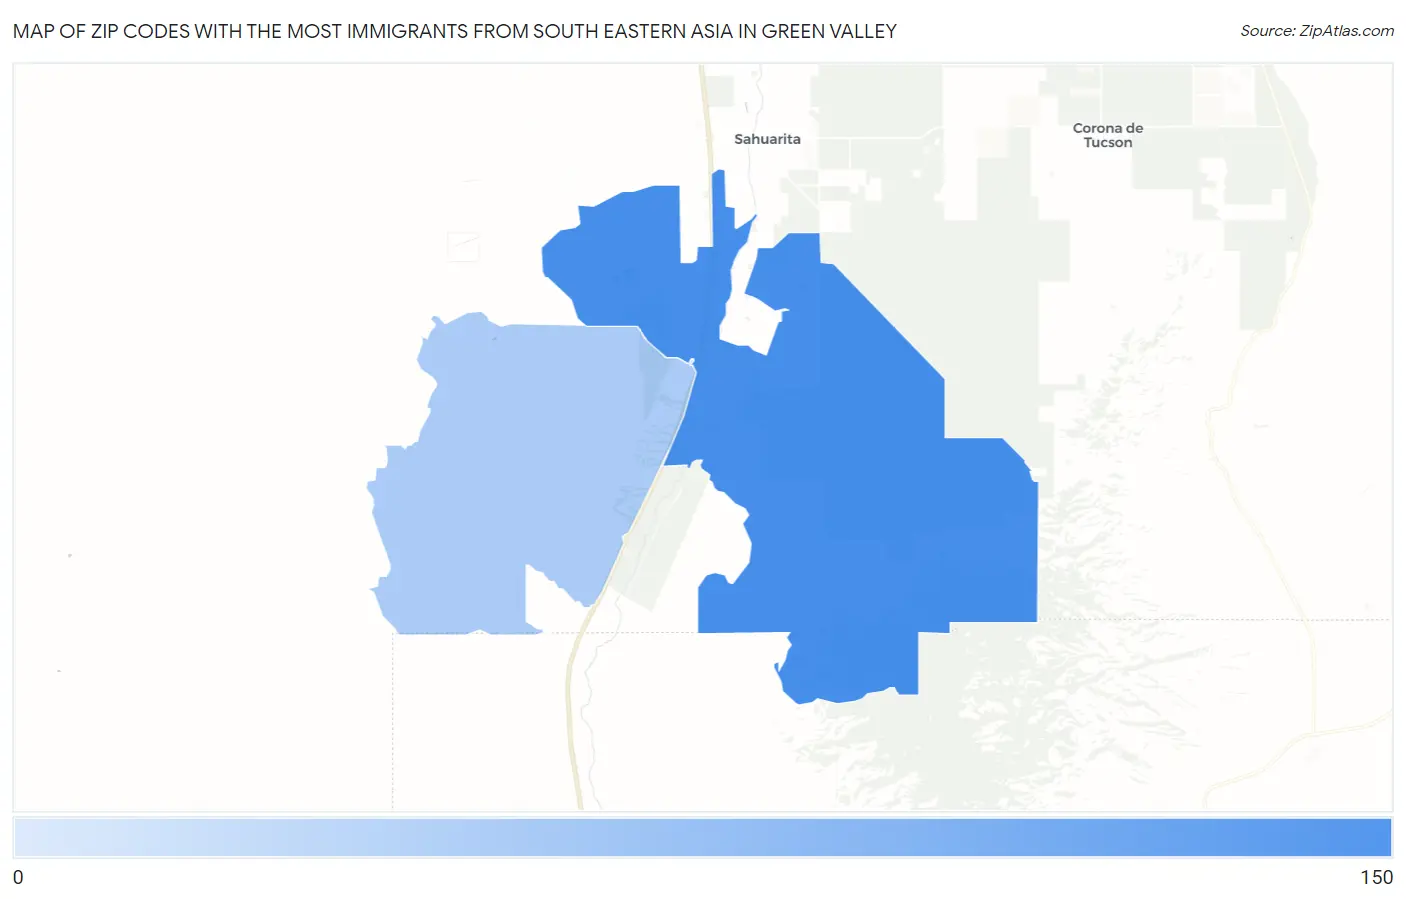
Map of Zip Codes with the Most Immigrants from South Eastern Asia in Green Valley
4
124
Zip Codes with the Most Immigrants from South Eastern Asia in Green Valley, AZ
| Zip Code | South Eastern Asia | vs State | vs National | |
| 1. | 85614 | 124 | 63,417(0.20%)#134 | 4,292,058(0.00%)#5,338 |
| 2. | 85622 | 4 | 63,417(0.01%)#238 | 4,292,058(0.00%)#13,559 |
1
Common Questions
What are the Top Zip Codes with the Most Immigrants from South Eastern Asia in Green Valley, AZ?
Top Zip Codes with the Most Immigrants from South Eastern Asia in Green Valley, AZ are:
What zip code has the Most Immigrants from South Eastern Asia in Green Valley, AZ?
85614 has the Most Immigrants from South Eastern Asia in Green Valley, AZ with 124.
What is the Total Immigrants from South Eastern Asia in Green Valley, AZ?
Total Immigrants from South Eastern Asia in Green Valley is 128.
What is the Total Immigrants from South Eastern Asia in Arizona?
Total Immigrants from South Eastern Asia in Arizona is 63,417.
What is the Total Immigrants from South Eastern Asia in the United States?
Total Immigrants from South Eastern Asia in the United States is 4,292,058.