Zip Codes with the Most Immigrants from Italy in Green Valley, AZ
On this page
RELATED REPORTS & OPTIONS
Italy
Population
Highest PopulationHighest Population DensityLowest Population DensityMale / Female RatioFemale / Male RatioOldest PopulationOldest Population | MaleOldest Population | FemaleYoungest PopulationYoungest Population | MaleYoungest Population | Female
Families and Households
Largest Family SizeLargest Household SizeMost Single MothersFewest Single MothersSmallest Family SizeSmallest Household Size
Race (Community Size)
Race (Percentage)
Ancestry (Community Size)
AmericanAustralianAustrianBelgianBritishCanadianCentral AmericanCentral American IndianCherokeeCroatianCzechDanishDutchEnglishEuropeanFinnishFrenchFrench CanadianGermanGreekHungarianIndian (Asian)IrishItalianKoreanLithuanianMalteseMexicanNorthern EuropeanNorwegianPolishPortuguesePuerto RicanRomanianRussianSalvadoranScandinavianScotch-IrishScottishSlavicSlovakSloveneSpaniardSpanishSwedishSwissUkrainianWelshYaqui
Ancestry (Percentage)
AmericanAustralianAustrianBelgianBritishCanadianCentral AmericanCentral American IndianCherokeeCroatianCzechDanishDutchEnglishEuropeanFinnishFrenchFrench CanadianGermanGreekHungarianIndian (Asian)IrishItalianKoreanLithuanianMalteseMexicanNorthern EuropeanNorwegianPolishPortuguesePuerto RicanRomanianRussianSalvadoranScandinavianScotch-IrishScottishSlavicSlovakSloveneSpaniardSpanishSwedishSwissUkrainianWelshYaqui
Immigrant Origin (Total)
AfricaAsiaAustriaCanadaCentral AmericaEastern AfricaEastern EuropeEnglandEuropeFranceGermanyGreeceIrelandItalyLatin AmericaMexicoMiddle AfricaNorthern EuropePhilippinesPolandScotlandSouth Central AsiaSouth Eastern AsiaSouthern EuropeWestern EuropeZaire
Immigrant Origin (Percentage)
AfricaAsiaAustriaCanadaCentral AmericaEastern AfricaEastern EuropeEnglandEuropeFranceGermanyGreeceIrelandItalyLatin AmericaMexicoMiddle AfricaNorthern EuropePhilippinesPolandScotlandSouth Central AsiaSouth Eastern AsiaSouthern EuropeWestern EuropeZaire
Income
Highest Per Capita IncomeHighest Earnings | MaleHighest Earnings | FemaleHighest Wage/Income Gap ($)Highest Wage/Income Gap (%)Highest Inequality / Gini IndexLowest Per Capita IncomeLowest Earnings | MaleLowest Earnings | FemaleLowest Wage/Income Gap ($)Lowest Wage/Income Gap (%)Lowest Inequality / Gini Index
Income (Families)
Highest Family IncomeLowest Family IncomeFamily Income | $0-10kFamily Income | $100k+Family Income | $200k+
Income (Households)
Highest Household IncomeLowest Household IncomeHousehold Income | $0-10kHousehold Income | $200k+Household Income | $100k+
Poverty
Highest PovertyHighest Poverty | MaleHighest Poverty | FemaleHighest Poverty | Seniors 65+Highest Poverty | Seniors 75+ Lowest PovertyLowest Poverty | MaleLowest Poverty | FemaleLowest Poverty | Seniors 65+Lowest Poverty | Seniors 75+
Poverty (Families)
Highest Family PovertyHighest Poverty | Married CoupleHighest Poverty | Single MaleLowest Family PovertyLowest Poverty | Married CoupleLowest Poverty | Single Male
Unemployment
Highest UnemploymentHighest Unemployment | MaleHighest Unemployment | FemaleHighest Unemployment | Senior > 65Lowest UnemploymentLowest Unemployment | MaleLowest Unemployment | FemaleLowest Unemployment | Senior > 65
Employment Occupations
Architecture & EngineeringArts, Media & EntertainmentBusiness & FinancialCleaning & MaintenanceCommunity & Social Service Computer & MathematicsComputer, Engineering & ScienceConstruction & ExtractionEducation Instruction & LibraryEducation, Arts & MediaFarming, Fishing & ForestryFirefighting & PreventionFood Preparation & ServingHealth Diagnosing & TreatingHealth TechnologistsHealthcare SupportInstallation, Maintenance & RepairLaw EnforcementLegal Services & SupportManagementMaterial MovingOffice & AdministrationPersonal Care and ServiceProductionSales & RelatedSecurity & ProtectionTransportation
Employment Industries
Accommodation & Food ServicesAdministrative & Support ServicesArts, Entertainment & RecreationConstructionEducational ServicesFinance & InsuranceHealth Care & Social AssistanceInformation & TechnologyManufacturingProfessional & Scientific ServicesPublic AdministrationReal Estate, Rental & LeasingRetail TradeTransportation & WarehousingWholesale Trade
Employer Class
Private Company EmployeesSelf-Employed / IncorporatedSelf-Employed / Not IncorporatedNot-for-profit OrganizationsLocal Government EmployeesState Government EmployeesFederal Government Employees
Commute Time
Longest CommuteLongest Commute | MaleLongest Commute | FemaleShortest CommuteShortest Commute | MaleShortest Commute | Female
Commute Means
School Enrollment
Education by Degree Field
Computers and MathematicsBio, Nature & AgriculturalPhysical and Health SciencesPsychologySocial SciencesEngineeringMultidisciplinary StudiesScience and EngineeringBusinessEducationLiterature and LanguagesLiberal Arts and HistoryVisual and Performing ArtsCommunicationsArts and Humanities
Occupancy
Finances
Highest Median Housing CostsHighest Property PricesHighest Owner Housing CostsHighest Renter Housing CostsHighest Housing Costs / IncomeLowest Median Housing CostsLowest Property PricesLowest Owner Housing CostsLowest Renter Housing CostsLowest Housing Costs / Income
Physical Characteristics
Green Valley
States
AlabamaAlaskaArizonaArkansasCaliforniaColoradoConnecticutDelawareDistrict Of ColumbiaFloridaGeorgiaHawaiiIdahoIllinoisIndianaIowaKansasKentuckyLouisianaMaineMarylandMassachusettsMichiganMinnesotaMississippiMissouriMontanaNebraskaNevadaNew HampshireNew JerseyNew MexicoNew YorkNorth CarolinaNorth DakotaOhioOklahomaOregonPennsylvaniaPuerto RicoRhode IslandSouth CarolinaSouth DakotaTennesseeTexasUtahVermontVirginiaWashingtonWest VirginiaWisconsinWyoming
Arizona Cities
Compare Zip Codes
Comparison Subject
Compare StatesCompare CitiesCompare Zip Codes
Map of Zip Codes with the Most Immigrants from Italy in Green Valley
2
63
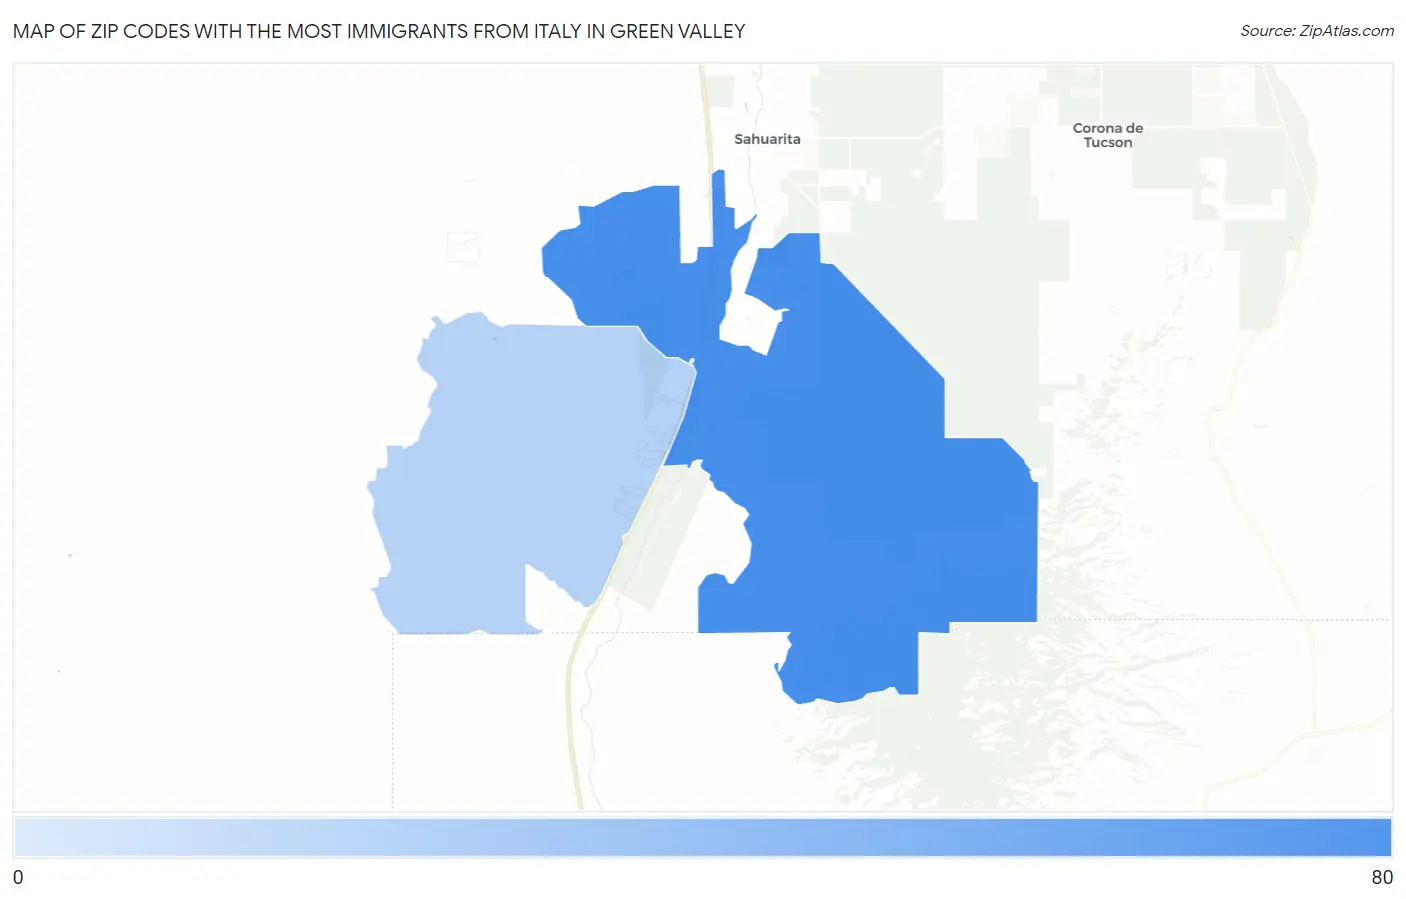
Zip Codes with the Most Immigrants from Italy in Green Valley, AZ
| Zip Code | Italy | vs State | vs National | |
| 1. | 85614 | 63 | 4,190(1.50%)#15 | 312,941(0.02%)#1,324 |
| 2. | 85622 | 2 | 4,190(0.05%)#115 | 312,941(0.00%)#5,950 |
1
Common Questions
What are the Top Zip Codes with the Most Immigrants from Italy in Green Valley, AZ?
Top Zip Codes with the Most Immigrants from Italy in Green Valley, AZ are:
What zip code has the Most Immigrants from Italy in Green Valley, AZ?
85614 has the Most Immigrants from Italy in Green Valley, AZ with 63.
What is the Total Immigrants from Italy in Green Valley, AZ?
Total Immigrants from Italy in Green Valley is 52.
What is the Total Immigrants from Italy in Arizona?
Total Immigrants from Italy in Arizona is 4,190.
What is the Total Immigrants from Italy in the United States?
Total Immigrants from Italy in the United States is 312,941.