Oshkosh, WI Map & Demographics
Oshkosh Map
Oshkosh Overview
$30,191
PER CAPITA INCOME
$79,958
AVG FAMILY INCOME
$59,186
AVG HOUSEHOLD INCOME
26.0%
WAGE / INCOME GAP [ % ]
74.0¢/ $1
WAGE / INCOME GAP [ $ ]
$12,439
FAMILY INCOME DEFICIT
0.40
INEQUALITY / GINI INDEX
66,373
TOTAL POPULATION
33,979
MALE POPULATION
32,394
FEMALE POPULATION
104.89
MALES / 100 FEMALES
95.34
FEMALES / 100 MALES
34.0
MEDIAN AGE
2.9
AVG FAMILY SIZE
2.2
AVG HOUSEHOLD SIZE
35,951
LABOR FORCE [ PEOPLE ]
64.2%
PERCENT IN LABOR FORCE
2.9%
UNEMPLOYMENT RATE
Oshkosh Area Codes
Income in Oshkosh
Income Overview in Oshkosh
Per Capita Income in Oshkosh is $30,191, while median incomes of families and households are $79,958 and $59,186 respectively.
| Characteristic | Number | Measure |
| Per Capita Income | 66,373 | $30,191 |
| Median Family Income | 13,263 | $79,958 |
| Mean Family Income | 13,263 | $89,900 |
| Median Household Income | 26,763 | $59,186 |
| Mean Household Income | 26,763 | $71,904 |
| Income Deficit | 13,263 | $12,439 |
| Wage / Income Gap (%) | 66,373 | 25.97% |
| Wage / Income Gap ($) | 66,373 | 74.03¢ per $1 |
| Gini / Inequality Index | 66,373 | 0.40 |
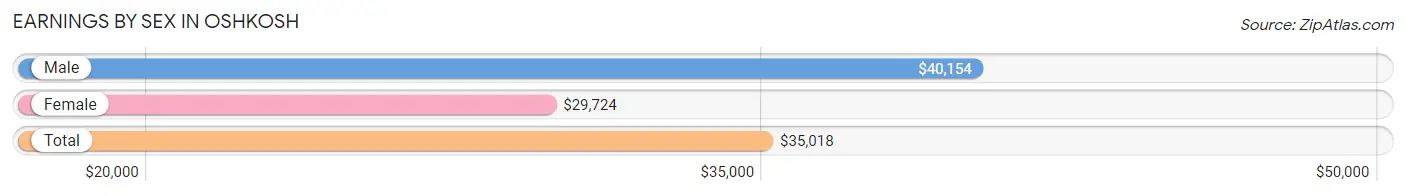
Earnings by Sex in Oshkosh
Average Earnings in Oshkosh are $35,018, $40,154 for men and $29,724 for women, a difference of 26.0%.
| Sex | Number | Average Earnings |
| Male | 20,448 (52.4%) | $40,154 |
| Female | 18,534 (47.5%) | $29,724 |
| Total | 38,982 (100.0%) | $35,018 |
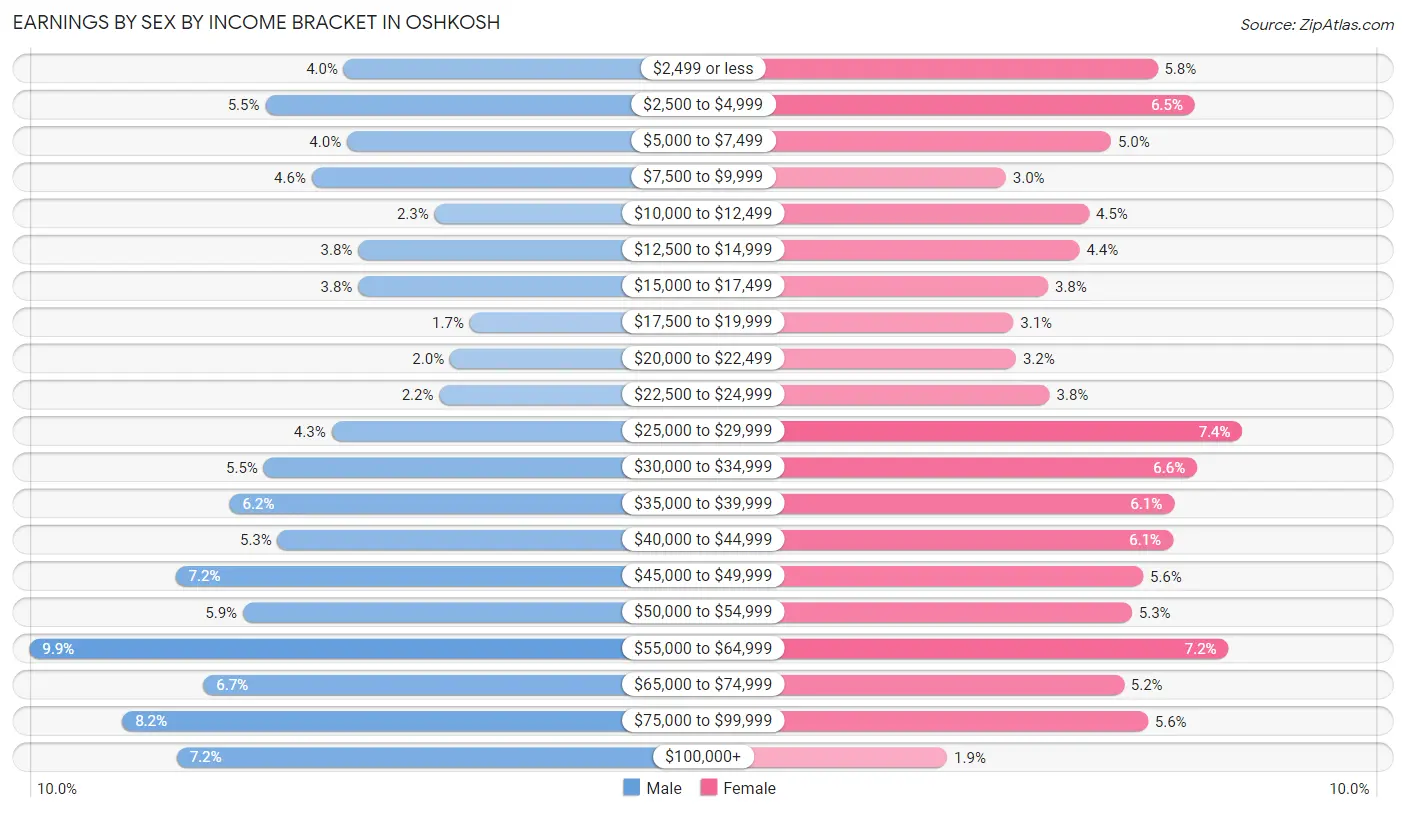
Earnings by Sex by Income Bracket in Oshkosh
The most common earnings brackets in Oshkosh are $55,000 to $64,999 for men (2,027 | 9.9%) and $25,000 to $29,999 for women (1,373 | 7.4%).
| Income | Male | Female |
| $2,499 or less | 823 (4.0%) | 1,079 (5.8%) |
| $2,500 to $4,999 | 1,122 (5.5%) | 1,208 (6.5%) |
| $5,000 to $7,499 | 810 (4.0%) | 918 (5.0%) |
| $7,500 to $9,999 | 945 (4.6%) | 552 (3.0%) |
| $10,000 to $12,499 | 475 (2.3%) | 841 (4.5%) |
| $12,500 to $14,999 | 766 (3.7%) | 809 (4.4%) |
| $15,000 to $17,499 | 767 (3.7%) | 699 (3.8%) |
| $17,500 to $19,999 | 339 (1.7%) | 578 (3.1%) |
| $20,000 to $22,499 | 415 (2.0%) | 587 (3.2%) |
| $22,500 to $24,999 | 457 (2.2%) | 705 (3.8%) |
| $25,000 to $29,999 | 870 (4.3%) | 1,373 (7.4%) |
| $30,000 to $34,999 | 1,129 (5.5%) | 1,216 (6.6%) |
| $35,000 to $39,999 | 1,259 (6.2%) | 1,136 (6.1%) |
| $40,000 to $44,999 | 1,076 (5.3%) | 1,132 (6.1%) |
| $45,000 to $49,999 | 1,467 (7.2%) | 1,028 (5.6%) |
| $50,000 to $54,999 | 1,208 (5.9%) | 990 (5.3%) |
| $55,000 to $64,999 | 2,027 (9.9%) | 1,326 (7.1%) |
| $65,000 to $74,999 | 1,360 (6.7%) | 962 (5.2%) |
| $75,000 to $99,999 | 1,671 (8.2%) | 1,046 (5.6%) |
| $100,000+ | 1,462 (7.1%) | 349 (1.9%) |
| Total | 20,448 (100.0%) | 18,534 (100.0%) |
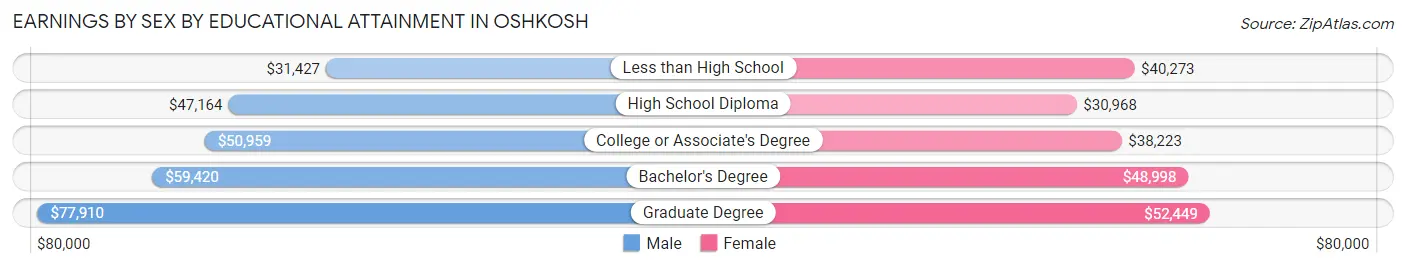
Earnings by Sex by Educational Attainment in Oshkosh
Average earnings in Oshkosh are $50,909 for men and $40,426 for women, a difference of 20.6%. Men with an educational attainment of graduate degree enjoy the highest average annual earnings of $77,910, while those with less than high school education earn the least with $31,427. Women with an educational attainment of graduate degree earn the most with the average annual earnings of $52,449, while those with high school diploma education have the smallest earnings of $30,968.
| Educational Attainment | Male Income | Female Income |
| Less than High School | $31,427 | $40,273 |
| High School Diploma | $47,164 | $30,968 |
| College or Associate's Degree | $50,959 | $38,223 |
| Bachelor's Degree | $59,420 | $48,998 |
| Graduate Degree | $77,910 | $52,449 |
| Total | $50,909 | $40,426 |
Family Income in Oshkosh
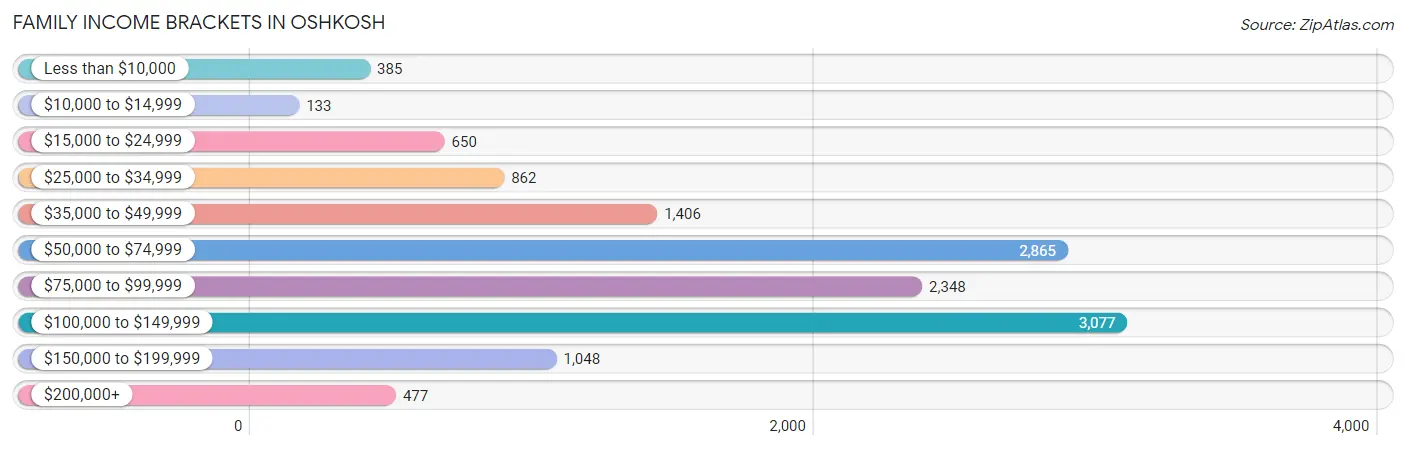
Family Income Brackets in Oshkosh
According to the Oshkosh family income data, there are 3,077 families falling into the $100,000 to $149,999 income range, which is the most common income bracket and makes up 23.2% of all families. Conversely, the $10,000 to $14,999 income bracket is the least frequent group with only 133 families (1.0%) belonging to this category.
| Income Bracket | # Families | % Families |
| Less than $10,000 | 385 | 2.9% |
| $10,000 to $14,999 | 133 | 1.0% |
| $15,000 to $24,999 | 650 | 4.9% |
| $25,000 to $34,999 | 862 | 6.5% |
| $35,000 to $49,999 | 1,406 | 10.6% |
| $50,000 to $74,999 | 2,865 | 21.6% |
| $75,000 to $99,999 | 2,348 | 17.7% |
| $100,000 to $149,999 | 3,077 | 23.2% |
| $150,000 to $199,999 | 1,048 | 7.9% |
| $200,000+ | 477 | 3.6% |
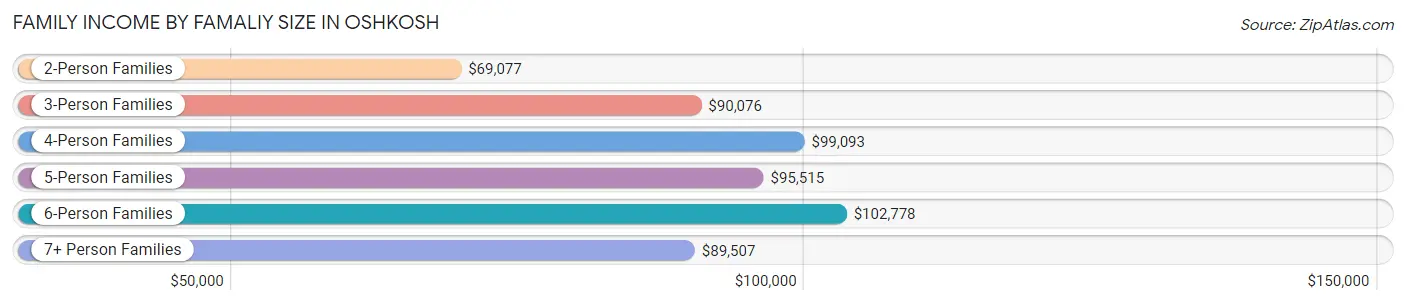
Family Income by Famaliy Size in Oshkosh
6-person families (138 | 1.0%) account for the highest median family income in Oshkosh with $102,778 per family, while 2-person families (7,205 | 54.3%) have the highest median income of $34,538 per family member.
| Income Bracket | # Families | Median Income |
| 2-Person Families | 7,205 (54.3%) | $69,077 |
| 3-Person Families | 2,859 (21.6%) | $90,076 |
| 4-Person Families | 2,093 (15.8%) | $99,093 |
| 5-Person Families | 819 (6.2%) | $95,515 |
| 6-Person Families | 138 (1.0%) | $102,778 |
| 7+ Person Families | 149 (1.1%) | $89,507 |
| Total | 13,263 (100.0%) | $79,958 |
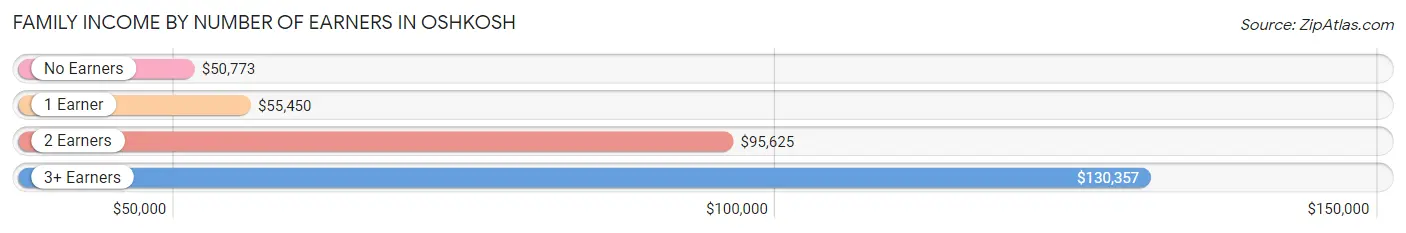
Family Income by Number of Earners in Oshkosh
The median family income in Oshkosh is $79,958, with families comprising 3+ earners (1,424) having the highest median family income of $130,357, while families with no earners (2,035) have the lowest median family income of $50,773, accounting for 10.7% and 15.3% of families, respectively.
| Number of Earners | # Families | Median Income |
| No Earners | 2,035 (15.3%) | $50,773 |
| 1 Earner | 3,902 (29.4%) | $55,450 |
| 2 Earners | 5,902 (44.5%) | $95,625 |
| 3+ Earners | 1,424 (10.7%) | $130,357 |
| Total | 13,263 (100.0%) | $79,958 |
Household Income in Oshkosh
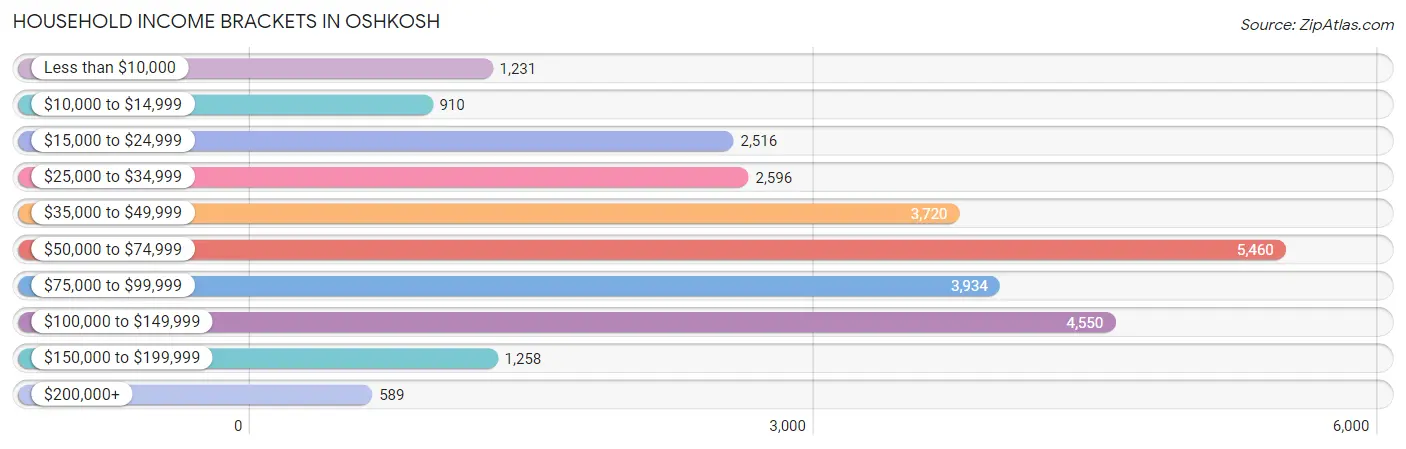
Household Income Brackets in Oshkosh
With 5,460 households falling in the category, the $50,000 to $74,999 income range is the most frequent in Oshkosh, accounting for 20.4% of all households. In contrast, only 589 households (2.2%) fall into the $200,000+ income bracket, making it the least populous group.
| Income Bracket | # Households | % Households |
| Less than $10,000 | 1,231 | 4.6% |
| $10,000 to $14,999 | 910 | 3.4% |
| $15,000 to $24,999 | 2,516 | 9.4% |
| $25,000 to $34,999 | 2,596 | 9.7% |
| $35,000 to $49,999 | 3,720 | 13.9% |
| $50,000 to $74,999 | 5,460 | 20.4% |
| $75,000 to $99,999 | 3,934 | 14.7% |
| $100,000 to $149,999 | 4,550 | 17.0% |
| $150,000 to $199,999 | 1,258 | 4.7% |
| $200,000+ | 589 | 2.2% |
Household Income by Householder Age in Oshkosh
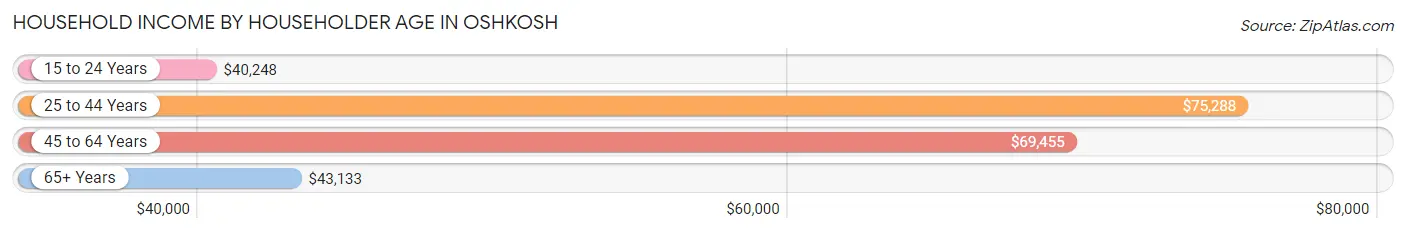
The median household income in Oshkosh is $59,186, with the highest median household income of $75,288 found in the 25 to 44 years age bracket for the primary householder. A total of 8,484 households (31.7%) fall into this category. Meanwhile, the 15 to 24 years age bracket for the primary householder has the lowest median household income of $40,248, with 3,230 households (12.1%) in this group.
| Income Bracket | # Households | Median Income |
| 15 to 24 Years | 3,230 (12.1%) | $40,248 |
| 25 to 44 Years | 8,484 (31.7%) | $75,288 |
| 45 to 64 Years | 8,673 (32.4%) | $69,455 |
| 65+ Years | 6,376 (23.8%) | $43,133 |
| Total | 26,763 (100.0%) | $59,186 |
Poverty in Oshkosh
Income Below Poverty by Sex and Age in Oshkosh
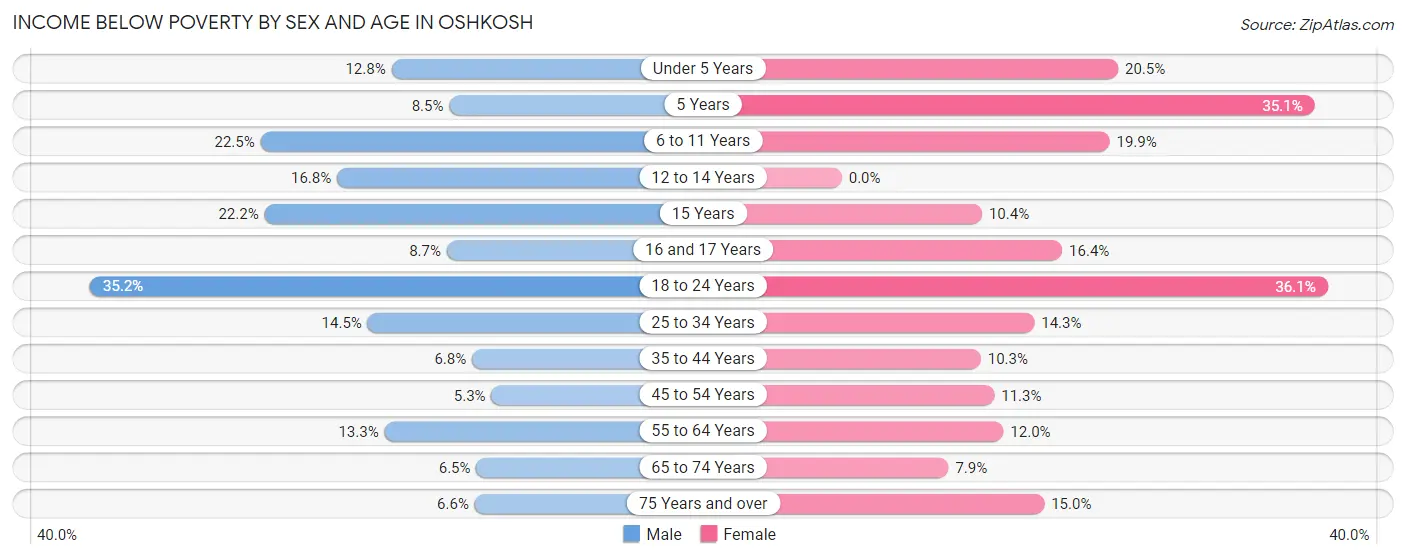
With 15.5% poverty level for males and 16.7% for females among the residents of Oshkosh, 18 to 24 year old males and 18 to 24 year old females are the most vulnerable to poverty, with 1,875 males (35.1%) and 1,692 females (36.1%) in their respective age groups living below the poverty level.
| Age Bracket | Male | Female |
| Under 5 Years | 214 (12.8%) | 336 (20.5%) |
| 5 Years | 21 (8.5%) | 159 (35.1%) |
| 6 to 11 Years | 362 (22.5%) | 356 (19.9%) |
| 12 to 14 Years | 173 (16.8%) | 0 (0.0%) |
| 15 Years | 81 (22.2%) | 41 (10.4%) |
| 16 and 17 Years | 50 (8.6%) | 90 (16.4%) |
| 18 to 24 Years | 1,875 (35.1%) | 1,692 (36.1%) |
| 25 to 34 Years | 688 (14.5%) | 582 (14.3%) |
| 35 to 44 Years | 237 (6.8%) | 342 (10.3%) |
| 45 to 54 Years | 171 (5.3%) | 373 (11.3%) |
| 55 to 64 Years | 502 (13.3%) | 441 (12.0%) |
| 65 to 74 Years | 143 (6.5%) | 215 (7.9%) |
| 75 Years and over | 102 (6.6%) | 386 (15.0%) |
| Total | 4,619 (15.5%) | 5,013 (16.7%) |
Income Above Poverty by Sex and Age in Oshkosh
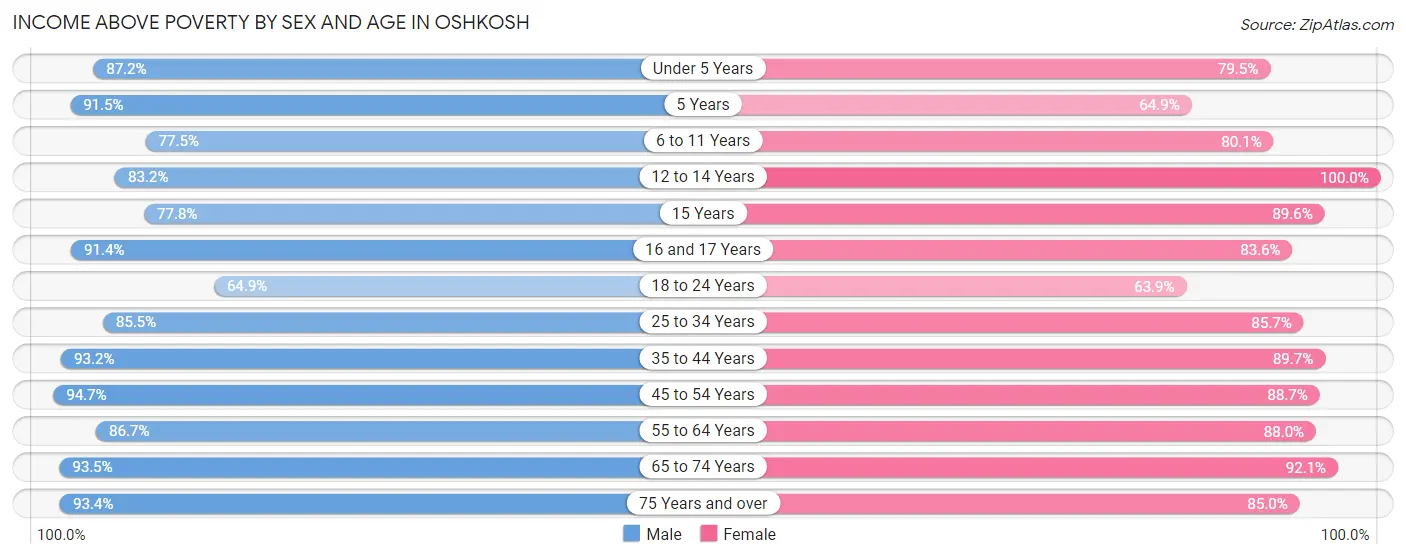
According to the poverty statistics in Oshkosh, males aged 45 to 54 years and females aged 12 to 14 years are the age groups that are most secure financially, with 94.7% of males and 100.0% of females in these age groups living above the poverty line.
| Age Bracket | Male | Female |
| Under 5 Years | 1,463 (87.2%) | 1,302 (79.5%) |
| 5 Years | 227 (91.5%) | 294 (64.9%) |
| 6 to 11 Years | 1,248 (77.5%) | 1,435 (80.1%) |
| 12 to 14 Years | 857 (83.2%) | 780 (100.0%) |
| 15 Years | 284 (77.8%) | 353 (89.6%) |
| 16 and 17 Years | 528 (91.3%) | 460 (83.6%) |
| 18 to 24 Years | 3,460 (64.8%) | 3,000 (63.9%) |
| 25 to 34 Years | 4,046 (85.5%) | 3,492 (85.7%) |
| 35 to 44 Years | 3,259 (93.2%) | 2,973 (89.7%) |
| 45 to 54 Years | 3,031 (94.7%) | 2,922 (88.7%) |
| 55 to 64 Years | 3,278 (86.7%) | 3,235 (88.0%) |
| 65 to 74 Years | 2,072 (93.5%) | 2,500 (92.1%) |
| 75 Years and over | 1,448 (93.4%) | 2,183 (85.0%) |
| Total | 25,201 (84.5%) | 24,929 (83.3%) |
Income Below Poverty Among Married-Couple Families in Oshkosh
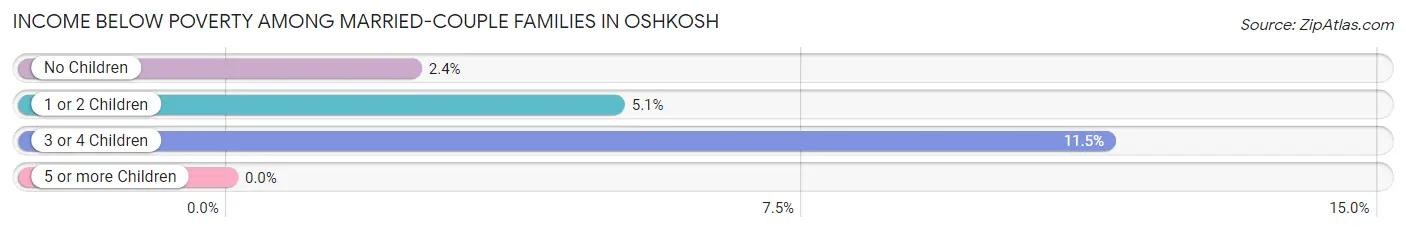
The poverty statistics for married-couple families in Oshkosh show that 3.8% or 371 of the total 9,700 families live below the poverty line. Families with 3 or 4 children have the highest poverty rate of 11.5%, comprising of 77 families. On the other hand, families with 5 or more children have the lowest poverty rate of 0.0%, which includes 0 families.
| Children | Above Poverty | Below Poverty |
| No Children | 5,900 (97.6%) | 145 (2.4%) |
| 1 or 2 Children | 2,804 (95.0%) | 149 (5.1%) |
| 3 or 4 Children | 595 (88.5%) | 77 (11.5%) |
| 5 or more Children | 30 (100.0%) | 0 (0.0%) |
| Total | 9,329 (96.2%) | 371 (3.8%) |
Income Below Poverty Among Single-Parent Households in Oshkosh
According to the poverty data in Oshkosh, 10.8% or 149 single-father households and 19.7% or 430 single-mother households are living below the poverty line. Among single-father households, those with 1 or 2 children have the highest poverty rate, with 141 households (16.9%) experiencing poverty. Likewise, among single-mother households, those with 5 or more children have the highest poverty rate, with 23 households (67.6%) falling below the poverty line.
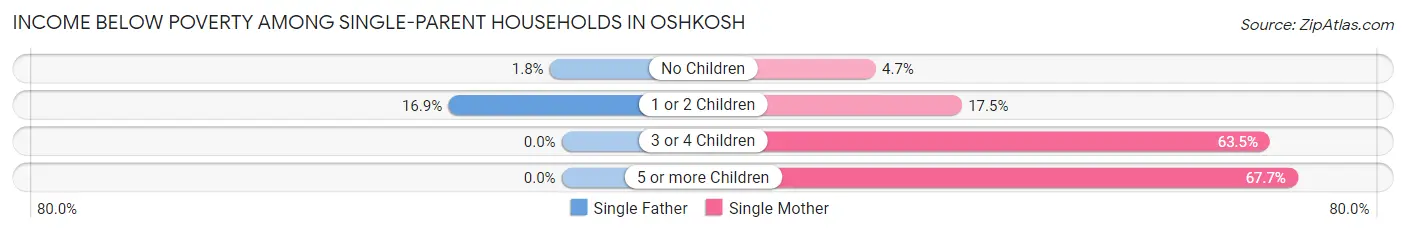
| Children | Single Father | Single Mother |
| No Children | 8 (1.8%) | 29 (4.7%) |
| 1 or 2 Children | 141 (16.9%) | 225 (17.5%) |
| 3 or 4 Children | 0 (0.0%) | 153 (63.5%) |
| 5 or more Children | 0 (0.0%) | 23 (67.6%) |
| Total | 149 (10.8%) | 430 (19.7%) |
Income Below Poverty Among Married-Couple vs Single-Parent Households in Oshkosh
The poverty data for Oshkosh shows that 371 of the married-couple family households (3.8%) and 579 of the single-parent households (16.3%) are living below the poverty level. Within the married-couple family households, those with 3 or 4 children have the highest poverty rate, with 77 households (11.5%) falling below the poverty line. Among the single-parent households, those with 5 or more children have the highest poverty rate, with 23 household (63.9%) living below poverty.
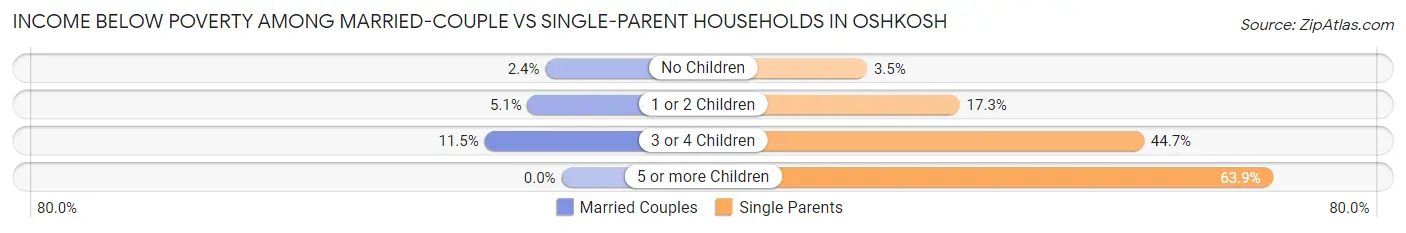
| Children | Married-Couple Families | Single-Parent Households |
| No Children | 145 (2.4%) | 37 (3.5%) |
| 1 or 2 Children | 149 (5.1%) | 366 (17.3%) |
| 3 or 4 Children | 77 (11.5%) | 153 (44.7%) |
| 5 or more Children | 0 (0.0%) | 23 (63.9%) |
| Total | 371 (3.8%) | 579 (16.3%) |
Race in Oshkosh
The most populous races in Oshkosh are White / Caucasian (56,908 | 85.7%), Black / African American (2,944 | 4.4%), and Two or more Races (2,853 | 4.3%).
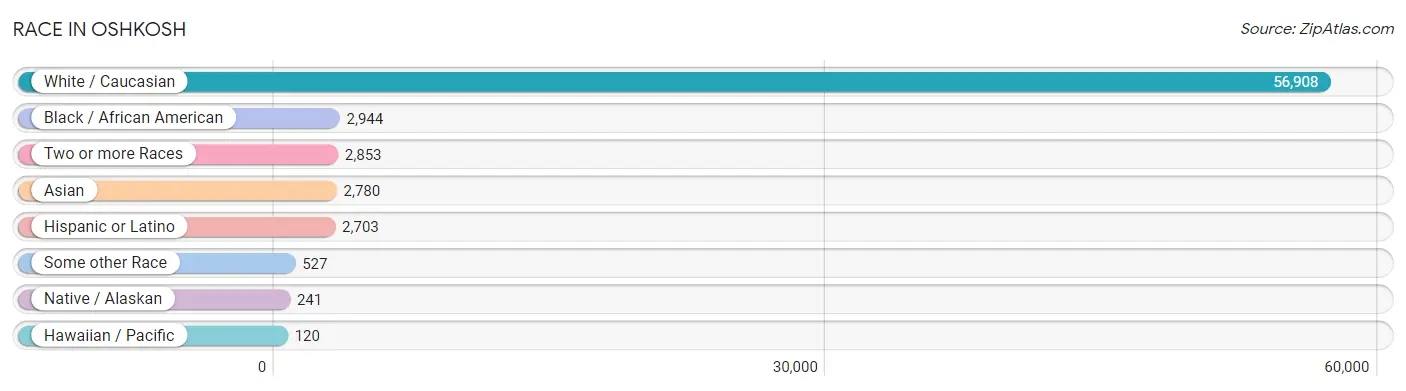
| Race | # Population | % Population |
| Asian | 2,780 | 4.2% |
| Black / African American | 2,944 | 4.4% |
| Hawaiian / Pacific | 120 | 0.2% |
| Hispanic or Latino | 2,703 | 4.1% |
| Native / Alaskan | 241 | 0.4% |
| White / Caucasian | 56,908 | 85.7% |
| Two or more Races | 2,853 | 4.3% |
| Some other Race | 527 | 0.8% |
| Total | 66,373 | 100.0% |
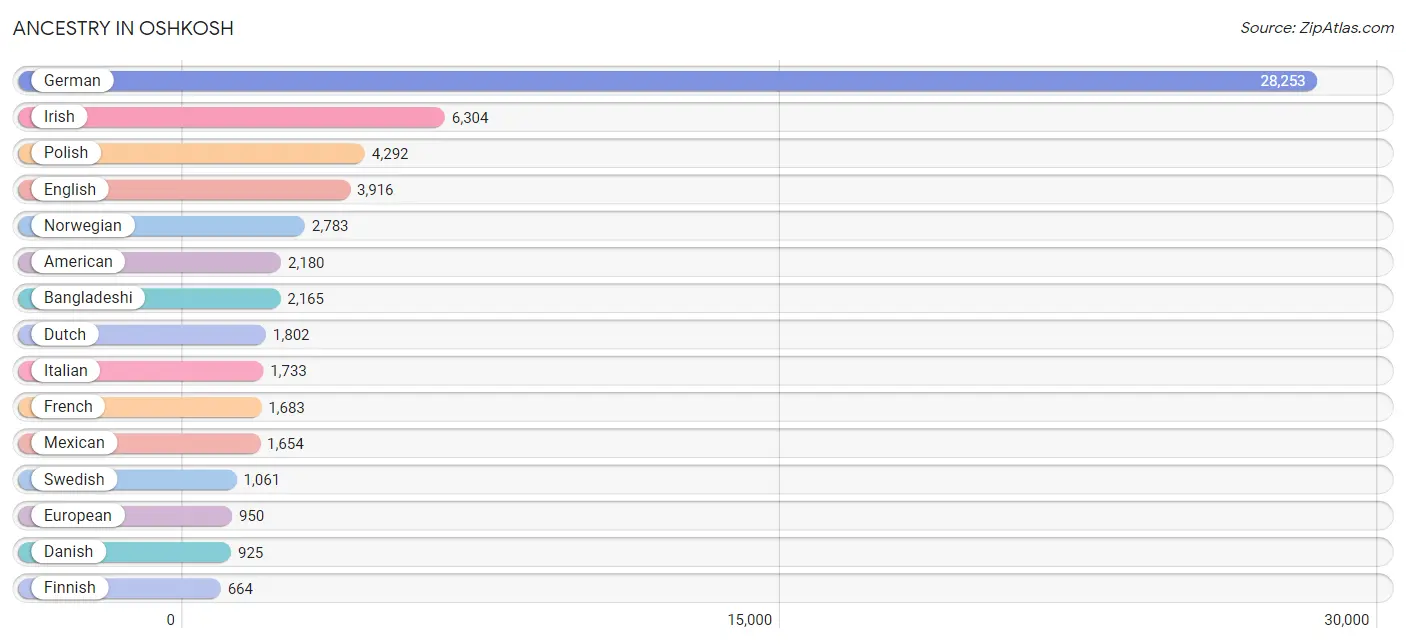
Ancestry in Oshkosh
The most populous ancestries reported in Oshkosh are German (28,253 | 42.6%), Irish (6,304 | 9.5%), Polish (4,292 | 6.5%), English (3,916 | 5.9%), and Norwegian (2,783 | 4.2%), together accounting for 68.6% of all Oshkosh residents.
| Ancestry | # Population | % Population |
| African | 407 | 0.6% |
| Albanian | 5 | 0.0% |
| American | 2,180 | 3.3% |
| Apache | 60 | 0.1% |
| Arab | 342 | 0.5% |
| Armenian | 9 | 0.0% |
| Austrian | 303 | 0.5% |
| Bangladeshi | 2,165 | 3.3% |
| Belgian | 222 | 0.3% |
| Bhutanese | 51 | 0.1% |
| Blackfeet | 59 | 0.1% |
| Brazilian | 15 | 0.0% |
| British | 87 | 0.1% |
| British West Indian | 7 | 0.0% |
| Bulgarian | 5 | 0.0% |
| Burmese | 90 | 0.1% |
| Canadian | 36 | 0.1% |
| Cape Verdean | 28 | 0.0% |
| Celtic | 26 | 0.0% |
| Central American | 35 | 0.1% |
| Central American Indian | 15 | 0.0% |
| Cherokee | 146 | 0.2% |
| Chippewa | 187 | 0.3% |
| Colombian | 71 | 0.1% |
| Cree | 15 | 0.0% |
| Creek | 16 | 0.0% |
| Croatian | 75 | 0.1% |
| Cuban | 36 | 0.1% |
| Czech | 613 | 0.9% |
| Czechoslovakian | 140 | 0.2% |
| Danish | 925 | 1.4% |
| Dutch | 1,802 | 2.7% |
| Eastern European | 77 | 0.1% |
| English | 3,916 | 5.9% |
| European | 950 | 1.4% |
| Finnish | 664 | 1.0% |
| French | 1,683 | 2.5% |
| French American Indian | 4 | 0.0% |
| French Canadian | 390 | 0.6% |
| German | 28,253 | 42.6% |
| German Russian | 1 | 0.0% |
| Greek | 292 | 0.4% |
| Haitian | 3 | 0.0% |
| Hungarian | 145 | 0.2% |
| Icelander | 10 | 0.0% |
| Indian (Asian) | 338 | 0.5% |
| Iranian | 34 | 0.1% |
| Iraqi | 156 | 0.2% |
| Irish | 6,304 | 9.5% |
| Iroquois | 66 | 0.1% |
| Israeli | 21 | 0.0% |
| Italian | 1,733 | 2.6% |
| Korean | 119 | 0.2% |
| Latvian | 36 | 0.1% |
| Lebanese | 7 | 0.0% |
| Lithuanian | 141 | 0.2% |
| Luxembourger | 32 | 0.1% |
| Malaysian | 2 | 0.0% |
| Menominee | 13 | 0.0% |
| Mexican | 1,654 | 2.5% |
| Mexican American Indian | 12 | 0.0% |
| Native Hawaiian | 23 | 0.0% |
| Nicaraguan | 16 | 0.0% |
| Nigerian | 120 | 0.2% |
| Northern European | 44 | 0.1% |
| Norwegian | 2,783 | 4.2% |
| Pakistani | 26 | 0.0% |
| Palestinian | 7 | 0.0% |
| Pennsylvania German | 37 | 0.1% |
| Peruvian | 9 | 0.0% |
| Polish | 4,292 | 6.5% |
| Portuguese | 17 | 0.0% |
| Potawatomi | 22 | 0.0% |
| Puerto Rican | 613 | 0.9% |
| Romanian | 21 | 0.0% |
| Russian | 419 | 0.6% |
| Salvadoran | 19 | 0.0% |
| Scandinavian | 374 | 0.6% |
| Scotch-Irish | 296 | 0.4% |
| Scottish | 535 | 0.8% |
| Serbian | 48 | 0.1% |
| Sierra Leonean | 20 | 0.0% |
| Sioux | 16 | 0.0% |
| Slavic | 46 | 0.1% |
| Slovak | 15 | 0.0% |
| Slovene | 14 | 0.0% |
| South American | 133 | 0.2% |
| South American Indian | 18 | 0.0% |
| Spaniard | 84 | 0.1% |
| Spanish | 24 | 0.0% |
| Sri Lankan | 226 | 0.3% |
| Subsaharan African | 656 | 1.0% |
| Sudanese | 8 | 0.0% |
| Swedish | 1,061 | 1.6% |
| Swiss | 425 | 0.6% |
| Syrian | 124 | 0.2% |
| Thai | 119 | 0.2% |
| Tlingit-Haida | 19 | 0.0% |
| Turkish | 68 | 0.1% |
| Ugandan | 4 | 0.0% |
| Ukrainian | 204 | 0.3% |
| Venezuelan | 53 | 0.1% |
| Welsh | 325 | 0.5% |
| West Indian | 6 | 0.0% |
| Yugoslavian | 36 | 0.1% | View All 105 Rows |
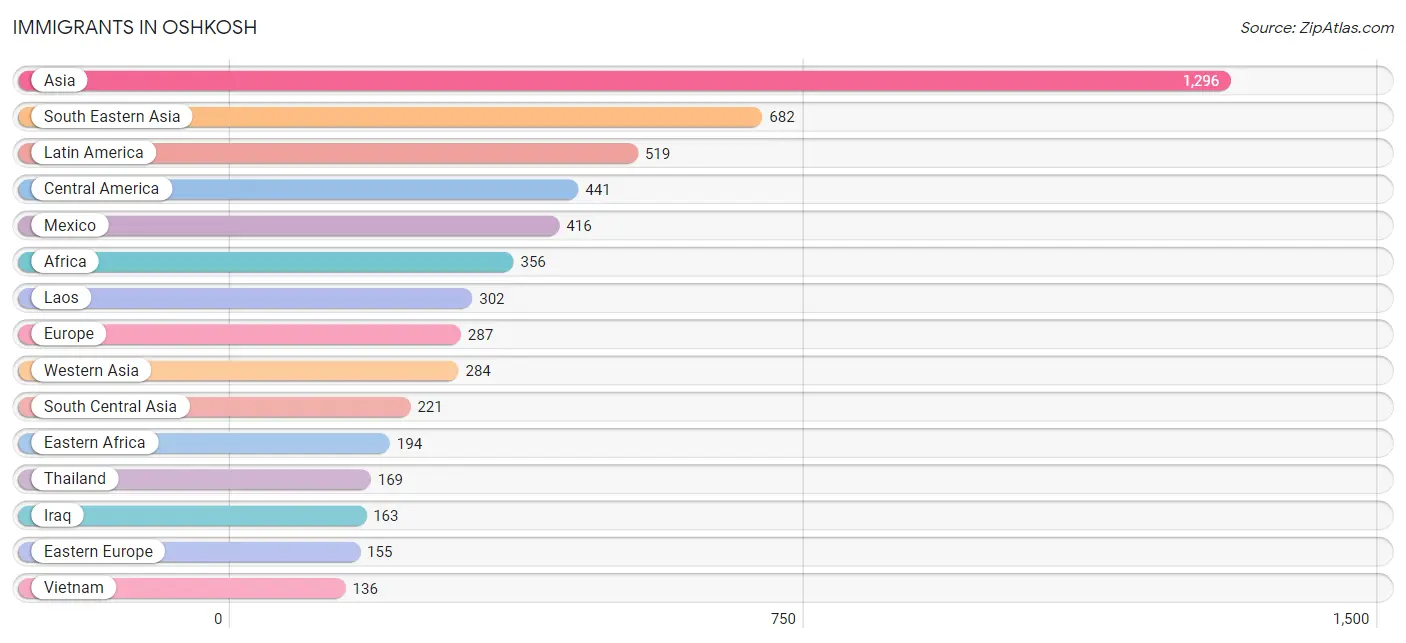
Immigrants in Oshkosh
The most numerous immigrant groups reported in Oshkosh came from Asia (1,296 | 1.9%), South Eastern Asia (682 | 1.0%), Latin America (519 | 0.8%), Central America (441 | 0.7%), and Mexico (416 | 0.6%), together accounting for 5.1% of all Oshkosh residents.
| Immigration Origin | # Population | % Population |
| Africa | 356 | 0.5% |
| Albania | 5 | 0.0% |
| Argentina | 18 | 0.0% |
| Asia | 1,296 | 1.9% |
| Bahamas | 10 | 0.0% |
| Belarus | 15 | 0.0% |
| Bosnia and Herzegovina | 49 | 0.1% |
| Brazil | 15 | 0.0% |
| Canada | 46 | 0.1% |
| Caribbean | 25 | 0.0% |
| Central America | 441 | 0.7% |
| China | 61 | 0.1% |
| Colombia | 20 | 0.0% |
| Cuba | 9 | 0.0% |
| Denmark | 7 | 0.0% |
| Eastern Africa | 194 | 0.3% |
| Eastern Asia | 109 | 0.2% |
| Eastern Europe | 155 | 0.2% |
| Europe | 287 | 0.4% |
| Germany | 51 | 0.1% |
| India | 69 | 0.1% |
| Iran | 13 | 0.0% |
| Iraq | 163 | 0.3% |
| Ireland | 11 | 0.0% |
| Kenya | 47 | 0.1% |
| Korea | 48 | 0.1% |
| Laos | 302 | 0.5% |
| Latin America | 519 | 0.8% |
| Latvia | 15 | 0.0% |
| Mexico | 416 | 0.6% |
| Micronesia | 67 | 0.1% |
| Middle Africa | 112 | 0.2% |
| Netherlands | 26 | 0.0% |
| Nicaragua | 25 | 0.0% |
| Nigeria | 23 | 0.0% |
| Northern Europe | 32 | 0.1% |
| Oceania | 67 | 0.1% |
| Pakistan | 122 | 0.2% |
| Philippines | 75 | 0.1% |
| Poland | 7 | 0.0% |
| Russia | 36 | 0.1% |
| Saudi Arabia | 4 | 0.0% |
| Scotland | 11 | 0.0% |
| Serbia | 18 | 0.0% |
| Sierra Leone | 19 | 0.0% |
| South America | 53 | 0.1% |
| South Central Asia | 221 | 0.3% |
| South Eastern Asia | 682 | 1.0% |
| Southern Europe | 23 | 0.0% |
| Spain | 23 | 0.0% |
| Sweden | 3 | 0.0% |
| Syria | 117 | 0.2% |
| Taiwan | 28 | 0.0% |
| Thailand | 169 | 0.3% |
| Trinidad and Tobago | 6 | 0.0% |
| Uganda | 19 | 0.0% |
| Vietnam | 136 | 0.2% |
| Western Africa | 50 | 0.1% |
| Western Asia | 284 | 0.4% |
| Western Europe | 77 | 0.1% |
| Zaire | 112 | 0.2% | View All 61 Rows |
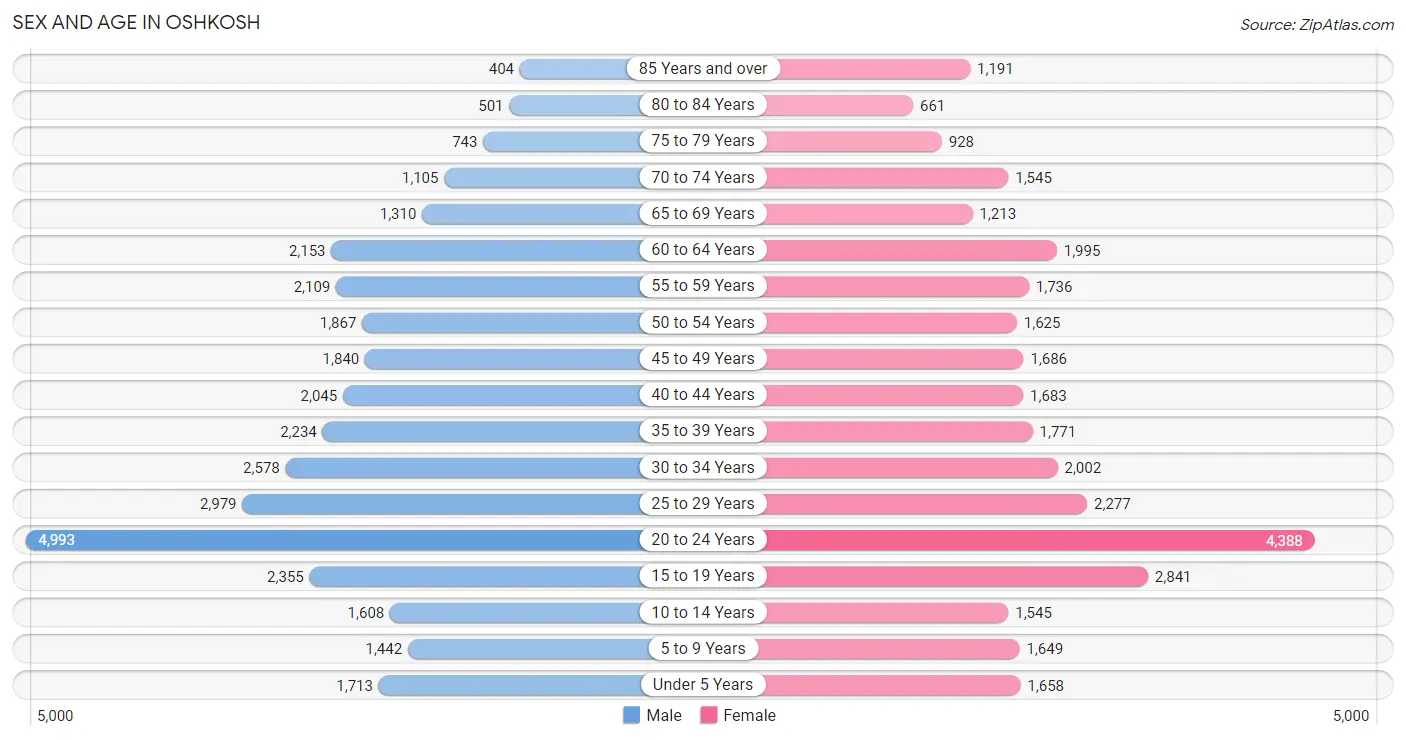
Sex and Age in Oshkosh
Sex and Age in Oshkosh
The most populous age groups in Oshkosh are 20 to 24 Years (4,993 | 14.7%) for men and 20 to 24 Years (4,388 | 13.6%) for women.
| Age Bracket | Male | Female |
| Under 5 Years | 1,713 (5.0%) | 1,658 (5.1%) |
| 5 to 9 Years | 1,442 (4.2%) | 1,649 (5.1%) |
| 10 to 14 Years | 1,608 (4.7%) | 1,545 (4.8%) |
| 15 to 19 Years | 2,355 (6.9%) | 2,841 (8.8%) |
| 20 to 24 Years | 4,993 (14.7%) | 4,388 (13.6%) |
| 25 to 29 Years | 2,979 (8.8%) | 2,277 (7.0%) |
| 30 to 34 Years | 2,578 (7.6%) | 2,002 (6.2%) |
| 35 to 39 Years | 2,234 (6.6%) | 1,771 (5.5%) |
| 40 to 44 Years | 2,045 (6.0%) | 1,683 (5.2%) |
| 45 to 49 Years | 1,840 (5.4%) | 1,686 (5.2%) |
| 50 to 54 Years | 1,867 (5.5%) | 1,625 (5.0%) |
| 55 to 59 Years | 2,109 (6.2%) | 1,736 (5.4%) |
| 60 to 64 Years | 2,153 (6.3%) | 1,995 (6.2%) |
| 65 to 69 Years | 1,310 (3.9%) | 1,213 (3.7%) |
| 70 to 74 Years | 1,105 (3.3%) | 1,545 (4.8%) |
| 75 to 79 Years | 743 (2.2%) | 928 (2.9%) |
| 80 to 84 Years | 501 (1.5%) | 661 (2.0%) |
| 85 Years and over | 404 (1.2%) | 1,191 (3.7%) |
| Total | 33,979 (100.0%) | 32,394 (100.0%) |
Families and Households in Oshkosh
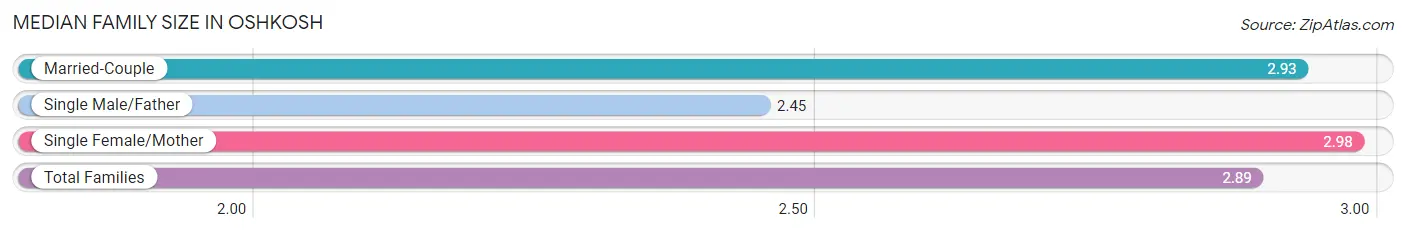
Median Family Size in Oshkosh
The median family size in Oshkosh is 2.89 persons per family, with single female/mother families (2,179 | 16.4%) accounting for the largest median family size of 2.98 persons per family. On the other hand, single male/father families (1,384 | 10.4%) represent the smallest median family size with 2.45 persons per family.
| Family Type | # Families | Family Size |
| Married-Couple | 9,700 (73.1%) | 2.93 |
| Single Male/Father | 1,384 (10.4%) | 2.45 |
| Single Female/Mother | 2,179 (16.4%) | 2.98 |
| Total Families | 13,263 (100.0%) | 2.89 |
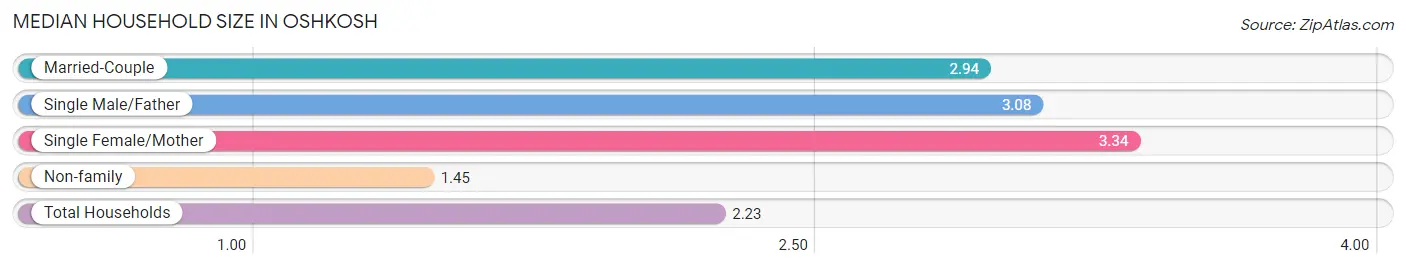
Median Household Size in Oshkosh
The median household size in Oshkosh is 2.23 persons per household, with single female/mother households (2,179 | 8.1%) accounting for the largest median household size of 3.34 persons per household. non-family households (13,500 | 50.4%) represent the smallest median household size with 1.45 persons per household.
| Household Type | # Households | Household Size |
| Married-Couple | 9,700 (36.2%) | 2.94 |
| Single Male/Father | 1,384 (5.2%) | 3.08 |
| Single Female/Mother | 2,179 (8.1%) | 3.34 |
| Non-family | 13,500 (50.4%) | 1.45 |
| Total Households | 26,763 (100.0%) | 2.23 |
Household Size by Marriage Status in Oshkosh
Out of a total of 26,763 households in Oshkosh, 13,263 (49.6%) are family households, while 13,500 (50.4%) are nonfamily households. The most numerous type of family households are 2-person households, comprising 6,566, and the most common type of nonfamily households are 1-person households, comprising 9,512.
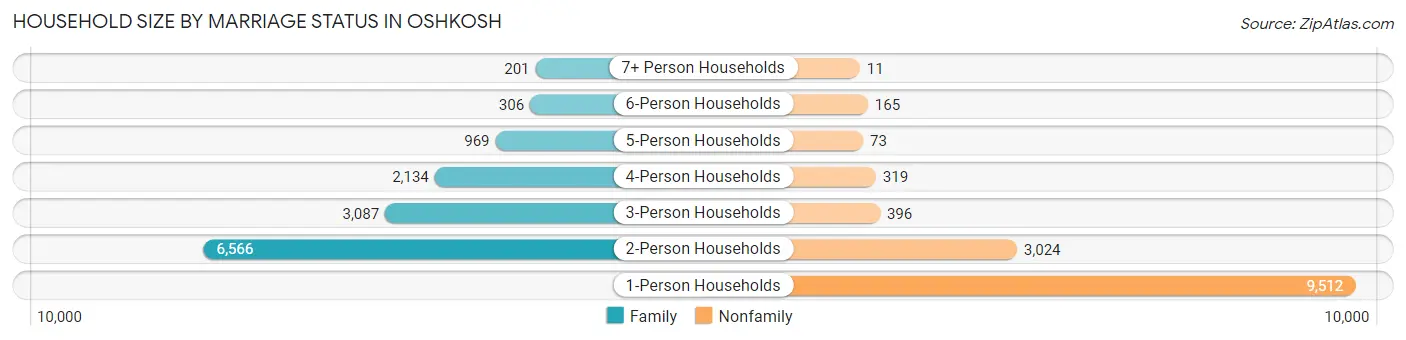
| Household Size | Family Households | Nonfamily Households |
| 1-Person Households | - | 9,512 (35.5%) |
| 2-Person Households | 6,566 (24.5%) | 3,024 (11.3%) |
| 3-Person Households | 3,087 (11.5%) | 396 (1.5%) |
| 4-Person Households | 2,134 (8.0%) | 319 (1.2%) |
| 5-Person Households | 969 (3.6%) | 73 (0.3%) |
| 6-Person Households | 306 (1.1%) | 165 (0.6%) |
| 7+ Person Households | 201 (0.7%) | 11 (0.0%) |
| Total | 13,263 (49.6%) | 13,500 (50.4%) |
Female Fertility in Oshkosh
Fertility by Age in Oshkosh
Average fertility rate in Oshkosh is 49.0 births per 1,000 women. Women in the age bracket of 20 to 34 years have the highest fertility rate with 75.0 births per 1,000 women. Women in the age bracket of 20 to 34 years acount for 77.4% of all women with births.
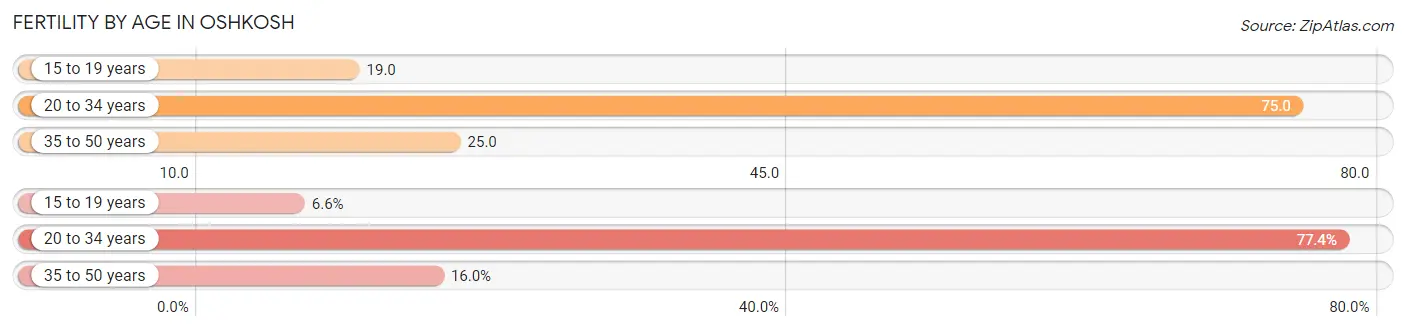
| Age Bracket | Women with Births | Births / 1,000 Women |
| 15 to 19 years | 55 (6.6%) | 19.0 |
| 20 to 34 years | 648 (77.4%) | 75.0 |
| 35 to 50 years | 134 (16.0%) | 25.0 |
| Total | 837 (100.0%) | 49.0 |
Fertility by Age by Marriage Status in Oshkosh
49.8% of women with births (837) in Oshkosh are married. The highest percentage of unmarried women with births falls into 15 to 19 years age bracket with 100.0% of them unmarried at the time of birth, while the lowest percentage of unmarried women with births belong to 35 to 50 years age bracket with 37.3% of them unmarried.
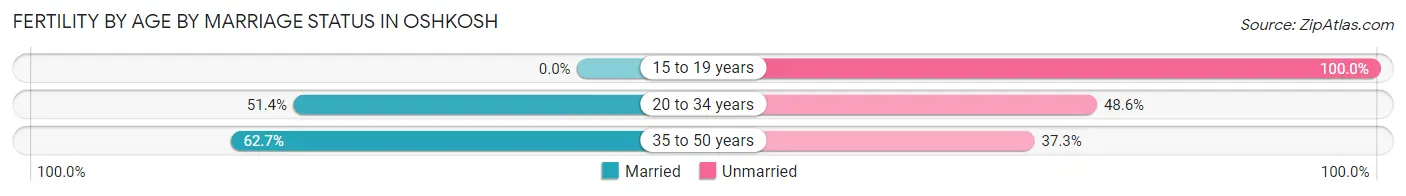
| Age Bracket | Married | Unmarried |
| 15 to 19 years | 0 (0.0%) | 55 (100.0%) |
| 20 to 34 years | 333 (51.4%) | 315 (48.6%) |
| 35 to 50 years | 84 (62.7%) | 50 (37.3%) |
| Total | 417 (49.8%) | 420 (50.2%) |
Fertility by Education in Oshkosh
Average fertility rate in Oshkosh is 49.0 births per 1,000 women. Women with the education attainment of high school diploma have the highest fertility rate of 87.0 births per 1,000 women, while women with the education attainment of less than high school have the lowest fertility at 10.0 births per 1,000 women. Women with the education attainment of high school diploma represent 46.5% of all women with births.
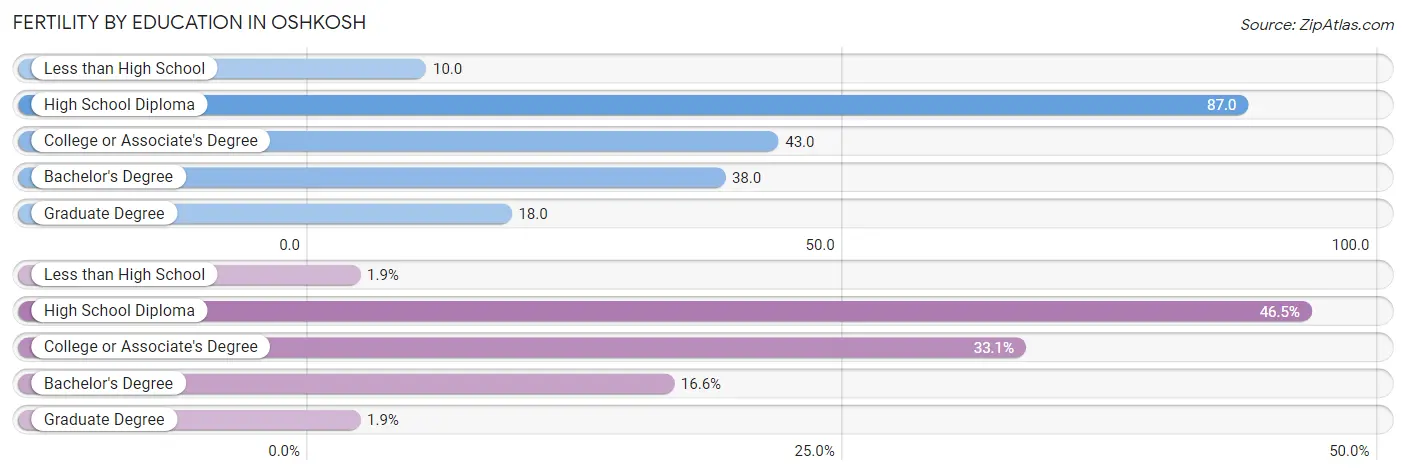
| Educational Attainment | Women with Births | Births / 1,000 Women |
| Less than High School | 16 (1.9%) | 10.0 |
| High School Diploma | 389 (46.5%) | 87.0 |
| College or Associate's Degree | 277 (33.1%) | 43.0 |
| Bachelor's Degree | 139 (16.6%) | 38.0 |
| Graduate Degree | 16 (1.9%) | 18.0 |
| Total | 837 (100.0%) | 49.0 |
Fertility by Education by Marriage Status in Oshkosh
50.2% of women with births in Oshkosh are unmarried. Women with the educational attainment of graduate degree are most likely to be married with 100.0% of them married at childbirth, while women with the educational attainment of high school diploma are least likely to be married with 71.7% of them unmarried at childbirth.
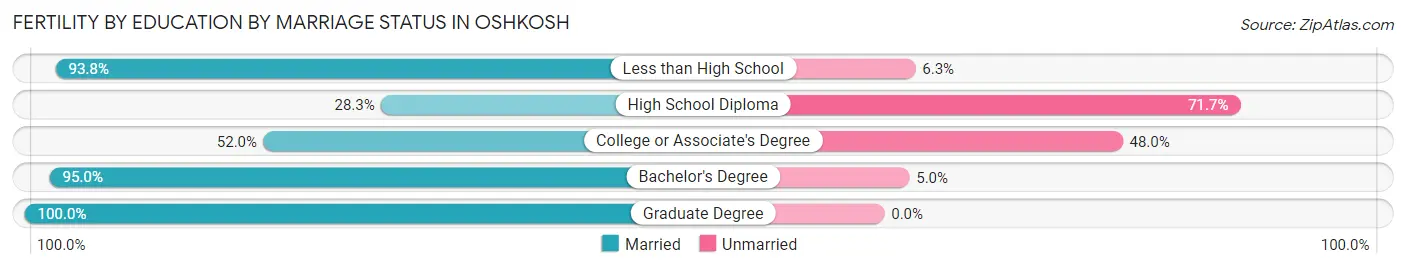
| Educational Attainment | Married | Unmarried |
| Less than High School | 15 (93.8%) | 1 (6.2%) |
| High School Diploma | 110 (28.3%) | 279 (71.7%) |
| College or Associate's Degree | 144 (52.0%) | 133 (48.0%) |
| Bachelor's Degree | 132 (95.0%) | 7 (5.0%) |
| Graduate Degree | 16 (100.0%) | 0 (0.0%) |
| Total | 417 (49.8%) | 420 (50.2%) |
Employment Characteristics in Oshkosh
Employment by Class of Employer in Oshkosh
Among the 34,075 employed individuals in Oshkosh, private company employees (24,390 | 71.6%), not-for-profit organizations (3,135 | 9.2%), and state government employees (2,459 | 7.2%) make up the most common classes of employment.
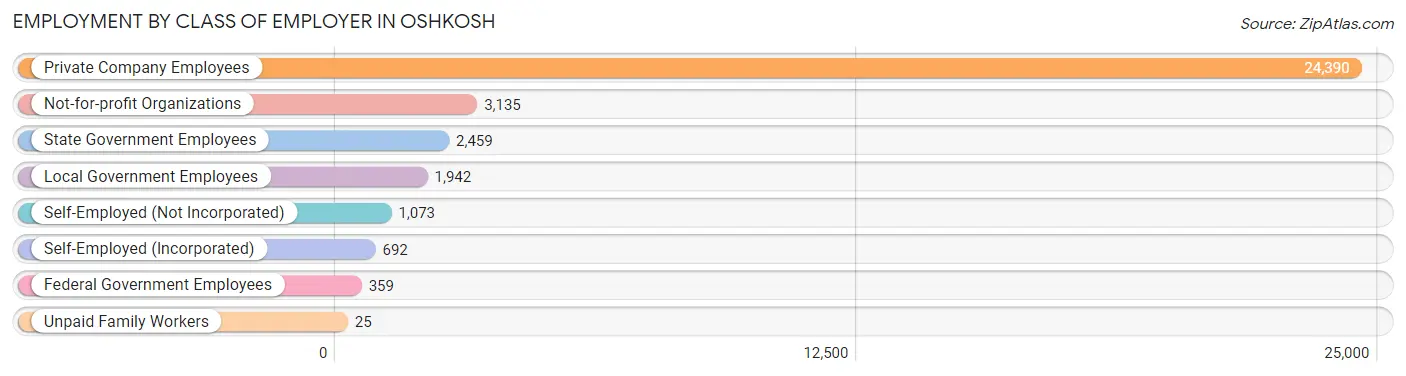
| Employer Class | # Employees | % Employees |
| Private Company Employees | 24,390 | 71.6% |
| Self-Employed (Incorporated) | 692 | 2.0% |
| Self-Employed (Not Incorporated) | 1,073 | 3.2% |
| Not-for-profit Organizations | 3,135 | 9.2% |
| Local Government Employees | 1,942 | 5.7% |
| State Government Employees | 2,459 | 7.2% |
| Federal Government Employees | 359 | 1.1% |
| Unpaid Family Workers | 25 | 0.1% |
| Total | 34,075 | 100.0% |
Employment Status by Age in Oshkosh
According to the labor force statistics for Oshkosh, out of the total population over 16 years of age (55,999), 64.2% or 35,951 individuals are in the labor force, with 2.9% or 1,043 of them unemployed. The age group with the highest labor force participation rate is 20 to 24 years, with 82.6% or 7,749 individuals in the labor force. Within the labor force, the 65 to 74 years age range has the highest percentage of unemployed individuals, with 9.7% or 111 of them being unemployed.
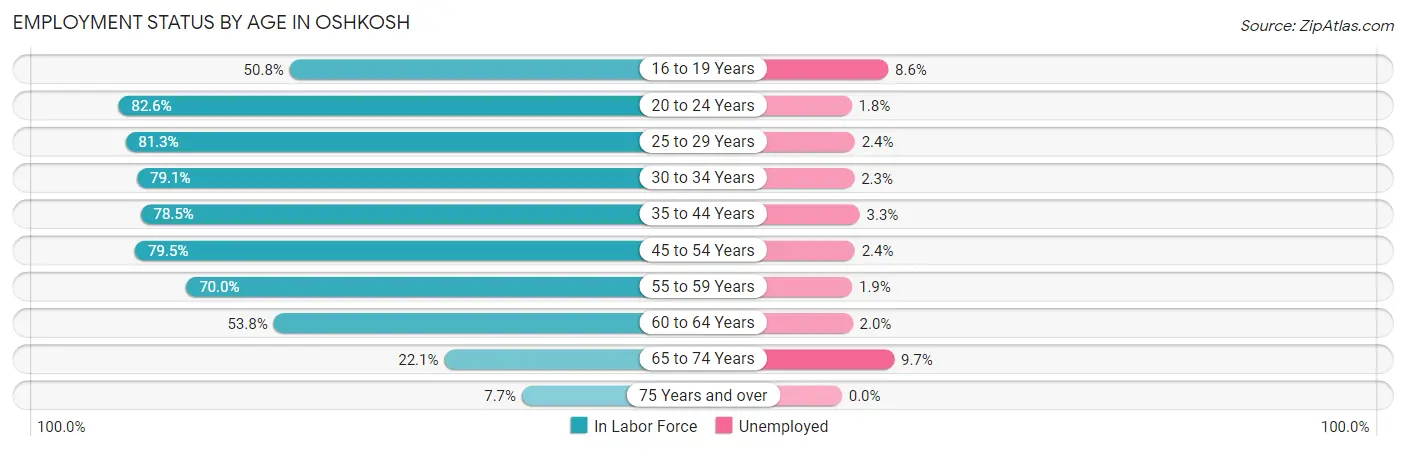
| Age Bracket | In Labor Force | Unemployed |
| 16 to 19 Years | 2,254 (50.8%) | 194 (8.6%) |
| 20 to 24 Years | 7,749 (82.6%) | 139 (1.8%) |
| 25 to 29 Years | 4,273 (81.3%) | 103 (2.4%) |
| 30 to 34 Years | 3,623 (79.1%) | 83 (2.3%) |
| 35 to 44 Years | 6,070 (78.5%) | 200 (3.3%) |
| 45 to 54 Years | 5,579 (79.5%) | 134 (2.4%) |
| 55 to 59 Years | 2,692 (70.0%) | 51 (1.9%) |
| 60 to 64 Years | 2,232 (53.8%) | 45 (2.0%) |
| 65 to 74 Years | 1,143 (22.1%) | 111 (9.7%) |
| 75 Years and over | 341 (7.7%) | 0 (0.0%) |
| Total | 35,951 (64.2%) | 1,043 (2.9%) |
Employment Status by Educational Attainment in Oshkosh
According to labor force statistics for Oshkosh, 75.1% of individuals (24,468) out of the total population between 25 and 64 years of age (32,580) are in the labor force, with 2.5% or 612 of them being unemployed. The group with the highest labor force participation rate are those with the educational attainment of bachelor's degree or higher, with 86.1% or 8,047 individuals in the labor force. Within the labor force, individuals with high school diploma education have the highest percentage of unemployment, with 3.7% or 257 of them being unemployed.
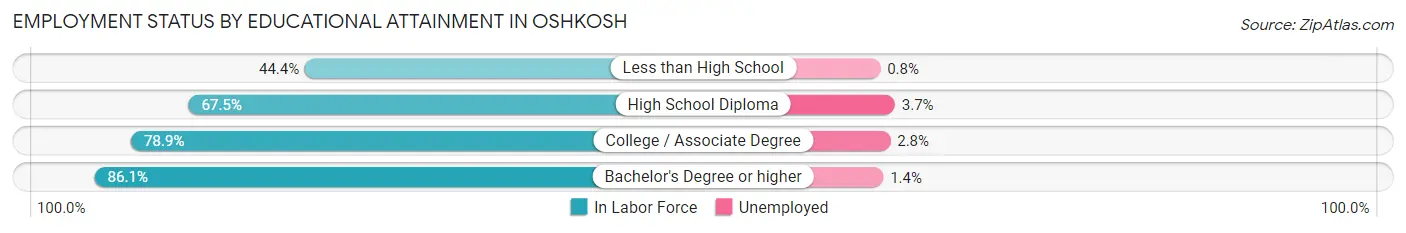
| Educational Attainment | In Labor Force | Unemployed |
| Less than High School | 946 (44.4%) | 17 (0.8%) |
| High School Diploma | 6,934 (67.5%) | 380 (3.7%) |
| College / Associate Degree | 8,546 (78.9%) | 303 (2.8%) |
| Bachelor's Degree or higher | 8,047 (86.1%) | 131 (1.4%) |
| Total | 24,468 (75.1%) | 814 (2.5%) |
Employment Occupations by Sex in Oshkosh
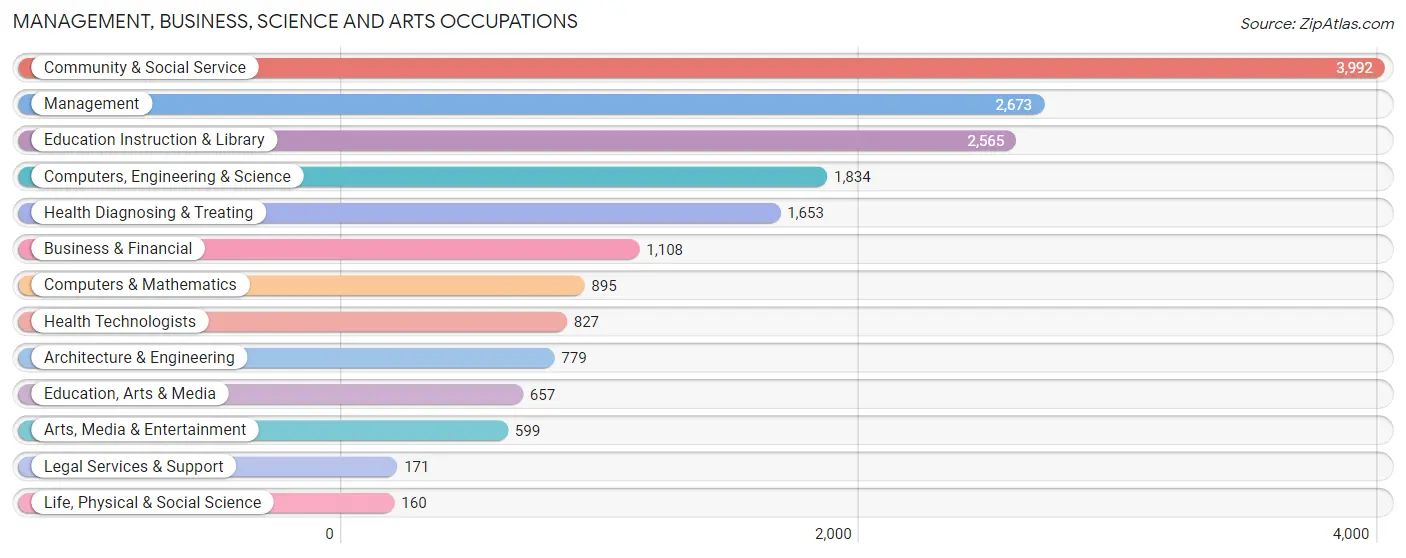
Management, Business, Science and Arts Occupations
The most common Management, Business, Science and Arts occupations in Oshkosh are Community & Social Service (3,992 | 11.4%), Management (2,673 | 7.7%), Education Instruction & Library (2,565 | 7.3%), Computers, Engineering & Science (1,834 | 5.3%), and Health Diagnosing & Treating (1,653 | 4.7%).
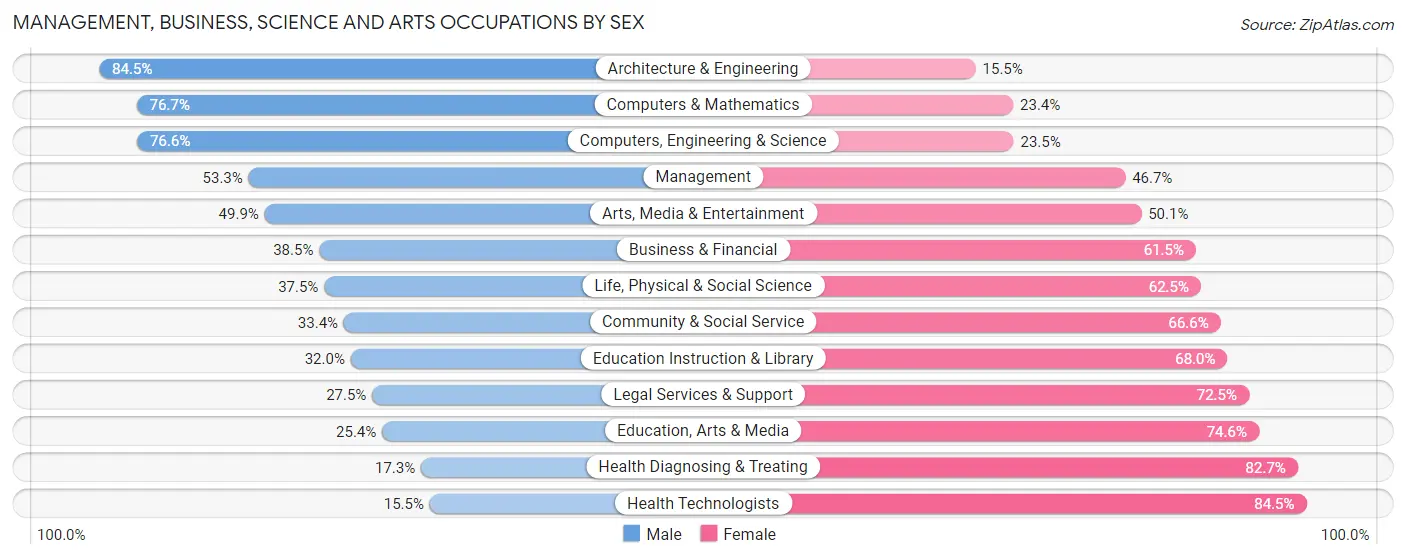
Management, Business, Science and Arts Occupations by Sex
Within the Management, Business, Science and Arts occupations in Oshkosh, the most male-oriented occupations are Architecture & Engineering (84.5%), Computers & Mathematics (76.6%), and Computers, Engineering & Science (76.5%), while the most female-oriented occupations are Health Technologists (84.5%), Health Diagnosing & Treating (82.7%), and Education, Arts & Media (74.6%).
| Occupation | Male | Female |
| Management | 1,424 (53.3%) | 1,249 (46.7%) |
| Business & Financial | 427 (38.5%) | 681 (61.5%) |
| Computers, Engineering & Science | 1,404 (76.5%) | 430 (23.4%) |
| Computers & Mathematics | 686 (76.6%) | 209 (23.4%) |
| Architecture & Engineering | 658 (84.5%) | 121 (15.5%) |
| Life, Physical & Social Science | 60 (37.5%) | 100 (62.5%) |
| Community & Social Service | 1,333 (33.4%) | 2,659 (66.6%) |
| Education, Arts & Media | 167 (25.4%) | 490 (74.6%) |
| Legal Services & Support | 47 (27.5%) | 124 (72.5%) |
| Education Instruction & Library | 820 (32.0%) | 1,745 (68.0%) |
| Arts, Media & Entertainment | 299 (49.9%) | 300 (50.1%) |
| Health Diagnosing & Treating | 286 (17.3%) | 1,367 (82.7%) |
| Health Technologists | 128 (15.5%) | 699 (84.5%) |
| Total (Category) | 4,874 (43.3%) | 6,386 (56.7%) |
| Total (Overall) | 18,297 (52.4%) | 16,592 (47.6%) |
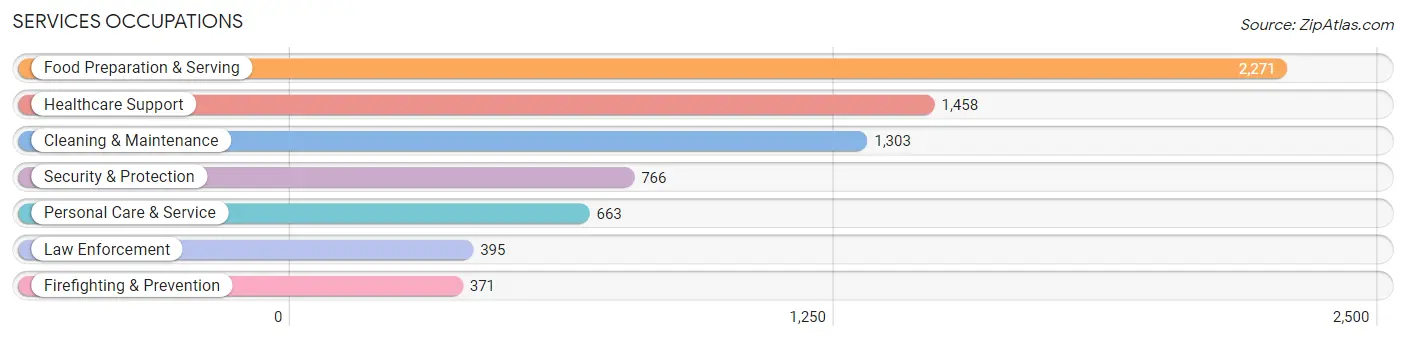
Services Occupations
The most common Services occupations in Oshkosh are Food Preparation & Serving (2,271 | 6.5%), Healthcare Support (1,458 | 4.2%), Cleaning & Maintenance (1,303 | 3.7%), Security & Protection (766 | 2.2%), and Personal Care & Service (663 | 1.9%).
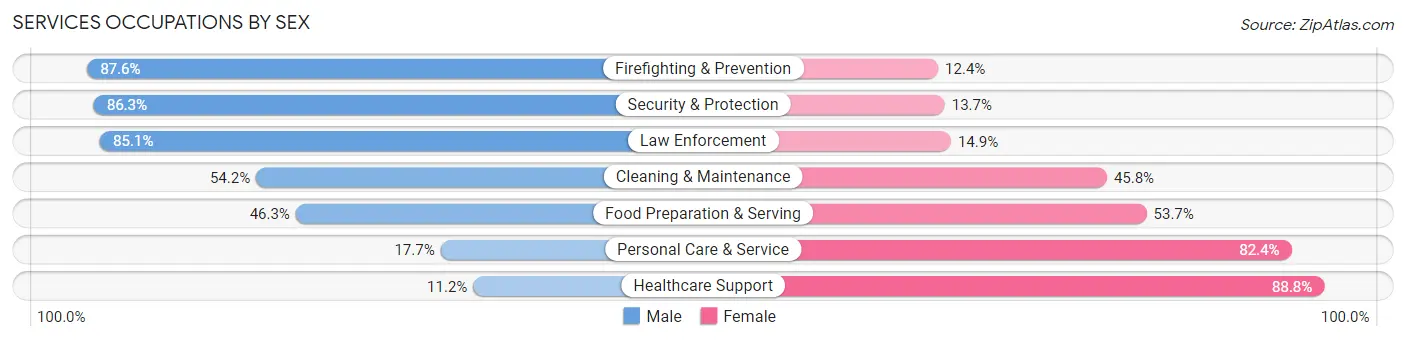
Services Occupations by Sex
Within the Services occupations in Oshkosh, the most male-oriented occupations are Firefighting & Prevention (87.6%), Security & Protection (86.3%), and Law Enforcement (85.1%), while the most female-oriented occupations are Healthcare Support (88.8%), Personal Care & Service (82.4%), and Food Preparation & Serving (53.7%).
| Occupation | Male | Female |
| Healthcare Support | 163 (11.2%) | 1,295 (88.8%) |
| Security & Protection | 661 (86.3%) | 105 (13.7%) |
| Firefighting & Prevention | 325 (87.6%) | 46 (12.4%) |
| Law Enforcement | 336 (85.1%) | 59 (14.9%) |
| Food Preparation & Serving | 1,052 (46.3%) | 1,219 (53.7%) |
| Cleaning & Maintenance | 706 (54.2%) | 597 (45.8%) |
| Personal Care & Service | 117 (17.6%) | 546 (82.4%) |
| Total (Category) | 2,699 (41.8%) | 3,762 (58.2%) |
| Total (Overall) | 18,297 (52.4%) | 16,592 (47.6%) |
Sales and Office Occupations
The most common Sales and Office occupations in Oshkosh are Sales & Related (3,842 | 11.0%), and Office & Administration (3,719 | 10.7%).

Sales and Office Occupations by Sex

| Occupation | Male | Female |
| Sales & Related | 1,739 (45.3%) | 2,103 (54.7%) |
| Office & Administration | 1,236 (33.2%) | 2,483 (66.8%) |
| Total (Category) | 2,975 (39.4%) | 4,586 (60.7%) |
| Total (Overall) | 18,297 (52.4%) | 16,592 (47.6%) |
Natural Resources, Construction and Maintenance Occupations
The most common Natural Resources, Construction and Maintenance occupations in Oshkosh are Construction & Extraction (1,080 | 3.1%), Installation, Maintenance & Repair (807 | 2.3%), and Farming, Fishing & Forestry (21 | 0.1%).
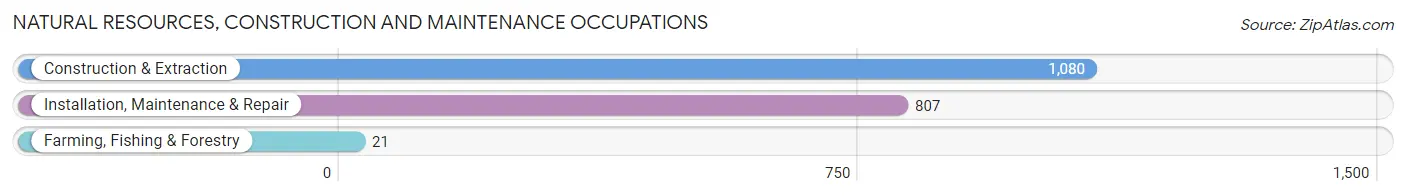
Natural Resources, Construction and Maintenance Occupations by Sex

| Occupation | Male | Female |
| Farming, Fishing & Forestry | 17 (80.9%) | 4 (19.1%) |
| Construction & Extraction | 964 (89.3%) | 116 (10.7%) |
| Installation, Maintenance & Repair | 643 (79.7%) | 164 (20.3%) |
| Total (Category) | 1,624 (85.1%) | 284 (14.9%) |
| Total (Overall) | 18,297 (52.4%) | 16,592 (47.6%) |
Production, Transportation and Moving Occupations
The most common Production, Transportation and Moving occupations in Oshkosh are Production (4,079 | 11.7%), Material Moving (2,506 | 7.2%), and Transportation (1,114 | 3.2%).
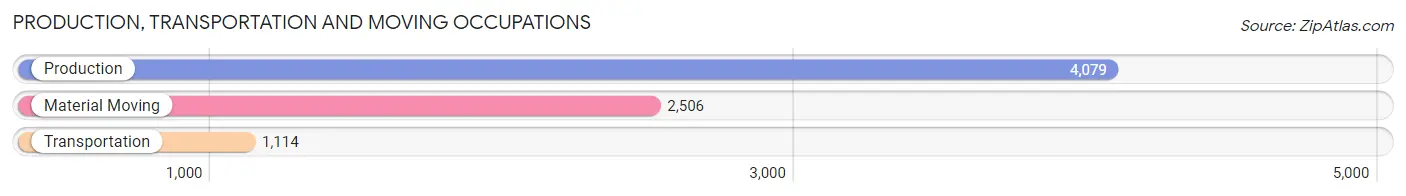
Production, Transportation and Moving Occupations by Sex
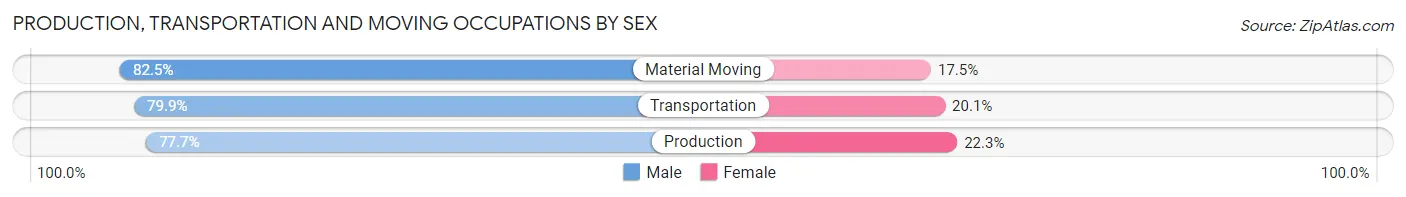
| Occupation | Male | Female |
| Production | 3,168 (77.7%) | 911 (22.3%) |
| Transportation | 890 (79.9%) | 224 (20.1%) |
| Material Moving | 2,067 (82.5%) | 439 (17.5%) |
| Total (Category) | 6,125 (79.6%) | 1,574 (20.4%) |
| Total (Overall) | 18,297 (52.4%) | 16,592 (47.6%) |
Employment Industries by Sex in Oshkosh
Employment Industries in Oshkosh
The major employment industries in Oshkosh include Manufacturing (7,291 | 20.9%), Retail Trade (5,146 | 14.7%), Health Care & Social Assistance (4,735 | 13.6%), Educational Services (3,156 | 9.0%), and Accommodation & Food Services (2,923 | 8.4%).
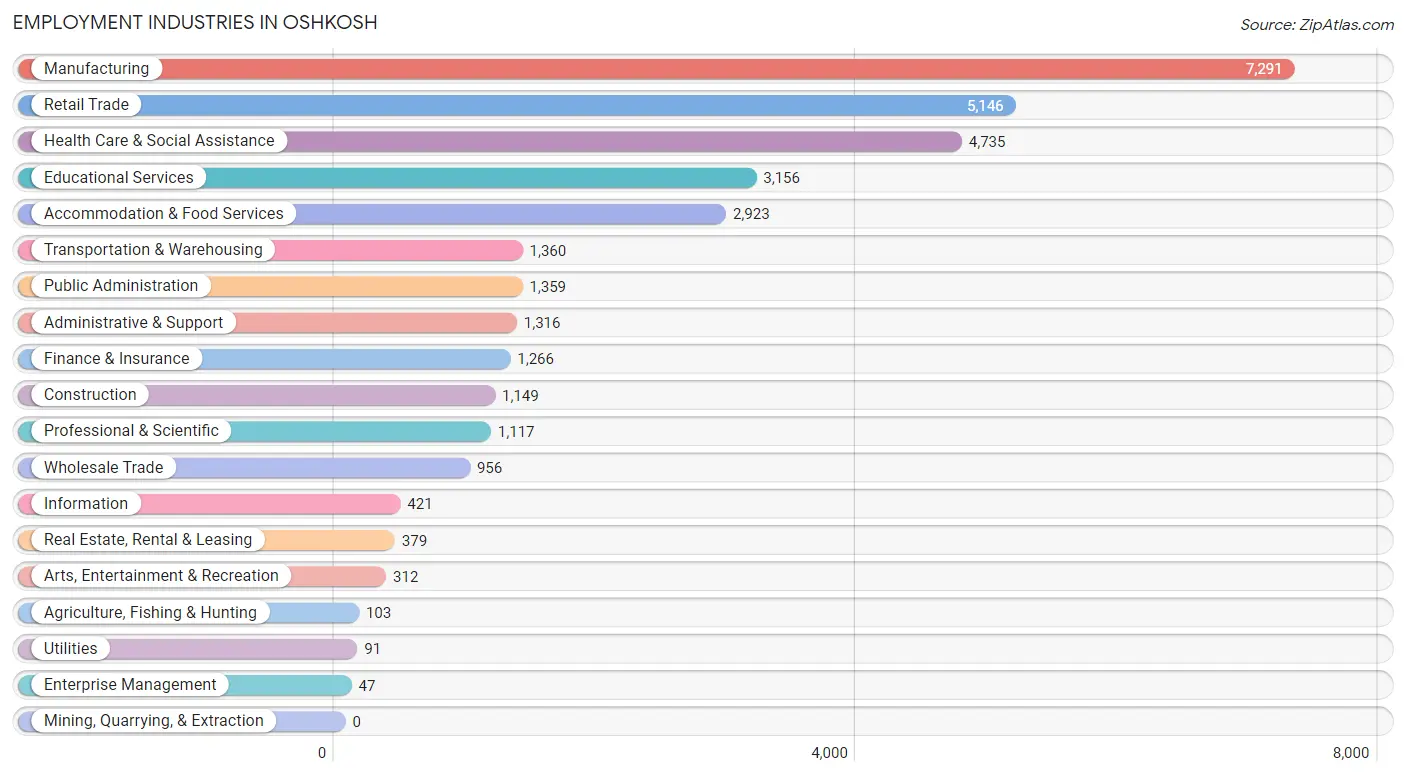
Employment Industries by Sex in Oshkosh
The Oshkosh industries that see more men than women are Utilities (100.0%), Construction (89.7%), and Transportation & Warehousing (83.6%), whereas the industries that tend to have a higher number of women are Health Care & Social Assistance (83.1%), Finance & Insurance (66.5%), and Educational Services (62.3%).
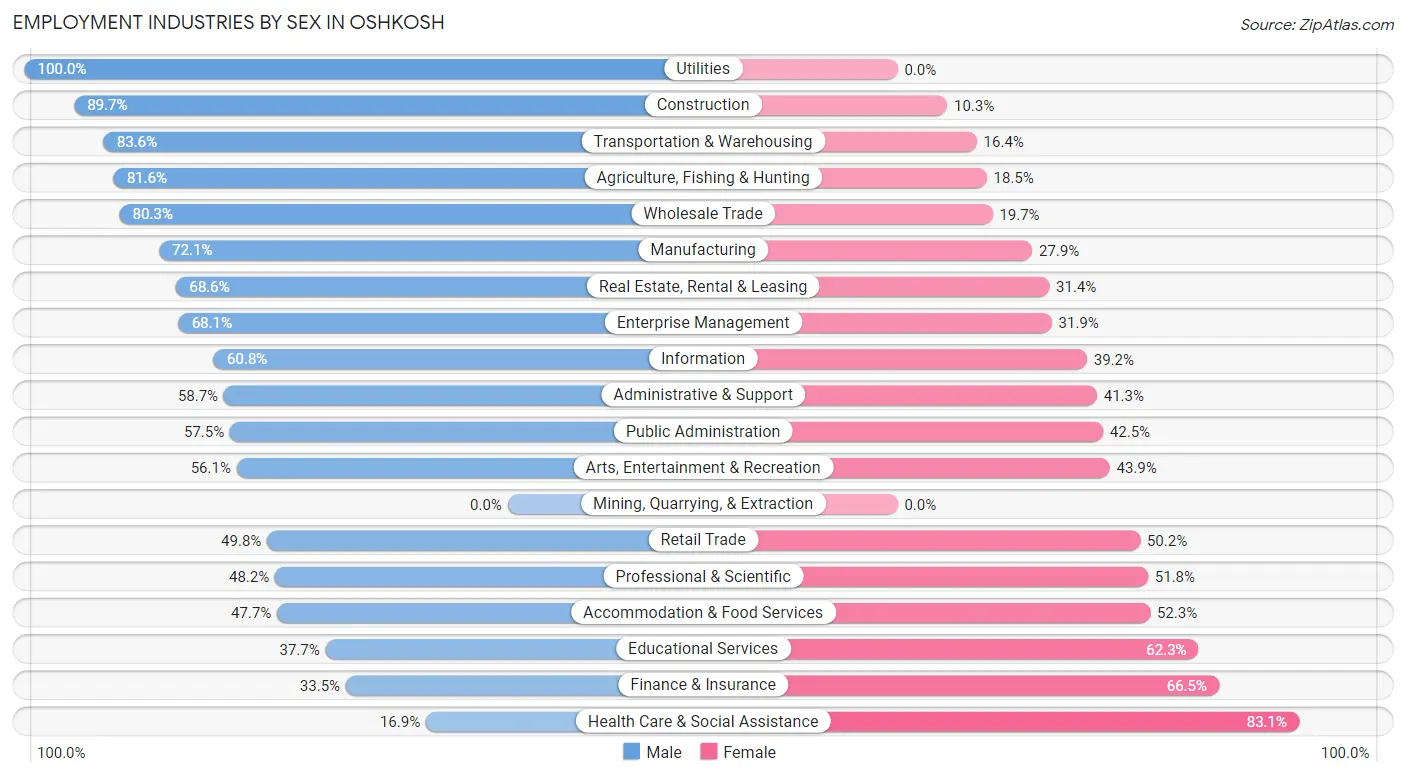
| Industry | Male | Female |
| Agriculture, Fishing & Hunting | 84 (81.6%) | 19 (18.4%) |
| Mining, Quarrying, & Extraction | 0 (0.0%) | 0 (0.0%) |
| Construction | 1,031 (89.7%) | 118 (10.3%) |
| Manufacturing | 5,260 (72.1%) | 2,031 (27.9%) |
| Wholesale Trade | 768 (80.3%) | 188 (19.7%) |
| Retail Trade | 2,562 (49.8%) | 2,584 (50.2%) |
| Transportation & Warehousing | 1,137 (83.6%) | 223 (16.4%) |
| Utilities | 91 (100.0%) | 0 (0.0%) |
| Information | 256 (60.8%) | 165 (39.2%) |
| Finance & Insurance | 424 (33.5%) | 842 (66.5%) |
| Real Estate, Rental & Leasing | 260 (68.6%) | 119 (31.4%) |
| Professional & Scientific | 538 (48.2%) | 579 (51.8%) |
| Enterprise Management | 32 (68.1%) | 15 (31.9%) |
| Administrative & Support | 773 (58.7%) | 543 (41.3%) |
| Educational Services | 1,190 (37.7%) | 1,966 (62.3%) |
| Health Care & Social Assistance | 801 (16.9%) | 3,934 (83.1%) |
| Arts, Entertainment & Recreation | 175 (56.1%) | 137 (43.9%) |
| Accommodation & Food Services | 1,395 (47.7%) | 1,528 (52.3%) |
| Public Administration | 781 (57.5%) | 578 (42.5%) |
| Total | 18,297 (52.4%) | 16,592 (47.6%) |
Education in Oshkosh
School Enrollment in Oshkosh
The most common levels of schooling among the 17,520 students in Oshkosh are college / undergraduate (8,416 | 48.0%), elementary school (2,552 | 14.6%), and high school (2,520 | 14.4%).
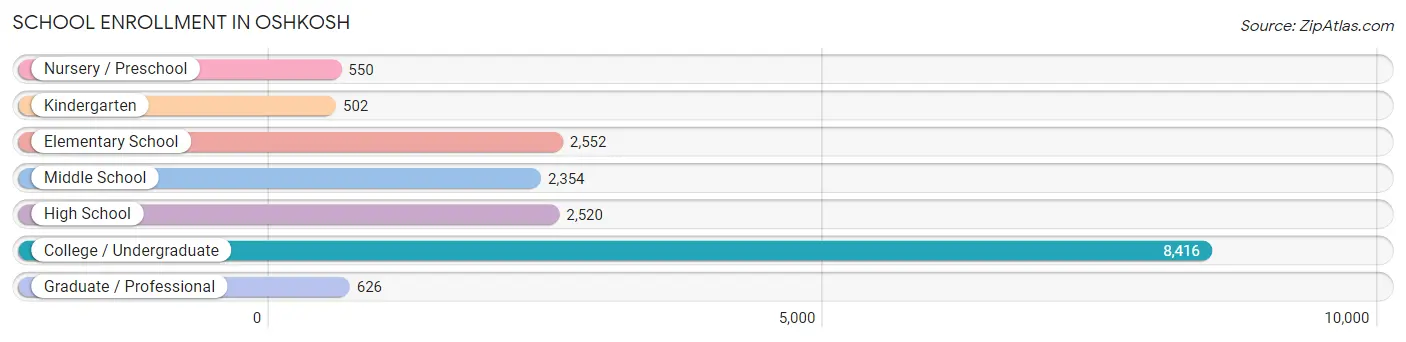
| School Level | # Students | % Students |
| Nursery / Preschool | 550 | 3.1% |
| Kindergarten | 502 | 2.9% |
| Elementary School | 2,552 | 14.6% |
| Middle School | 2,354 | 13.4% |
| High School | 2,520 | 14.4% |
| College / Undergraduate | 8,416 | 48.0% |
| Graduate / Professional | 626 | 3.6% |
| Total | 17,520 | 100.0% |
School Enrollment by Age by Funding Source in Oshkosh
Out of a total of 17,520 students who are enrolled in schools in Oshkosh, 1,472 (8.4%) attend a private institution, while the remaining 16,048 (91.6%) are enrolled in public schools. The age group of 3 to 4 year olds has the highest likelihood of being enrolled in private schools, with 58 (22.8% in the age bracket) enrolled. Conversely, the age group of 20 to 24 year olds has the lowest likelihood of being enrolled in a private school, with 5,098 (96.3% in the age bracket) attending a public institution.
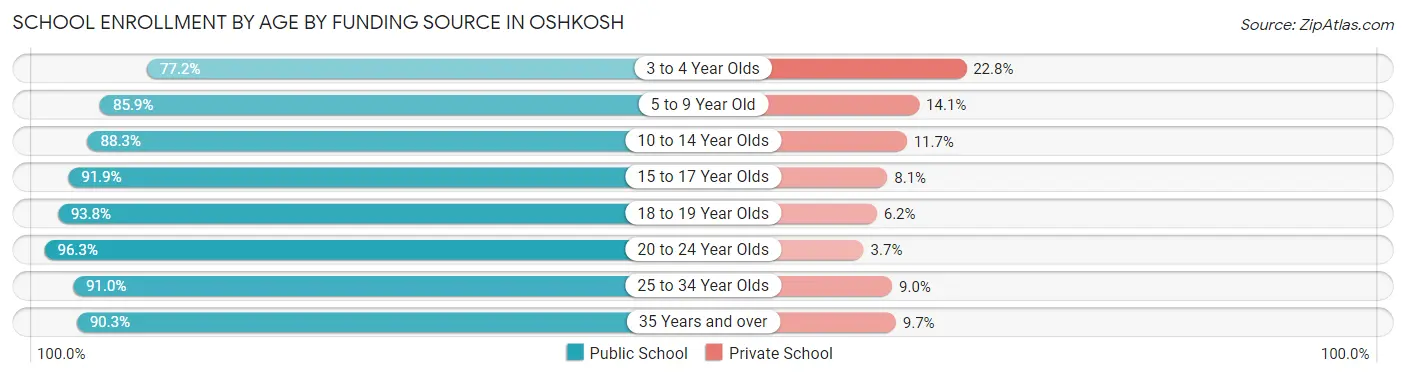
| Age Bracket | Public School | Private School |
| 3 to 4 Year Olds | 196 (77.2%) | 58 (22.8%) |
| 5 to 9 Year Old | 2,481 (85.9%) | 406 (14.1%) |
| 10 to 14 Year Olds | 2,655 (88.3%) | 353 (11.7%) |
| 15 to 17 Year Olds | 1,659 (91.9%) | 147 (8.1%) |
| 18 to 19 Year Olds | 2,584 (93.8%) | 170 (6.2%) |
| 20 to 24 Year Olds | 5,098 (96.3%) | 197 (3.7%) |
| 25 to 34 Year Olds | 827 (91.0%) | 82 (9.0%) |
| 35 Years and over | 548 (90.3%) | 59 (9.7%) |
| Total | 16,048 (91.6%) | 1,472 (8.4%) |
Educational Attainment by Field of Study in Oshkosh
Business (2,040 | 16.3%), education (2,025 | 16.1%), arts & humanities (1,152 | 9.2%), science & technology (1,129 | 9.0%), and bio, nature & agricultural (936 | 7.5%) are the most common fields of study among 12,547 individuals in Oshkosh who have obtained a bachelor's degree or higher.
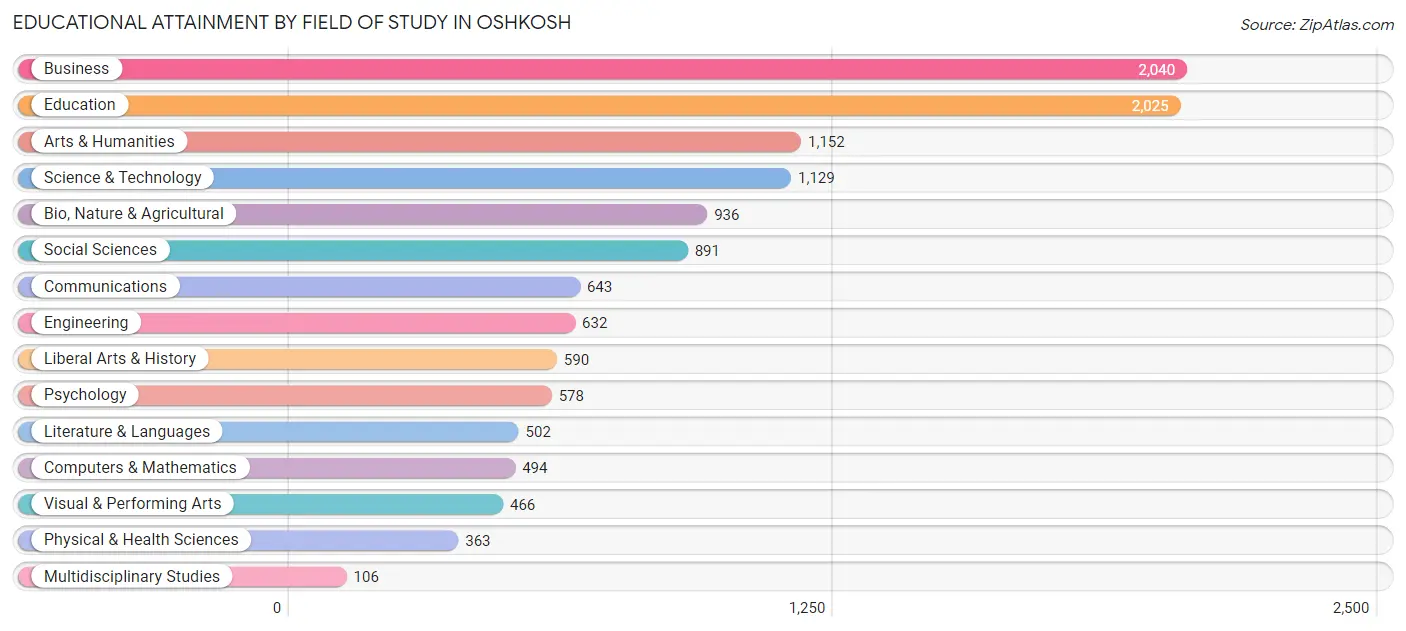
| Field of Study | # Graduates | % Graduates |
| Computers & Mathematics | 494 | 3.9% |
| Bio, Nature & Agricultural | 936 | 7.5% |
| Physical & Health Sciences | 363 | 2.9% |
| Psychology | 578 | 4.6% |
| Social Sciences | 891 | 7.1% |
| Engineering | 632 | 5.0% |
| Multidisciplinary Studies | 106 | 0.8% |
| Science & Technology | 1,129 | 9.0% |
| Business | 2,040 | 16.3% |
| Education | 2,025 | 16.1% |
| Literature & Languages | 502 | 4.0% |
| Liberal Arts & History | 590 | 4.7% |
| Visual & Performing Arts | 466 | 3.7% |
| Communications | 643 | 5.1% |
| Arts & Humanities | 1,152 | 9.2% |
| Total | 12,547 | 100.0% |
Transportation & Commute in Oshkosh
Vehicle Availability by Sex in Oshkosh
The most prevalent vehicle ownership categories in Oshkosh are males with 2 vehicles (8,296, accounting for 47.3%) and females with 2 vehicles (7,161, making up 53.6%).
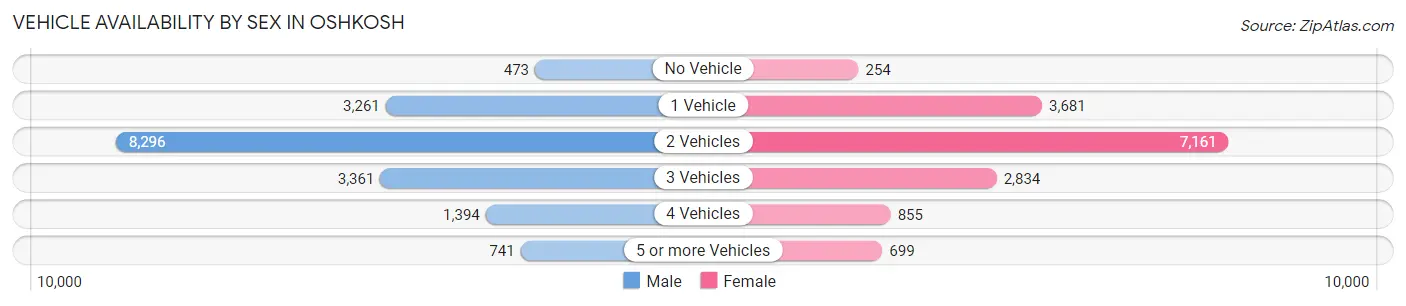
| Vehicles Available | Male | Female |
| No Vehicle | 473 (2.7%) | 254 (1.6%) |
| 1 Vehicle | 3,261 (18.6%) | 3,681 (23.8%) |
| 2 Vehicles | 8,296 (47.3%) | 7,161 (46.3%) |
| 3 Vehicles | 3,361 (19.2%) | 2,834 (18.3%) |
| 4 Vehicles | 1,394 (8.0%) | 855 (5.5%) |
| 5 or more Vehicles | 741 (4.2%) | 699 (4.5%) |
| Total | 17,526 (100.0%) | 15,484 (100.0%) |
Commute Time in Oshkosh
The most frequently occuring commute durations in Oshkosh are 5 to 9 minutes (7,845 commuters, 24.6%), 10 to 14 minutes (7,285 commuters, 22.9%), and 15 to 19 minutes (5,034 commuters, 15.8%).
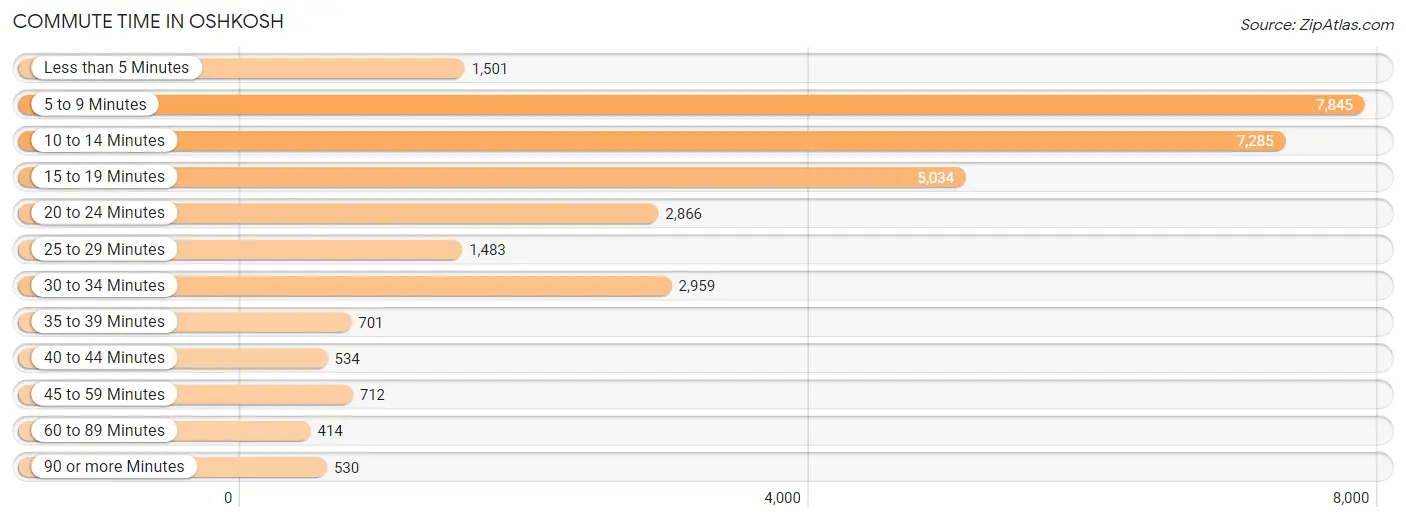
| Commute Time | # Commuters | % Commuters |
| Less than 5 Minutes | 1,501 | 4.7% |
| 5 to 9 Minutes | 7,845 | 24.6% |
| 10 to 14 Minutes | 7,285 | 22.9% |
| 15 to 19 Minutes | 5,034 | 15.8% |
| 20 to 24 Minutes | 2,866 | 9.0% |
| 25 to 29 Minutes | 1,483 | 4.6% |
| 30 to 34 Minutes | 2,959 | 9.3% |
| 35 to 39 Minutes | 701 | 2.2% |
| 40 to 44 Minutes | 534 | 1.7% |
| 45 to 59 Minutes | 712 | 2.2% |
| 60 to 89 Minutes | 414 | 1.3% |
| 90 or more Minutes | 530 | 1.7% |
Commute Time by Sex in Oshkosh
The most common commute times in Oshkosh are 10 to 14 minutes (3,868 commuters, 22.7%) for males and 5 to 9 minutes (4,114 commuters, 27.8%) for females.
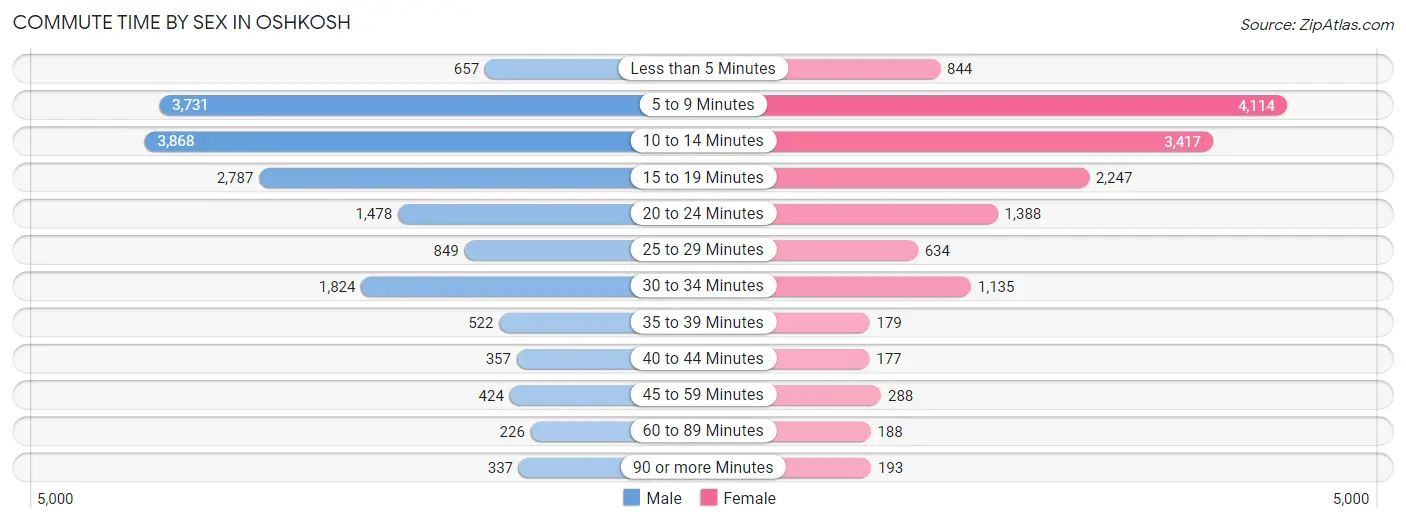
| Commute Time | Male | Female |
| Less than 5 Minutes | 657 (3.8%) | 844 (5.7%) |
| 5 to 9 Minutes | 3,731 (21.9%) | 4,114 (27.8%) |
| 10 to 14 Minutes | 3,868 (22.7%) | 3,417 (23.1%) |
| 15 to 19 Minutes | 2,787 (16.3%) | 2,247 (15.2%) |
| 20 to 24 Minutes | 1,478 (8.7%) | 1,388 (9.4%) |
| 25 to 29 Minutes | 849 (5.0%) | 634 (4.3%) |
| 30 to 34 Minutes | 1,824 (10.7%) | 1,135 (7.7%) |
| 35 to 39 Minutes | 522 (3.1%) | 179 (1.2%) |
| 40 to 44 Minutes | 357 (2.1%) | 177 (1.2%) |
| 45 to 59 Minutes | 424 (2.5%) | 288 (1.9%) |
| 60 to 89 Minutes | 226 (1.3%) | 188 (1.3%) |
| 90 or more Minutes | 337 (2.0%) | 193 (1.3%) |
Time of Departure to Work by Sex in Oshkosh
The most frequent times of departure to work in Oshkosh are 4:00 PM to 11:59 PM (2,193, 12.9%) for males and 7:00 AM to 7:29 AM (1,978, 13.4%) for females.
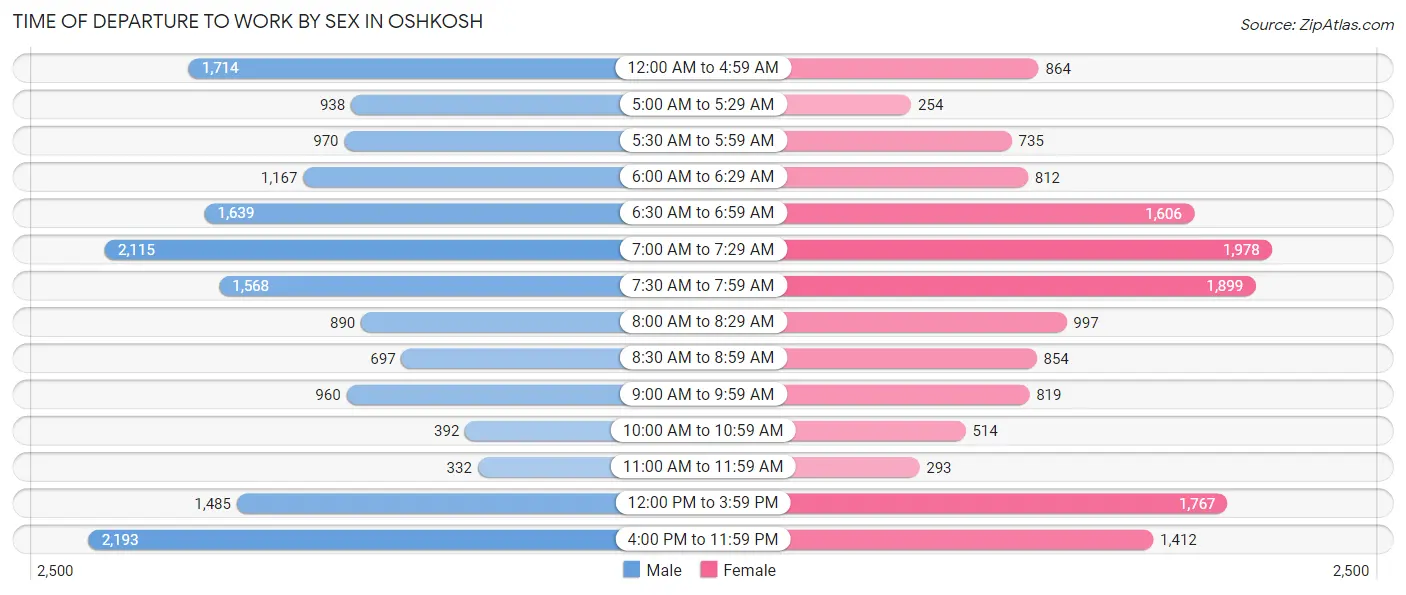
| Time of Departure | Male | Female |
| 12:00 AM to 4:59 AM | 1,714 (10.1%) | 864 (5.8%) |
| 5:00 AM to 5:29 AM | 938 (5.5%) | 254 (1.7%) |
| 5:30 AM to 5:59 AM | 970 (5.7%) | 735 (5.0%) |
| 6:00 AM to 6:29 AM | 1,167 (6.8%) | 812 (5.5%) |
| 6:30 AM to 6:59 AM | 1,639 (9.6%) | 1,606 (10.8%) |
| 7:00 AM to 7:29 AM | 2,115 (12.4%) | 1,978 (13.4%) |
| 7:30 AM to 7:59 AM | 1,568 (9.2%) | 1,899 (12.8%) |
| 8:00 AM to 8:29 AM | 890 (5.2%) | 997 (6.7%) |
| 8:30 AM to 8:59 AM | 697 (4.1%) | 854 (5.8%) |
| 9:00 AM to 9:59 AM | 960 (5.6%) | 819 (5.5%) |
| 10:00 AM to 10:59 AM | 392 (2.3%) | 514 (3.5%) |
| 11:00 AM to 11:59 AM | 332 (1.9%) | 293 (2.0%) |
| 12:00 PM to 3:59 PM | 1,485 (8.7%) | 1,767 (11.9%) |
| 4:00 PM to 11:59 PM | 2,193 (12.9%) | 1,412 (9.5%) |
| Total | 17,060 (100.0%) | 14,804 (100.0%) |
Housing Occupancy in Oshkosh
Occupancy by Ownership in Oshkosh
Of the total 26,763 dwellings in Oshkosh, owner-occupied units account for 14,843 (55.5%), while renter-occupied units make up 11,920 (44.5%).
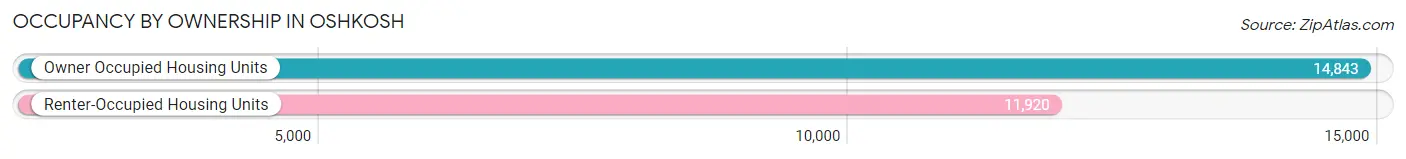
| Occupancy | # Housing Units | % Housing Units |
| Owner Occupied Housing Units | 14,843 | 55.5% |
| Renter-Occupied Housing Units | 11,920 | 44.5% |
| Total Occupied Housing Units | 26,763 | 100.0% |
Occupancy by Household Size in Oshkosh
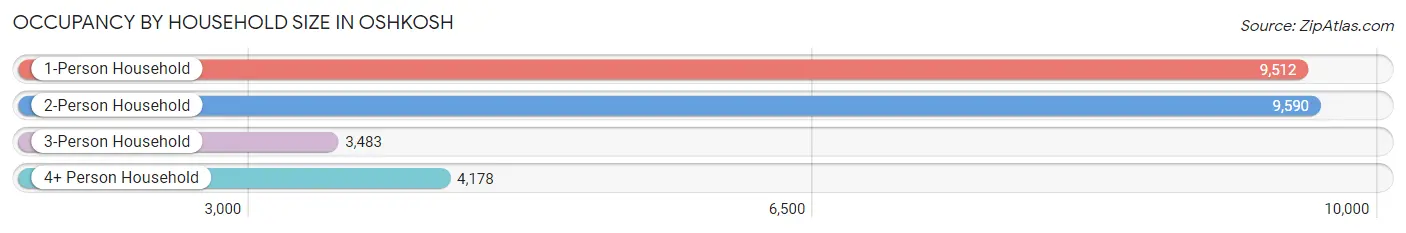
| Household Size | # Housing Units | % Housing Units |
| 1-Person Household | 9,512 | 35.5% |
| 2-Person Household | 9,590 | 35.8% |
| 3-Person Household | 3,483 | 13.0% |
| 4+ Person Household | 4,178 | 15.6% |
| Total Housing Units | 26,763 | 100.0% |
Occupancy by Ownership by Household Size in Oshkosh
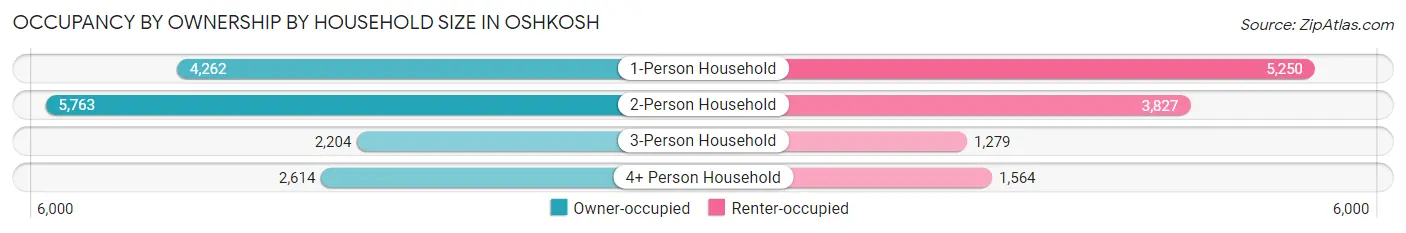
| Household Size | Owner-occupied | Renter-occupied |
| 1-Person Household | 4,262 (44.8%) | 5,250 (55.2%) |
| 2-Person Household | 5,763 (60.1%) | 3,827 (39.9%) |
| 3-Person Household | 2,204 (63.3%) | 1,279 (36.7%) |
| 4+ Person Household | 2,614 (62.6%) | 1,564 (37.4%) |
| Total Housing Units | 14,843 (55.5%) | 11,920 (44.5%) |
Occupancy by Educational Attainment in Oshkosh
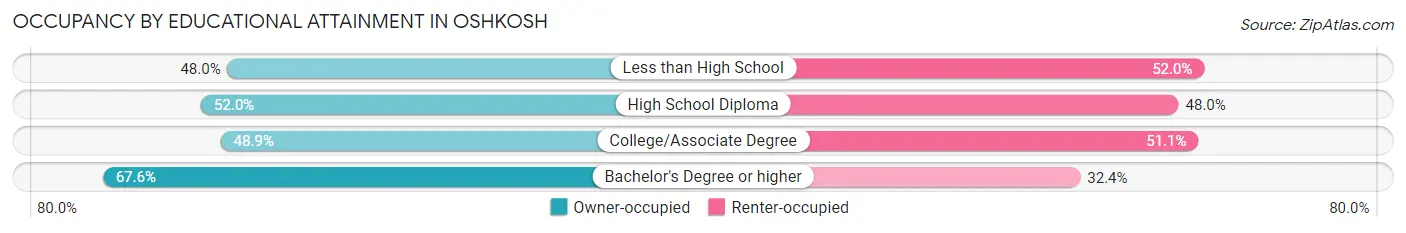
| Household Size | Owner-occupied | Renter-occupied |
| Less than High School | 595 (48.0%) | 645 (52.0%) |
| High School Diploma | 4,103 (52.0%) | 3,783 (48.0%) |
| College/Associate Degree | 4,652 (48.9%) | 4,860 (51.1%) |
| Bachelor's Degree or higher | 5,493 (67.6%) | 2,632 (32.4%) |
Occupancy by Age of Householder in Oshkosh
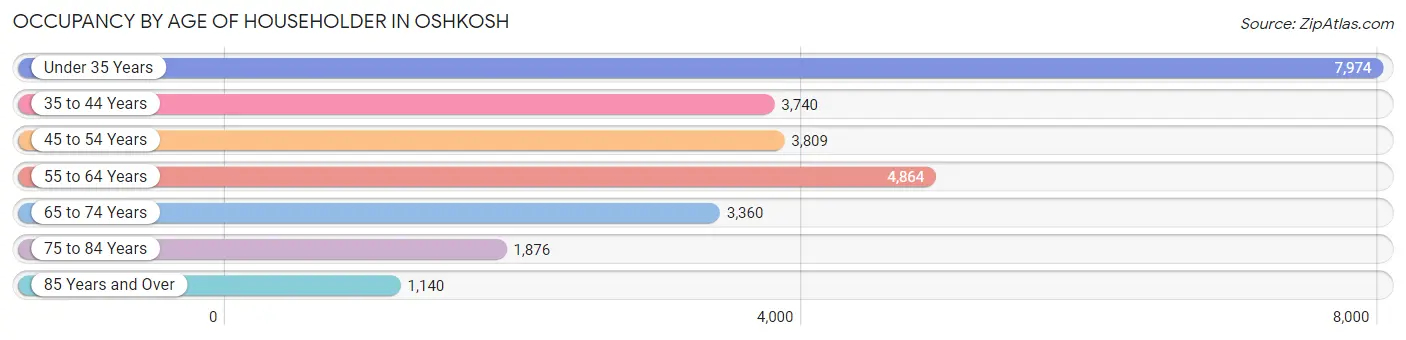
| Age Bracket | # Households | % Households |
| Under 35 Years | 7,974 | 29.8% |
| 35 to 44 Years | 3,740 | 14.0% |
| 45 to 54 Years | 3,809 | 14.2% |
| 55 to 64 Years | 4,864 | 18.2% |
| 65 to 74 Years | 3,360 | 12.6% |
| 75 to 84 Years | 1,876 | 7.0% |
| 85 Years and Over | 1,140 | 4.3% |
| Total | 26,763 | 100.0% |
Housing Finances in Oshkosh
Median Income by Occupancy in Oshkosh
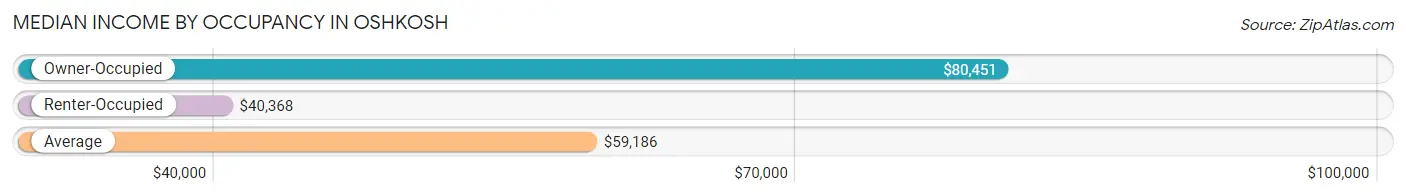
| Occupancy Type | # Households | Median Income |
| Owner-Occupied | 14,843 (55.5%) | $80,451 |
| Renter-Occupied | 11,920 (44.5%) | $40,368 |
| Average | 26,763 (100.0%) | $59,186 |
Occupancy by Householder Income Bracket in Oshkosh
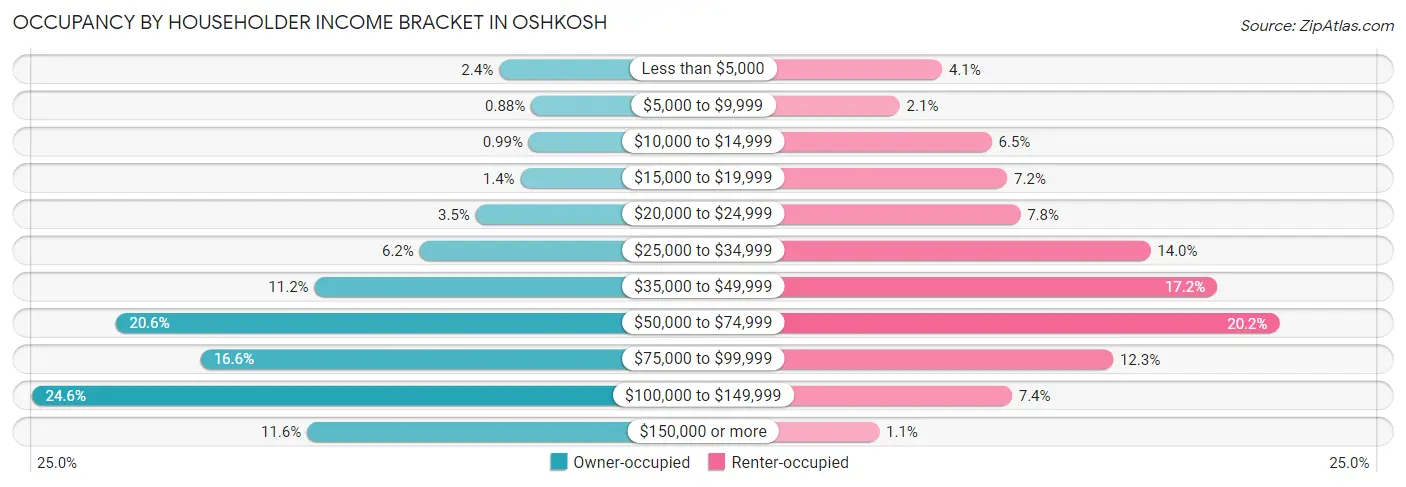
| Income Bracket | Owner-occupied | Renter-occupied |
| Less than $5,000 | 358 (2.4%) | 491 (4.1%) |
| $5,000 to $9,999 | 131 (0.9%) | 250 (2.1%) |
| $10,000 to $14,999 | 147 (1.0%) | 772 (6.5%) |
| $15,000 to $19,999 | 206 (1.4%) | 861 (7.2%) |
| $20,000 to $24,999 | 523 (3.5%) | 934 (7.8%) |
| $25,000 to $34,999 | 919 (6.2%) | 1,674 (14.0%) |
| $35,000 to $49,999 | 1,663 (11.2%) | 2,051 (17.2%) |
| $50,000 to $74,999 | 3,062 (20.6%) | 2,406 (20.2%) |
| $75,000 to $99,999 | 2,466 (16.6%) | 1,461 (12.3%) |
| $100,000 to $149,999 | 3,654 (24.6%) | 887 (7.4%) |
| $150,000 or more | 1,714 (11.6%) | 133 (1.1%) |
| Total | 14,843 (100.0%) | 11,920 (100.0%) |
Monthly Housing Cost Tiers in Oshkosh
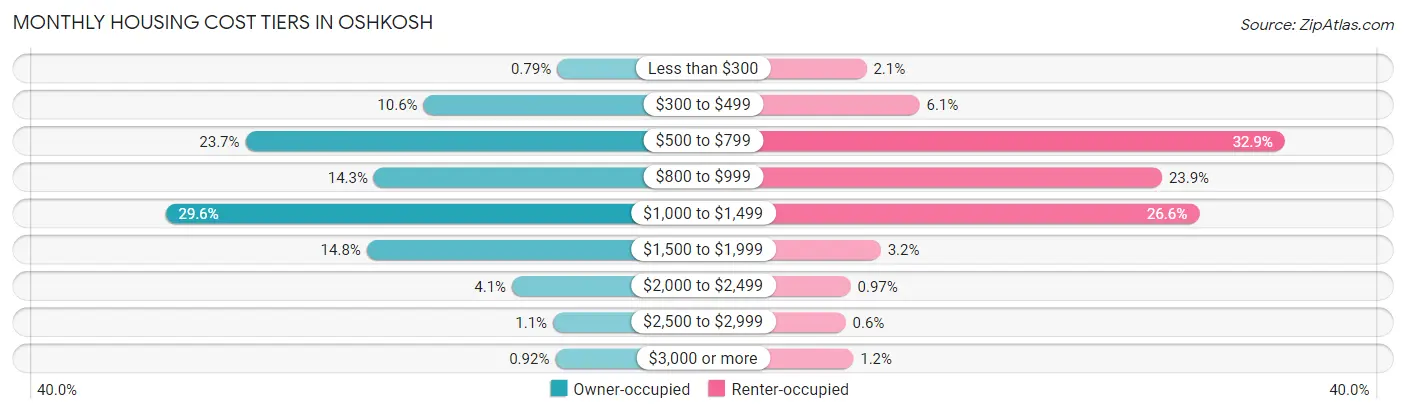
| Monthly Cost | Owner-occupied | Renter-occupied |
| Less than $300 | 117 (0.8%) | 255 (2.1%) |
| $300 to $499 | 1,578 (10.6%) | 721 (6.0%) |
| $500 to $799 | 3,524 (23.7%) | 3,927 (32.9%) |
| $800 to $999 | 2,119 (14.3%) | 2,849 (23.9%) |
| $1,000 to $1,499 | 4,398 (29.6%) | 3,174 (26.6%) |
| $1,500 to $1,999 | 2,198 (14.8%) | 380 (3.2%) |
| $2,000 to $2,499 | 610 (4.1%) | 116 (1.0%) |
| $2,500 to $2,999 | 162 (1.1%) | 72 (0.6%) |
| $3,000 or more | 137 (0.9%) | 140 (1.2%) |
| Total | 14,843 (100.0%) | 11,920 (100.0%) |
Physical Housing Characteristics in Oshkosh
Housing Structures in Oshkosh
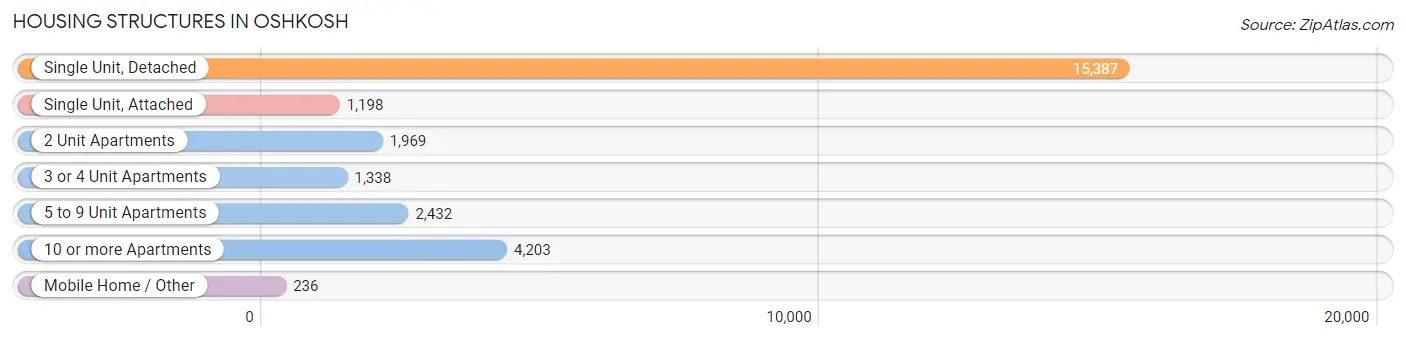
| Structure Type | # Housing Units | % Housing Units |
| Single Unit, Detached | 15,387 | 57.5% |
| Single Unit, Attached | 1,198 | 4.5% |
| 2 Unit Apartments | 1,969 | 7.4% |
| 3 or 4 Unit Apartments | 1,338 | 5.0% |
| 5 to 9 Unit Apartments | 2,432 | 9.1% |
| 10 or more Apartments | 4,203 | 15.7% |
| Mobile Home / Other | 236 | 0.9% |
| Total | 26,763 | 100.0% |
Housing Structures by Occupancy in Oshkosh
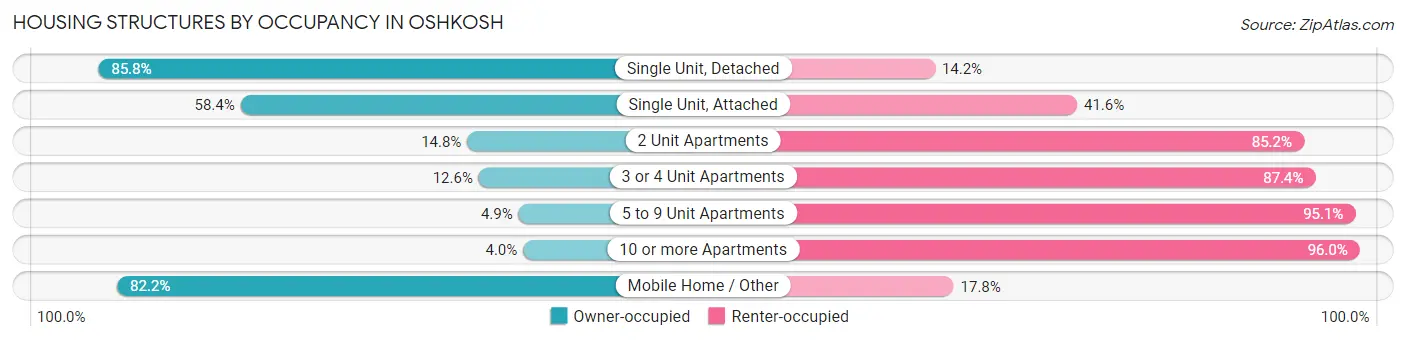
| Structure Type | Owner-occupied | Renter-occupied |
| Single Unit, Detached | 13,202 (85.8%) | 2,185 (14.2%) |
| Single Unit, Attached | 700 (58.4%) | 498 (41.6%) |
| 2 Unit Apartments | 291 (14.8%) | 1,678 (85.2%) |
| 3 or 4 Unit Apartments | 168 (12.6%) | 1,170 (87.4%) |
| 5 to 9 Unit Apartments | 119 (4.9%) | 2,313 (95.1%) |
| 10 or more Apartments | 169 (4.0%) | 4,034 (96.0%) |
| Mobile Home / Other | 194 (82.2%) | 42 (17.8%) |
| Total | 14,843 (55.5%) | 11,920 (44.5%) |
Housing Structures by Number of Rooms in Oshkosh
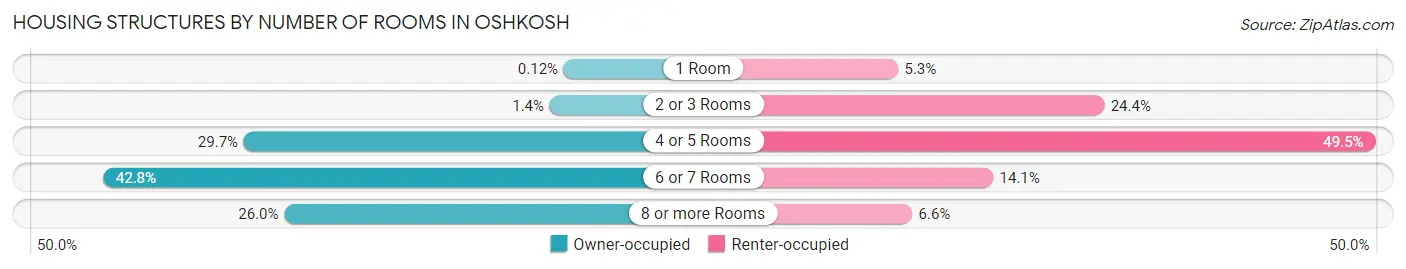
| Number of Rooms | Owner-occupied | Renter-occupied |
| 1 Room | 18 (0.1%) | 635 (5.3%) |
| 2 or 3 Rooms | 211 (1.4%) | 2,909 (24.4%) |
| 4 or 5 Rooms | 4,411 (29.7%) | 5,903 (49.5%) |
| 6 or 7 Rooms | 6,347 (42.8%) | 1,683 (14.1%) |
| 8 or more Rooms | 3,856 (26.0%) | 790 (6.6%) |
| Total | 14,843 (100.0%) | 11,920 (100.0%) |
Housing Structure by Heating Type in Oshkosh
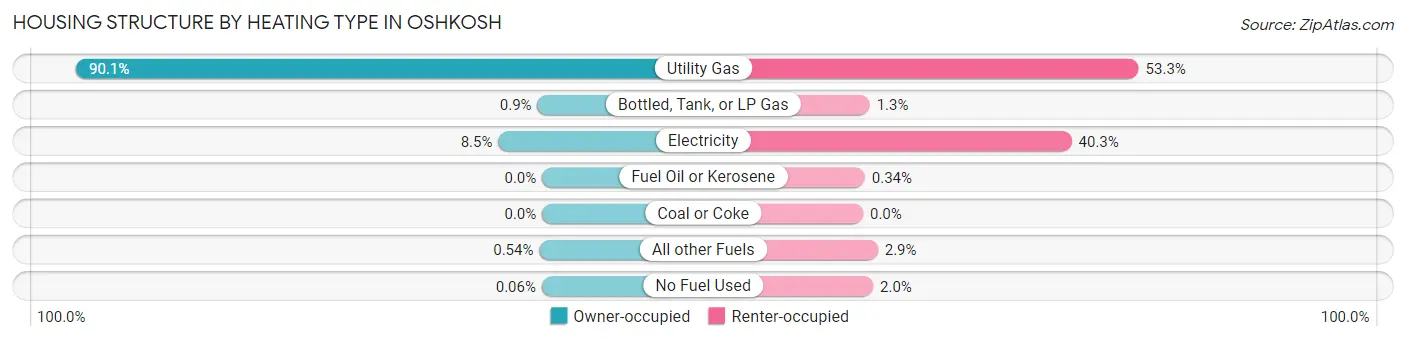
| Heating Type | Owner-occupied | Renter-occupied |
| Utility Gas | 13,366 (90.0%) | 6,349 (53.3%) |
| Bottled, Tank, or LP Gas | 133 (0.9%) | 154 (1.3%) |
| Electricity | 1,255 (8.5%) | 4,804 (40.3%) |
| Fuel Oil or Kerosene | 0 (0.0%) | 40 (0.3%) |
| Coal or Coke | 0 (0.0%) | 0 (0.0%) |
| All other Fuels | 80 (0.5%) | 340 (2.9%) |
| No Fuel Used | 9 (0.1%) | 233 (1.9%) |
| Total | 14,843 (100.0%) | 11,920 (100.0%) |
Household Vehicle Usage in Oshkosh
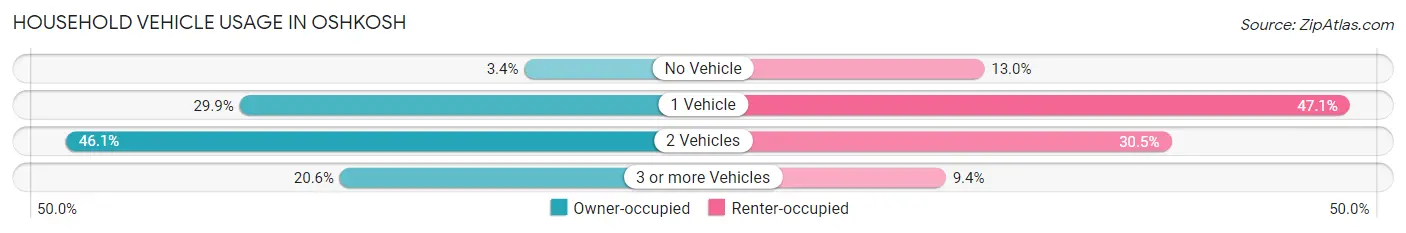
| Vehicles per Household | Owner-occupied | Renter-occupied |
| No Vehicle | 497 (3.4%) | 1,551 (13.0%) |
| 1 Vehicle | 4,444 (29.9%) | 5,616 (47.1%) |
| 2 Vehicles | 6,849 (46.1%) | 3,631 (30.5%) |
| 3 or more Vehicles | 3,053 (20.6%) | 1,122 (9.4%) |
| Total | 14,843 (100.0%) | 11,920 (100.0%) |
Real Estate & Mortgages in Oshkosh
Real Estate and Mortgage Overview in Oshkosh
| Characteristic | Without Mortgage | With Mortgage |
| Housing Units | 5,685 | 9,158 |
| Median Property Value | $160,600 | $154,400 |
| Median Household Income | $57,578 | $1,245 |
| Monthly Housing Costs | $609 | $137 |
| Real Estate Taxes | $3,520 | $100 |
Property Value by Mortgage Status in Oshkosh
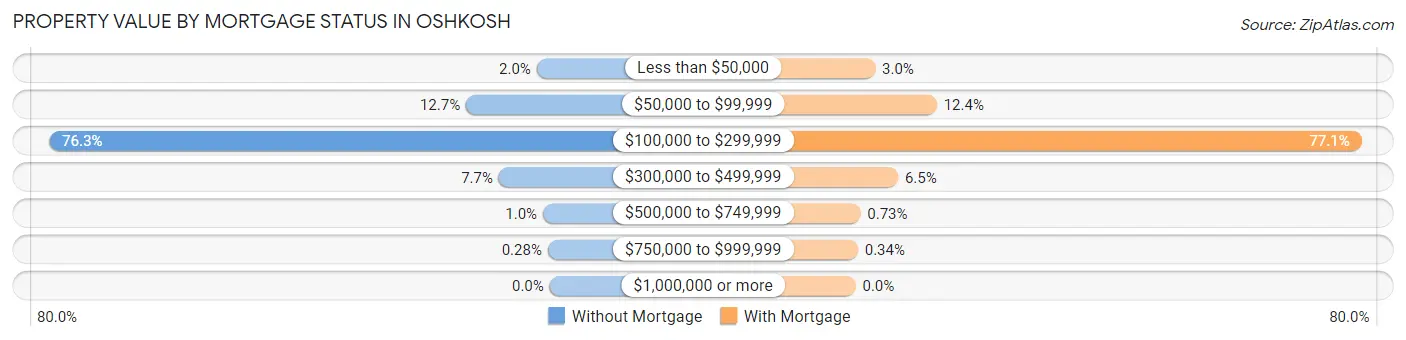
| Property Value | Without Mortgage | With Mortgage |
| Less than $50,000 | 112 (2.0%) | 273 (3.0%) |
| $50,000 to $99,999 | 724 (12.7%) | 1,133 (12.4%) |
| $100,000 to $299,999 | 4,335 (76.2%) | 7,062 (77.1%) |
| $300,000 to $499,999 | 440 (7.7%) | 592 (6.5%) |
| $500,000 to $749,999 | 58 (1.0%) | 67 (0.7%) |
| $750,000 to $999,999 | 16 (0.3%) | 31 (0.3%) |
| $1,000,000 or more | 0 (0.0%) | 0 (0.0%) |
| Total | 5,685 (100.0%) | 9,158 (100.0%) |
Household Income by Mortgage Status in Oshkosh
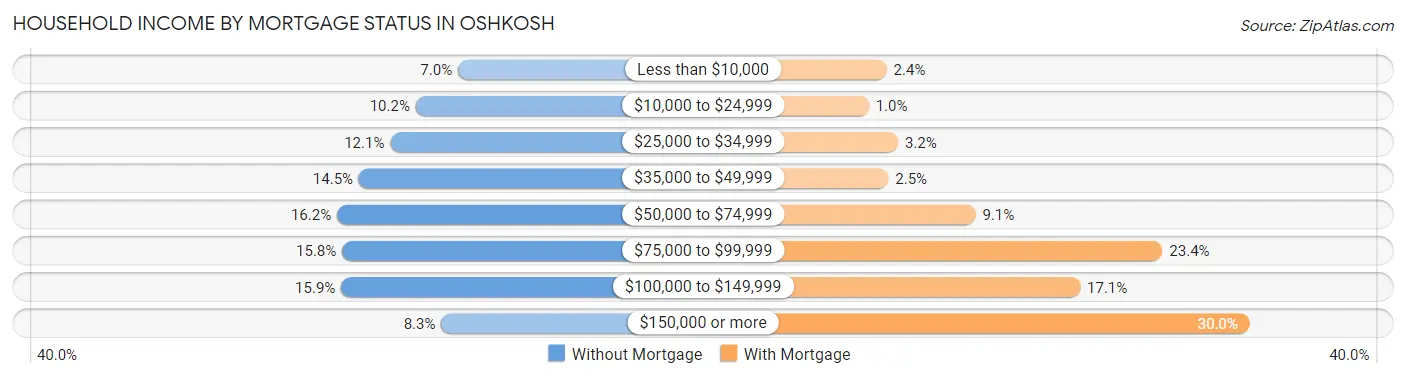
| Household Income | Without Mortgage | With Mortgage |
| Less than $10,000 | 397 (7.0%) | 217 (2.4%) |
| $10,000 to $24,999 | 580 (10.2%) | 92 (1.0%) |
| $25,000 to $34,999 | 690 (12.1%) | 296 (3.2%) |
| $35,000 to $49,999 | 826 (14.5%) | 229 (2.5%) |
| $50,000 to $74,999 | 921 (16.2%) | 837 (9.1%) |
| $75,000 to $99,999 | 899 (15.8%) | 2,141 (23.4%) |
| $100,000 to $149,999 | 903 (15.9%) | 1,567 (17.1%) |
| $150,000 or more | 469 (8.3%) | 2,751 (30.0%) |
| Total | 5,685 (100.0%) | 9,158 (100.0%) |
Property Value to Household Income Ratio in Oshkosh
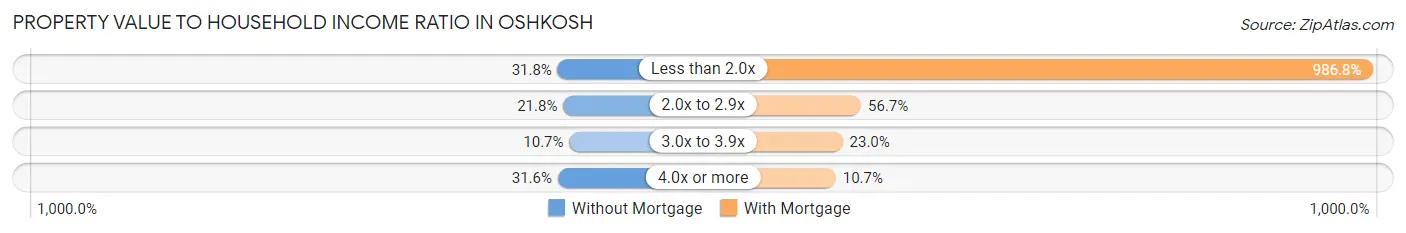
| Value-to-Income Ratio | Without Mortgage | With Mortgage |
| Less than 2.0x | 1,809 (31.8%) | 90,373 (986.8%) |
| 2.0x to 2.9x | 1,239 (21.8%) | 5,190 (56.7%) |
| 3.0x to 3.9x | 609 (10.7%) | 2,105 (23.0%) |
| 4.0x or more | 1,799 (31.6%) | 976 (10.7%) |
| Total | 5,685 (100.0%) | 9,158 (100.0%) |
Real Estate Taxes by Mortgage Status in Oshkosh

| Property Taxes | Without Mortgage | With Mortgage |
| Less than $800 | 107 (1.9%) | 34 (0.4%) |
| $800 to $1,499 | 87 (1.5%) | 157 (1.7%) |
| $800 to $1,499 | 5,405 (95.1%) | 326 (3.6%) |
| Total | 5,685 (100.0%) | 9,158 (100.0%) |
Health & Disability in Oshkosh
Health Insurance Coverage by Age in Oshkosh
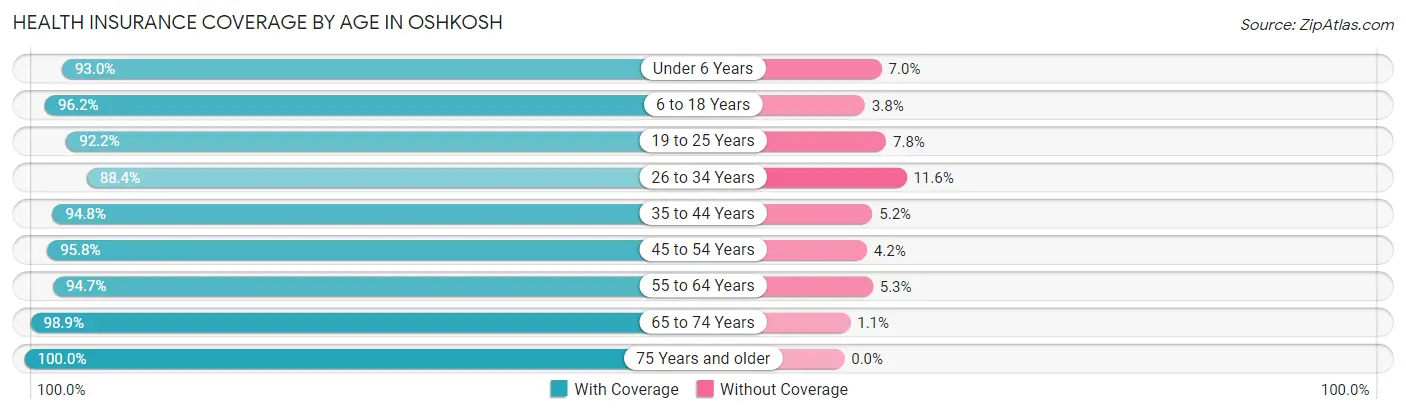
| Age Bracket | With Coverage | Without Coverage |
| Under 6 Years | 3,793 (93.0%) | 284 (7.0%) |
| 6 to 18 Years | 8,556 (96.2%) | 342 (3.8%) |
| 19 to 25 Years | 11,054 (92.2%) | 934 (7.8%) |
| 26 to 34 Years | 6,968 (88.4%) | 914 (11.6%) |
| 35 to 44 Years | 6,455 (94.8%) | 356 (5.2%) |
| 45 to 54 Years | 6,223 (95.8%) | 274 (4.2%) |
| 55 to 64 Years | 7,060 (94.7%) | 396 (5.3%) |
| 65 to 74 Years | 4,875 (98.9%) | 55 (1.1%) |
| 75 Years and older | 4,119 (100.0%) | 0 (0.0%) |
| Total | 59,103 (94.3%) | 3,555 (5.7%) |
Health Insurance Coverage by Citizenship Status in Oshkosh

| Citizenship Status | With Coverage | Without Coverage |
| Native Born | 3,793 (93.0%) | 284 (7.0%) |
| Foreign Born, Citizen | 8,556 (96.2%) | 342 (3.8%) |
| Foreign Born, not a Citizen | 11,054 (92.2%) | 934 (7.8%) |
Health Insurance Coverage by Household Income in Oshkosh
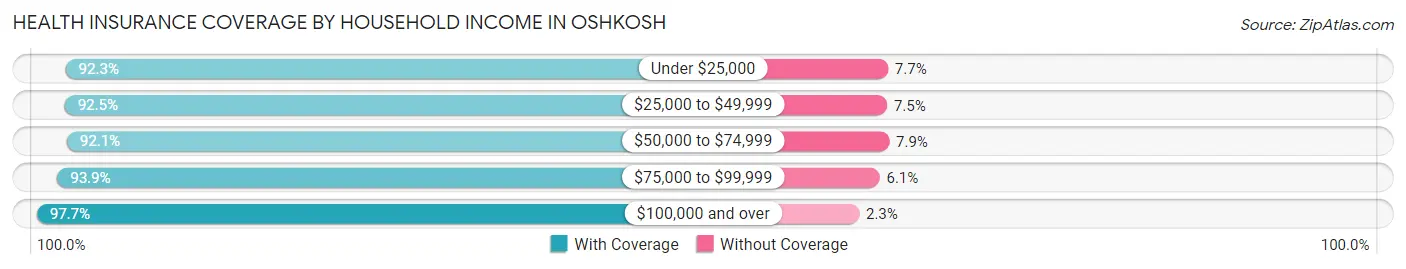
| Household Income | With Coverage | Without Coverage |
| Under $25,000 | 6,795 (92.3%) | 567 (7.7%) |
| $25,000 to $49,999 | 10,670 (92.5%) | 869 (7.5%) |
| $50,000 to $74,999 | 11,222 (92.1%) | 966 (7.9%) |
| $75,000 to $99,999 | 9,596 (93.9%) | 627 (6.1%) |
| $100,000 and over | 17,914 (97.7%) | 419 (2.3%) |
Public vs Private Health Insurance Coverage by Age in Oshkosh
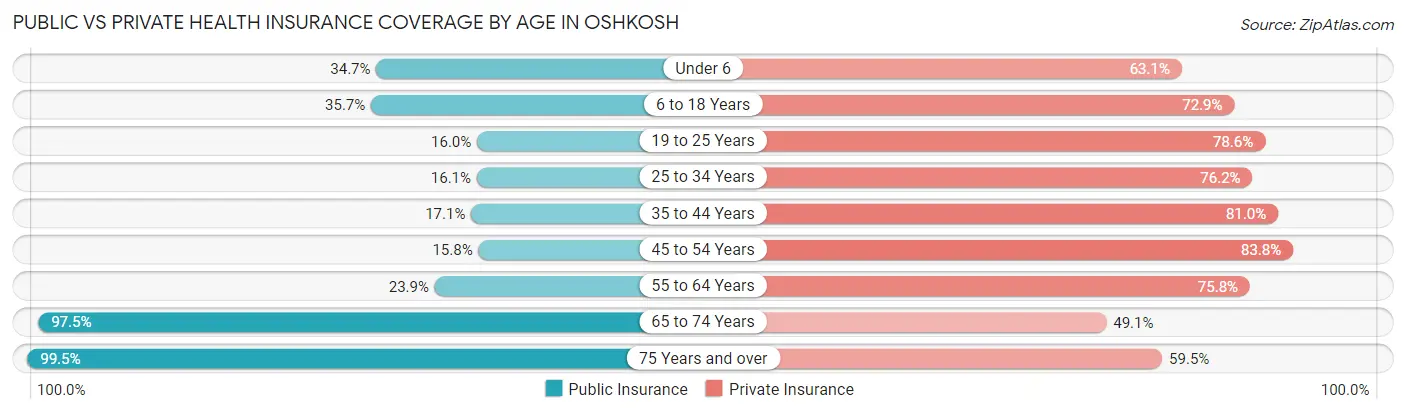
| Age Bracket | Public Insurance | Private Insurance |
| Under 6 | 1,415 (34.7%) | 2,572 (63.1%) |
| 6 to 18 Years | 3,175 (35.7%) | 6,483 (72.9%) |
| 19 to 25 Years | 1,919 (16.0%) | 9,416 (78.5%) |
| 25 to 34 Years | 1,265 (16.1%) | 6,007 (76.2%) |
| 35 to 44 Years | 1,165 (17.1%) | 5,514 (81.0%) |
| 45 to 54 Years | 1,023 (15.8%) | 5,442 (83.8%) |
| 55 to 64 Years | 1,779 (23.9%) | 5,648 (75.7%) |
| 65 to 74 Years | 4,805 (97.5%) | 2,420 (49.1%) |
| 75 Years and over | 4,098 (99.5%) | 2,449 (59.5%) |
| Total | 20,644 (33.0%) | 45,951 (73.3%) |
Disability Status by Sex by Age in Oshkosh
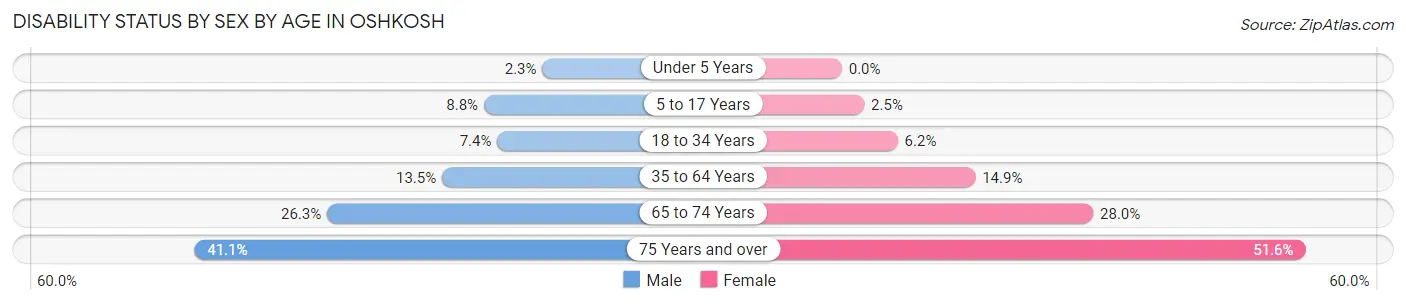
| Age Bracket | Male | Female |
| Under 5 Years | 40 (2.3%) | 0 (0.0%) |
| 5 to 17 Years | 353 (8.8%) | 103 (2.5%) |
| 18 to 34 Years | 809 (7.4%) | 644 (6.2%) |
| 35 to 64 Years | 1,416 (13.5%) | 1,529 (14.9%) |
| 65 to 74 Years | 583 (26.3%) | 760 (28.0%) |
| 75 Years and over | 637 (41.1%) | 1,326 (51.6%) |
Disability Class by Sex by Age in Oshkosh
Disability Class: Hearing Difficulty
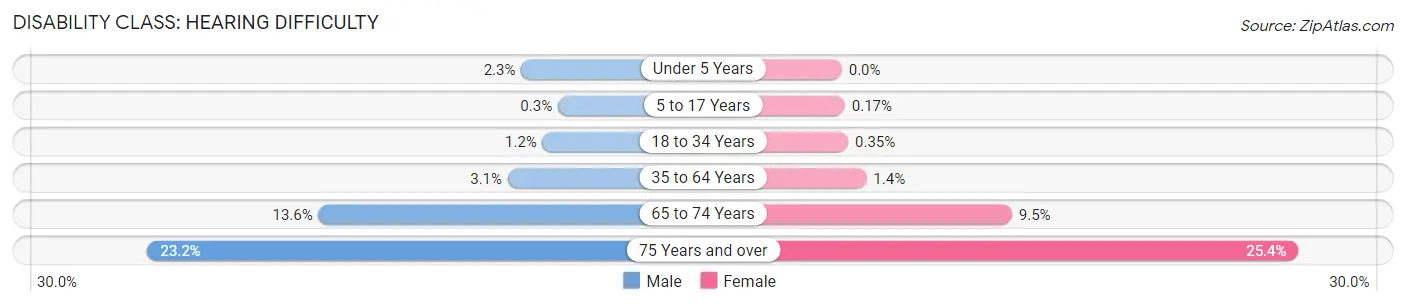
| Age Bracket | Male | Female |
| Under 5 Years | 40 (2.3%) | 0 (0.0%) |
| 5 to 17 Years | 12 (0.3%) | 7 (0.2%) |
| 18 to 34 Years | 126 (1.1%) | 36 (0.4%) |
| 35 to 64 Years | 324 (3.1%) | 141 (1.4%) |
| 65 to 74 Years | 302 (13.6%) | 257 (9.5%) |
| 75 Years and over | 359 (23.2%) | 653 (25.4%) |
Disability Class: Vision Difficulty
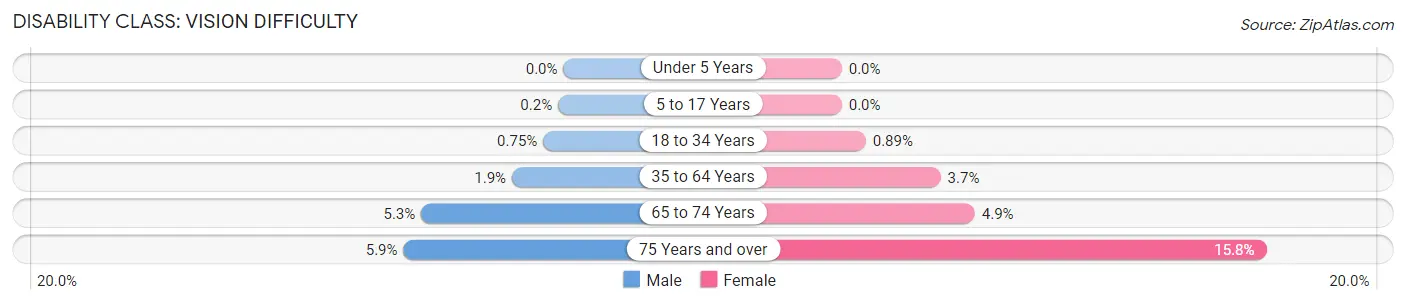
| Age Bracket | Male | Female |
| Under 5 Years | 0 (0.0%) | 0 (0.0%) |
| 5 to 17 Years | 8 (0.2%) | 0 (0.0%) |
| 18 to 34 Years | 82 (0.7%) | 92 (0.9%) |
| 35 to 64 Years | 200 (1.9%) | 377 (3.7%) |
| 65 to 74 Years | 117 (5.3%) | 134 (4.9%) |
| 75 Years and over | 92 (5.9%) | 405 (15.8%) |
Disability Class: Cognitive Difficulty
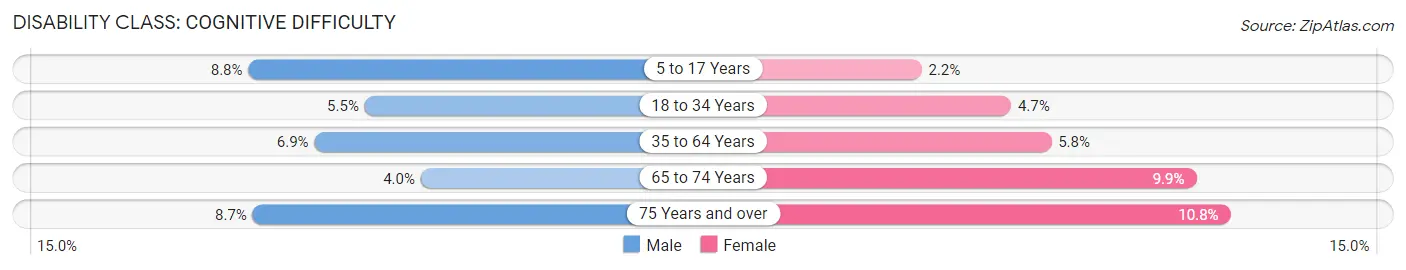
| Age Bracket | Male | Female |
| 5 to 17 Years | 350 (8.8%) | 92 (2.2%) |
| 18 to 34 Years | 608 (5.5%) | 488 (4.7%) |
| 35 to 64 Years | 726 (6.9%) | 600 (5.8%) |
| 65 to 74 Years | 88 (4.0%) | 268 (9.9%) |
| 75 Years and over | 134 (8.6%) | 278 (10.8%) |
Disability Class: Ambulatory Difficulty
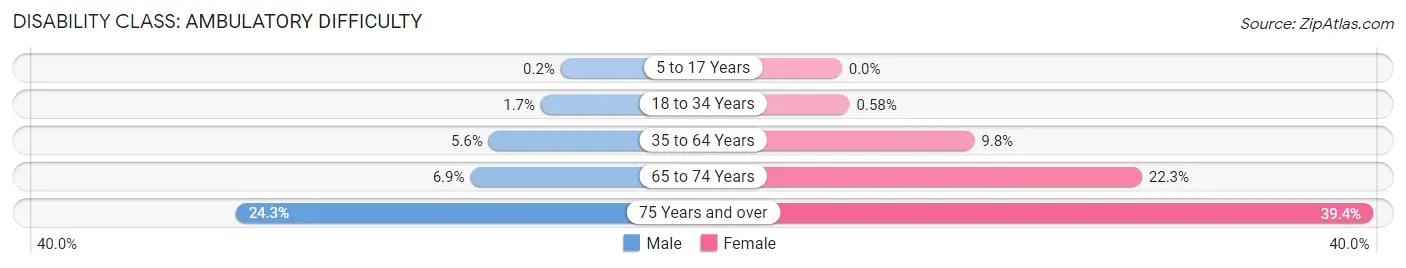
| Age Bracket | Male | Female |
| 5 to 17 Years | 8 (0.2%) | 0 (0.0%) |
| 18 to 34 Years | 183 (1.7%) | 60 (0.6%) |
| 35 to 64 Years | 582 (5.6%) | 1,012 (9.8%) |
| 65 to 74 Years | 153 (6.9%) | 605 (22.3%) |
| 75 Years and over | 377 (24.3%) | 1,013 (39.4%) |
Disability Class: Self-Care Difficulty
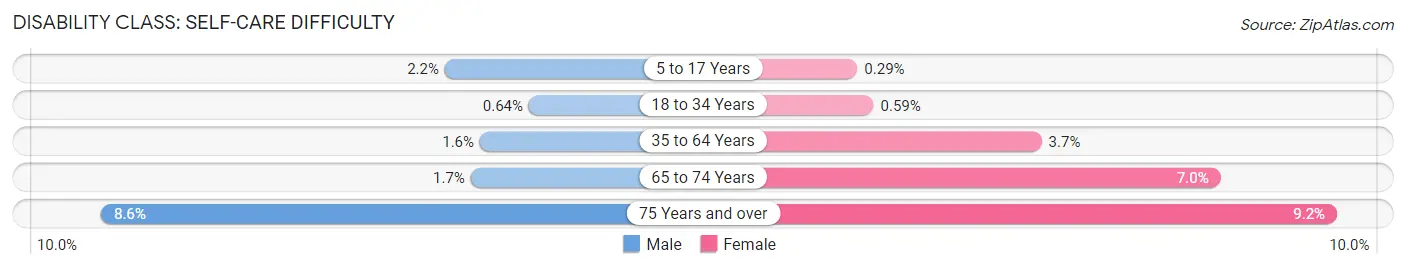
| Age Bracket | Male | Female |
| 5 to 17 Years | 88 (2.2%) | 12 (0.3%) |
| 18 to 34 Years | 70 (0.6%) | 61 (0.6%) |
| 35 to 64 Years | 162 (1.5%) | 382 (3.7%) |
| 65 to 74 Years | 38 (1.7%) | 191 (7.0%) |
| 75 Years and over | 133 (8.6%) | 236 (9.2%) |
Technology Access in Oshkosh
Computing Device Access in Oshkosh
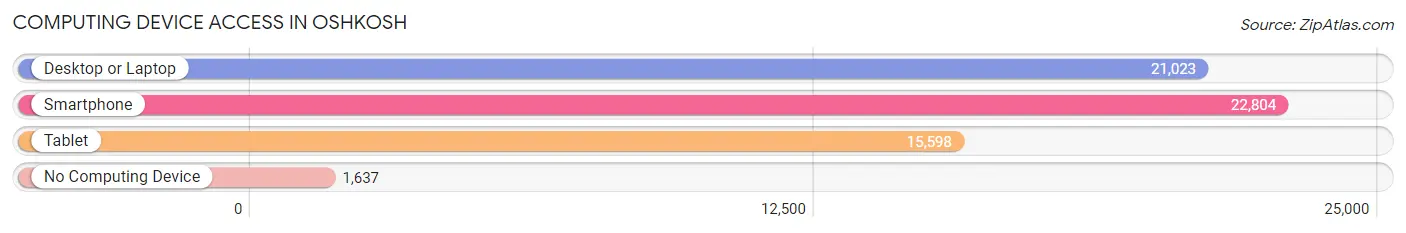
| Device Type | # Households | % Households |
| Desktop or Laptop | 21,023 | 78.5% |
| Smartphone | 22,804 | 85.2% |
| Tablet | 15,598 | 58.3% |
| No Computing Device | 1,637 | 6.1% |
| Total | 26,763 | 100.0% |
Internet Access in Oshkosh
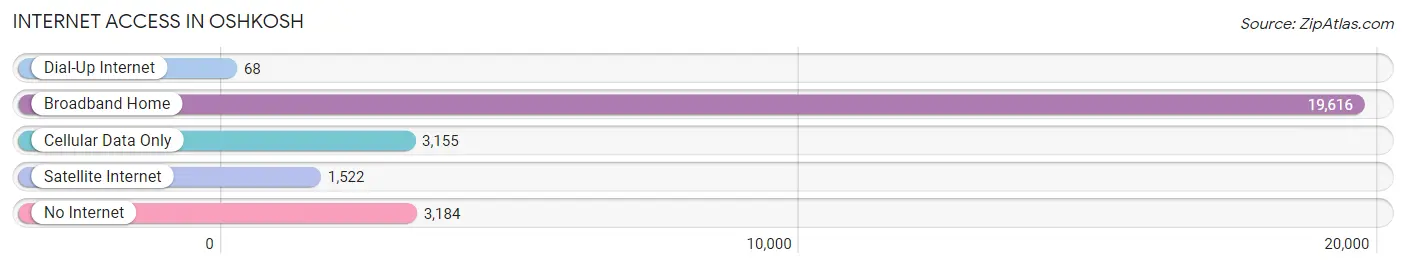
| Internet Type | # Households | % Households |
| Dial-Up Internet | 68 | 0.3% |
| Broadband Home | 19,616 | 73.3% |
| Cellular Data Only | 3,155 | 11.8% |
| Satellite Internet | 1,522 | 5.7% |
| No Internet | 3,184 | 11.9% |
| Total | 26,763 | 100.0% |
Oshkosh Summary
Oshkosh, Wisconsin is a city located in Winnebago County, Wisconsin, United States. It is situated along the Fox River, approximately 100 miles (160 km) north of Milwaukee. As of the 2010 census, the city had a population of 66,083, making it the county's largest city. The city is the economic and cultural center of the Fox Valley region, which is home to over 170,000 people.
History
The area that is now Oshkosh was originally inhabited by the Menominee, Fox, and Winnebago Native American tribes. The first European settlers arrived in the area in the early 19th century, and the city was officially founded in 1853. The city was named after Chief Oshkosh of the Menominee tribe.
In the late 19th century, Oshkosh became a major lumbering center, with several sawmills and planing mills operating in the city. The city also became a major manufacturing center, with several factories producing a variety of products, including furniture, clothing, and paper products.
In the early 20th century, Oshkosh was a major center for the automobile industry, with several car manufacturers operating in the city. The city was also home to several aircraft manufacturers, including the Oshkosh Aircraft Company, which produced the famous Oshkosh B-1 bomber.
Geography
Oshkosh is located at the confluence of the Fox River and Lake Winnebago, in the Fox Valley region of Wisconsin. The city has a total area of 24.3 square miles (62.8 km2), of which 22.7 square miles (58.9 km2) is land and 1.6 square miles (4.1 km2) is water.
The city is located in the Central Standard Time Zone and observes Daylight Saving Time
Economy
Oshkosh is a major economic center in the Fox Valley region. The city is home to several major employers, including the Oshkosh Corporation, which manufactures a variety of vehicles, including fire trucks, military vehicles, and recreational vehicles. The city is also home to several other major employers, including the University of Wisconsin-Oshkosh, the Oshkosh Area School District, and the Mercy Medical Center.
Demographics
As of the 2010 census, there were 66,083 people, 25,945 households, and 15,845 families residing in the city. The population density was 2,890.3 people per square mile (1,114.2/km2). There were 27,845 housing units at an average density of 1,219.3 per square mile (470.2/km2). The racial makeup of the city was 90.2% White, 3.3% African American, 0.7% Native American, 2.7% Asian, 0.7% from other races, and 2.3% from two or more races. Hispanic or Latino of any race were 3.2% of the population.
The median income for a household in the city was $41,945, and the median income for a family was $54,817. Males had a median income of $40,890 versus $30,945 for females. The per capita income for the city was $21,945. About 6.2% of families and 11.2% of the population were below the poverty line, including 14.2% of those under age 18 and 6.7% of those age 65 or over.
Common Questions
What is Per Capita Income in Oshkosh?
Per Capita income in Oshkosh is $30,191.
What is the Median Family Income in Oshkosh?
Median Family Income in Oshkosh is $79,958.
What is the Median Household income in Oshkosh?
Median Household Income in Oshkosh is $59,186.
What is Income or Wage Gap in Oshkosh?
Income or Wage Gap in Oshkosh is 26.0%.
Women in Oshkosh earn 74.0 cents for every dollar earned by a man.
What is Family Income Deficit in Oshkosh?
Family Income Deficit in Oshkosh is $12,439.
Families that are below poverty line in Oshkosh earn $12,439 less on average than the poverty threshold level.
What is Inequality or Gini Index in Oshkosh?
Inequality or Gini Index in Oshkosh is 0.40.
What is the Total Population of Oshkosh?
Total Population of Oshkosh is 66,373.
What is the Total Male Population of Oshkosh?
Total Male Population of Oshkosh is 33,979.
What is the Total Female Population of Oshkosh?
Total Female Population of Oshkosh is 32,394.
What is the Ratio of Males per 100 Females in Oshkosh?
There are 104.89 Males per 100 Females in Oshkosh.
What is the Ratio of Females per 100 Males in Oshkosh?
There are 95.34 Females per 100 Males in Oshkosh.
What is the Median Population Age in Oshkosh?
Median Population Age in Oshkosh is 34.0 Years.
What is the Average Family Size in Oshkosh
Average Family Size in Oshkosh is 2.9 People.
What is the Average Household Size in Oshkosh
Average Household Size in Oshkosh is 2.2 People.
How Large is the Labor Force in Oshkosh?
There are 35,951 People in the Labor Forcein in Oshkosh.
What is the Percentage of People in the Labor Force in Oshkosh?
64.2% of People are in the Labor Force in Oshkosh.
What is the Unemployment Rate in Oshkosh?
Unemployment Rate in Oshkosh is 2.9%.