Menomonie, WI Map & Demographics
Menomonie Map
Menomonie Overview
$28,021
PER CAPITA INCOME
$83,531
AVG FAMILY INCOME
$51,250
AVG HOUSEHOLD INCOME
2.5%
WAGE / INCOME GAP [ % ]
97.5¢/ $1
WAGE / INCOME GAP [ $ ]
0.45
INEQUALITY / GINI INDEX
16,563
TOTAL POPULATION
8,043
MALE POPULATION
8,520
FEMALE POPULATION
94.40
MALES / 100 FEMALES
105.93
FEMALES / 100 MALES
24.0
MEDIAN AGE
2.9
AVG FAMILY SIZE
2.1
AVG HOUSEHOLD SIZE
9,570
LABOR FORCE [ PEOPLE ]
64.6%
PERCENT IN LABOR FORCE
3.6%
UNEMPLOYMENT RATE
Menomonie Zip Codes
Menomonie Area Codes
Income in Menomonie
Income Overview in Menomonie
Per Capita Income in Menomonie is $28,021, while median incomes of families and households are $83,531 and $51,250 respectively.
| Characteristic | Number | Measure |
| Per Capita Income | 16,563 | $28,021 |
| Median Family Income | 2,388 | $83,531 |
| Mean Family Income | 2,388 | $94,880 |
| Median Household Income | 6,118 | $51,250 |
| Mean Household Income | 6,118 | $66,601 |
| Income Deficit | 2,388 | $0 |
| Wage / Income Gap (%) | 16,563 | 2.52% |
| Wage / Income Gap ($) | 16,563 | 97.48¢ per $1 |
| Gini / Inequality Index | 16,563 | 0.45 |
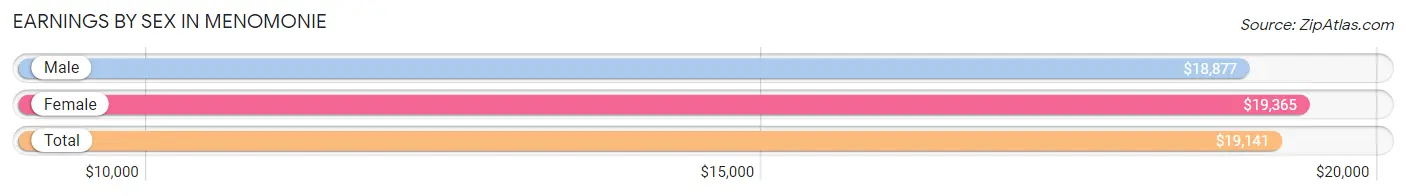
Earnings by Sex in Menomonie
Average Earnings in Menomonie are $19,141, $18,877 for men and $19,365 for women, a difference of 2.5%.
| Sex | Number | Average Earnings |
| Male | 6,025 (52.3%) | $18,877 |
| Female | 5,500 (47.7%) | $19,365 |
| Total | 11,525 (100.0%) | $19,141 |
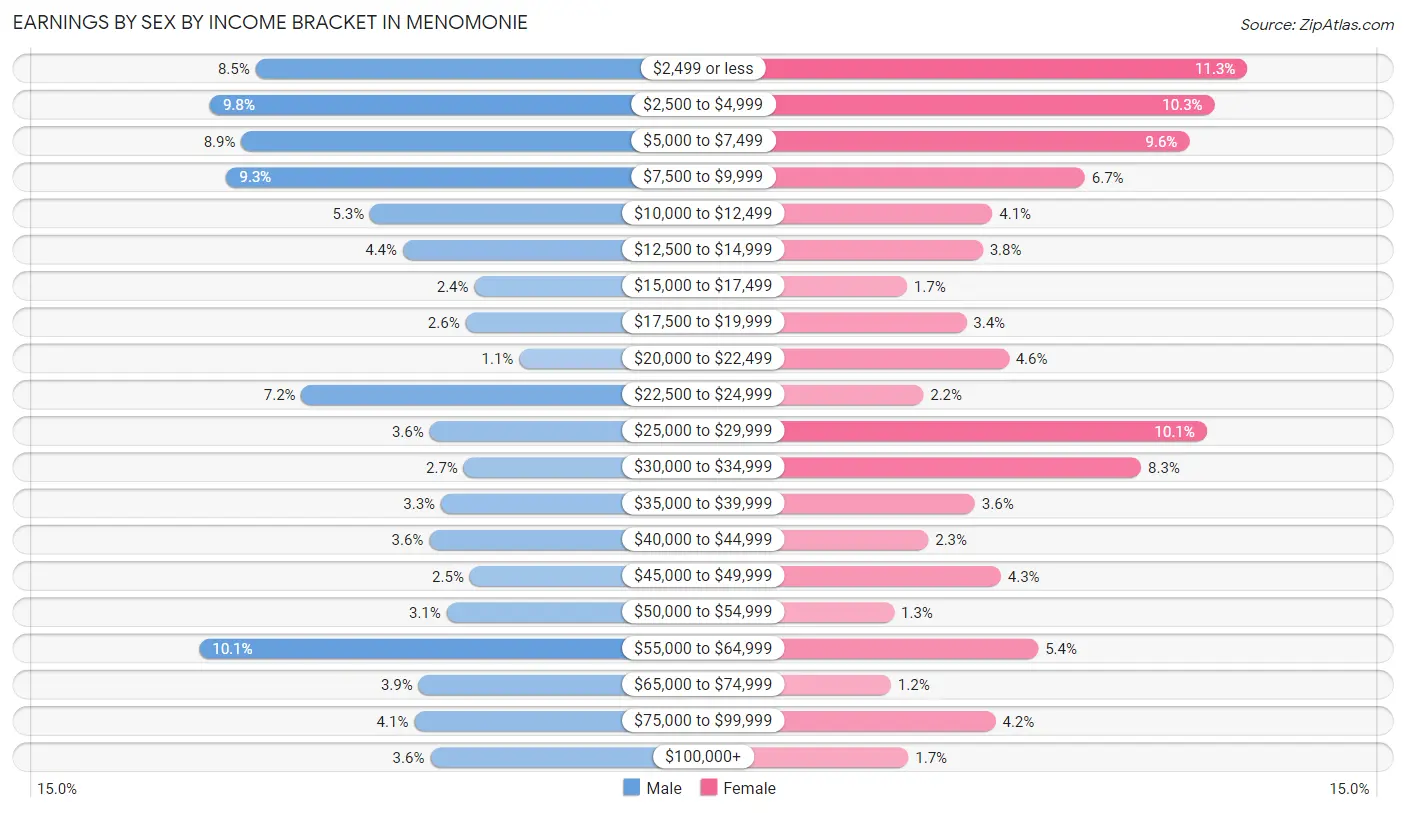
Earnings by Sex by Income Bracket in Menomonie
The most common earnings brackets in Menomonie are $55,000 to $64,999 for men (608 | 10.1%) and $2,499 or less for women (619 | 11.3%).
| Income | Male | Female |
| $2,499 or less | 513 (8.5%) | 619 (11.3%) |
| $2,500 to $4,999 | 590 (9.8%) | 568 (10.3%) |
| $5,000 to $7,499 | 537 (8.9%) | 529 (9.6%) |
| $7,500 to $9,999 | 562 (9.3%) | 368 (6.7%) |
| $10,000 to $12,499 | 319 (5.3%) | 225 (4.1%) |
| $12,500 to $14,999 | 263 (4.4%) | 210 (3.8%) |
| $15,000 to $17,499 | 142 (2.4%) | 93 (1.7%) |
| $17,500 to $19,999 | 157 (2.6%) | 185 (3.4%) |
| $20,000 to $22,499 | 66 (1.1%) | 250 (4.5%) |
| $22,500 to $24,999 | 435 (7.2%) | 118 (2.1%) |
| $25,000 to $29,999 | 218 (3.6%) | 556 (10.1%) |
| $30,000 to $34,999 | 160 (2.7%) | 455 (8.3%) |
| $35,000 to $39,999 | 199 (3.3%) | 198 (3.6%) |
| $40,000 to $44,999 | 219 (3.6%) | 126 (2.3%) |
| $45,000 to $49,999 | 150 (2.5%) | 238 (4.3%) |
| $50,000 to $54,999 | 189 (3.1%) | 73 (1.3%) |
| $55,000 to $64,999 | 608 (10.1%) | 296 (5.4%) |
| $65,000 to $74,999 | 237 (3.9%) | 68 (1.2%) |
| $75,000 to $99,999 | 244 (4.1%) | 230 (4.2%) |
| $100,000+ | 217 (3.6%) | 95 (1.7%) |
| Total | 6,025 (100.0%) | 5,500 (100.0%) |
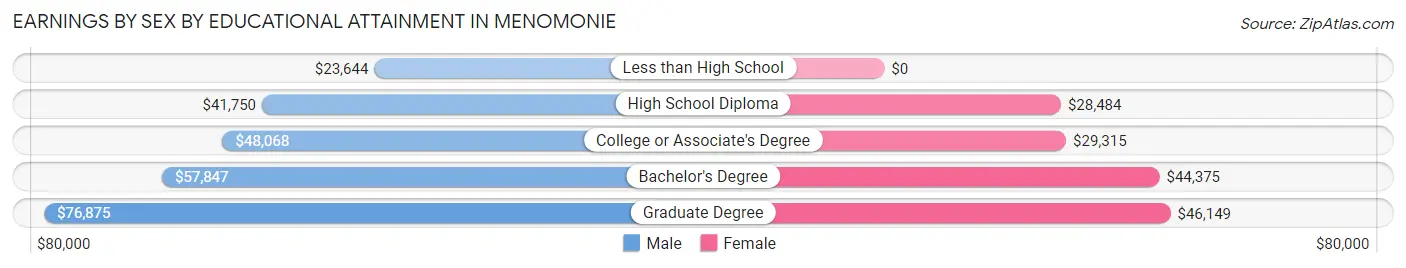
Earnings by Sex by Educational Attainment in Menomonie
Average earnings in Menomonie are $48,424 for men and $32,135 for women, a difference of 33.6%. Men with an educational attainment of graduate degree enjoy the highest average annual earnings of $76,875, while those with less than high school education earn the least with $23,644. Women with an educational attainment of graduate degree earn the most with the average annual earnings of $46,149, while those with high school diploma education have the smallest earnings of $28,484.
| Educational Attainment | Male Income | Female Income |
| Less than High School | $23,644 | $0 |
| High School Diploma | $41,750 | $28,484 |
| College or Associate's Degree | $48,068 | $29,315 |
| Bachelor's Degree | $57,847 | $44,375 |
| Graduate Degree | $76,875 | $46,149 |
| Total | $48,424 | $32,135 |
Family Income in Menomonie
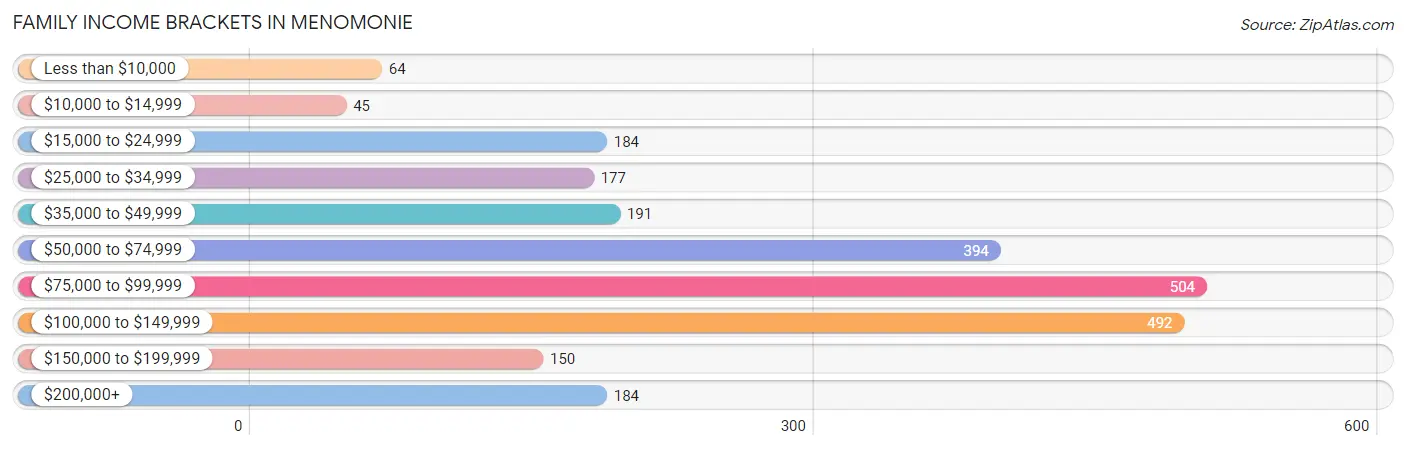
Family Income Brackets in Menomonie
According to the Menomonie family income data, there are 504 families falling into the $75,000 to $99,999 income range, which is the most common income bracket and makes up 21.1% of all families. Conversely, the $10,000 to $14,999 income bracket is the least frequent group with only 45 families (1.9%) belonging to this category.
| Income Bracket | # Families | % Families |
| Less than $10,000 | 64 | 2.7% |
| $10,000 to $14,999 | 45 | 1.9% |
| $15,000 to $24,999 | 184 | 7.7% |
| $25,000 to $34,999 | 177 | 7.4% |
| $35,000 to $49,999 | 191 | 8.0% |
| $50,000 to $74,999 | 394 | 16.5% |
| $75,000 to $99,999 | 504 | 21.1% |
| $100,000 to $149,999 | 492 | 20.6% |
| $150,000 to $199,999 | 150 | 6.3% |
| $200,000+ | 184 | 7.7% |
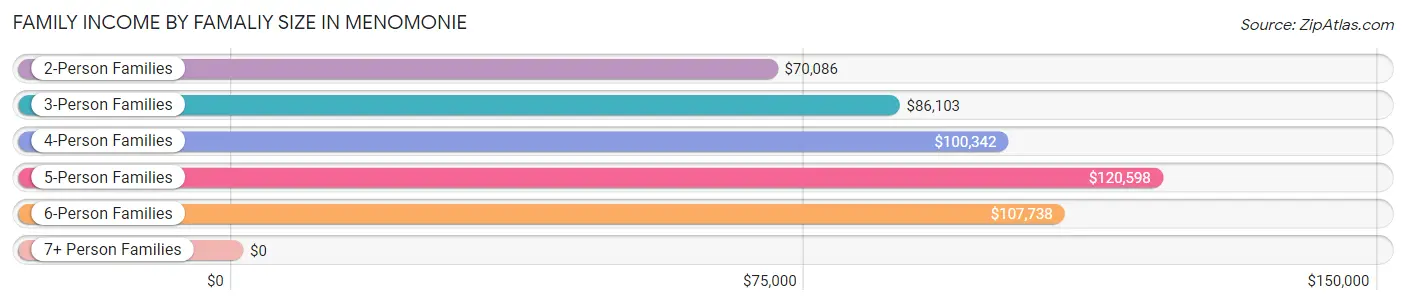
Family Income by Famaliy Size in Menomonie
5-person families (53 | 2.2%) account for the highest median family income in Menomonie with $120,598 per family, while 2-person families (1,262 | 52.8%) have the highest median income of $35,043 per family member.
| Income Bracket | # Families | Median Income |
| 2-Person Families | 1,262 (52.8%) | $70,086 |
| 3-Person Families | 450 (18.8%) | $86,103 |
| 4-Person Families | 538 (22.5%) | $100,342 |
| 5-Person Families | 53 (2.2%) | $120,598 |
| 6-Person Families | 38 (1.6%) | $107,738 |
| 7+ Person Families | 47 (2.0%) | $0 |
| Total | 2,388 (100.0%) | $83,531 |
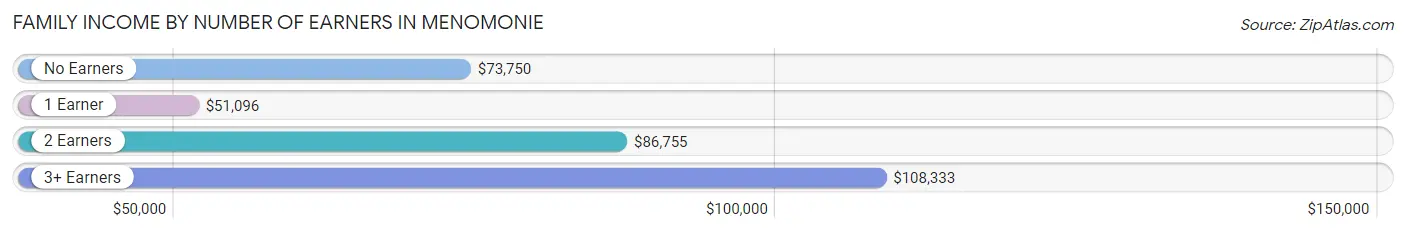
Family Income by Number of Earners in Menomonie
The median family income in Menomonie is $83,531, with families comprising 3+ earners (254) having the highest median family income of $108,333, while families with 1 earner (662) have the lowest median family income of $51,096, accounting for 10.6% and 27.7% of families, respectively.
| Number of Earners | # Families | Median Income |
| No Earners | 331 (13.9%) | $73,750 |
| 1 Earner | 662 (27.7%) | $51,096 |
| 2 Earners | 1,141 (47.8%) | $86,755 |
| 3+ Earners | 254 (10.6%) | $108,333 |
| Total | 2,388 (100.0%) | $83,531 |
Household Income in Menomonie
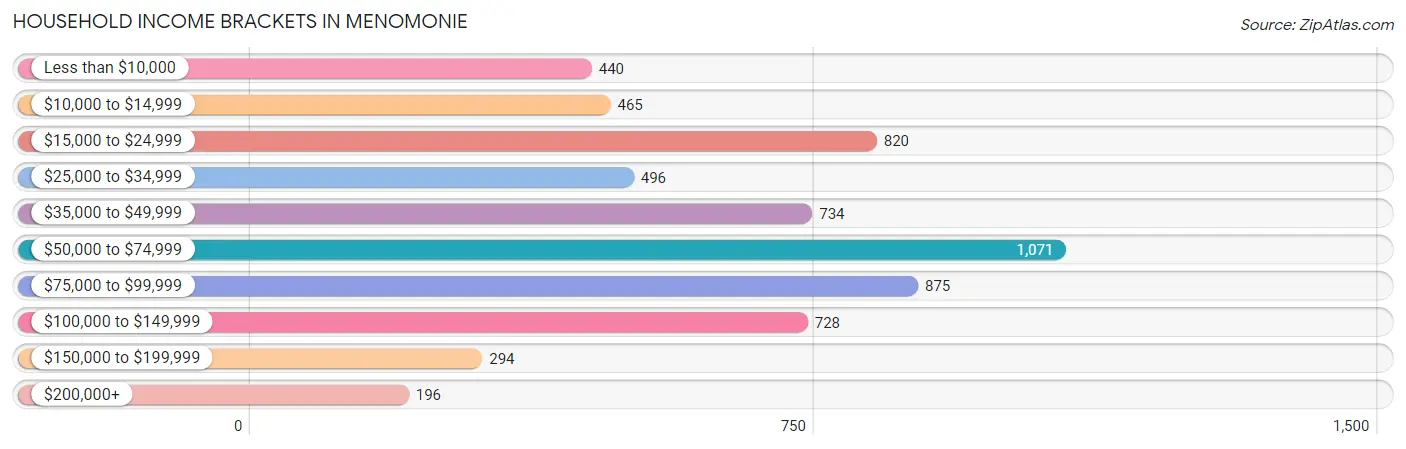
Household Income Brackets in Menomonie
With 1,071 households falling in the category, the $50,000 to $74,999 income range is the most frequent in Menomonie, accounting for 17.5% of all households. In contrast, only 196 households (3.2%) fall into the $200,000+ income bracket, making it the least populous group.
| Income Bracket | # Households | % Households |
| Less than $10,000 | 440 | 7.2% |
| $10,000 to $14,999 | 465 | 7.6% |
| $15,000 to $24,999 | 820 | 13.4% |
| $25,000 to $34,999 | 496 | 8.1% |
| $35,000 to $49,999 | 734 | 12.0% |
| $50,000 to $74,999 | 1,071 | 17.5% |
| $75,000 to $99,999 | 875 | 14.3% |
| $100,000 to $149,999 | 728 | 11.9% |
| $150,000 to $199,999 | 294 | 4.8% |
| $200,000+ | 196 | 3.2% |
Household Income by Householder Age in Menomonie
The median household income in Menomonie is $51,250, with the highest median household income of $72,414 found in the 25 to 44 years age bracket for the primary householder. A total of 1,936 households (31.6%) fall into this category. Meanwhile, the 15 to 24 years age bracket for the primary householder has the lowest median household income of $35,524, with 1,244 households (20.3%) in this group.
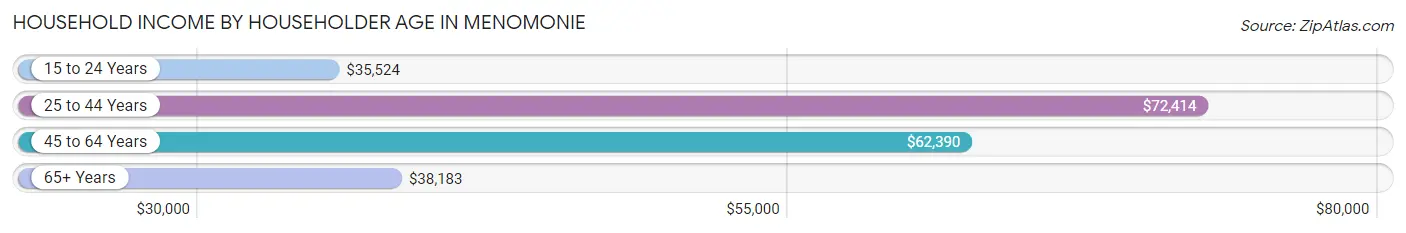
| Income Bracket | # Households | Median Income |
| 15 to 24 Years | 1,244 (20.3%) | $35,524 |
| 25 to 44 Years | 1,936 (31.6%) | $72,414 |
| 45 to 64 Years | 1,447 (23.6%) | $62,390 |
| 65+ Years | 1,491 (24.4%) | $38,183 |
| Total | 6,118 (100.0%) | $51,250 |
Poverty in Menomonie
Income Below Poverty by Sex and Age in Menomonie
With 20.0% poverty level for males and 19.2% for females among the residents of Menomonie, 5 year old males and 18 to 24 year old females are the most vulnerable to poverty, with 7 males (53.8%) and 676 females (33.2%) in their respective age groups living below the poverty level.
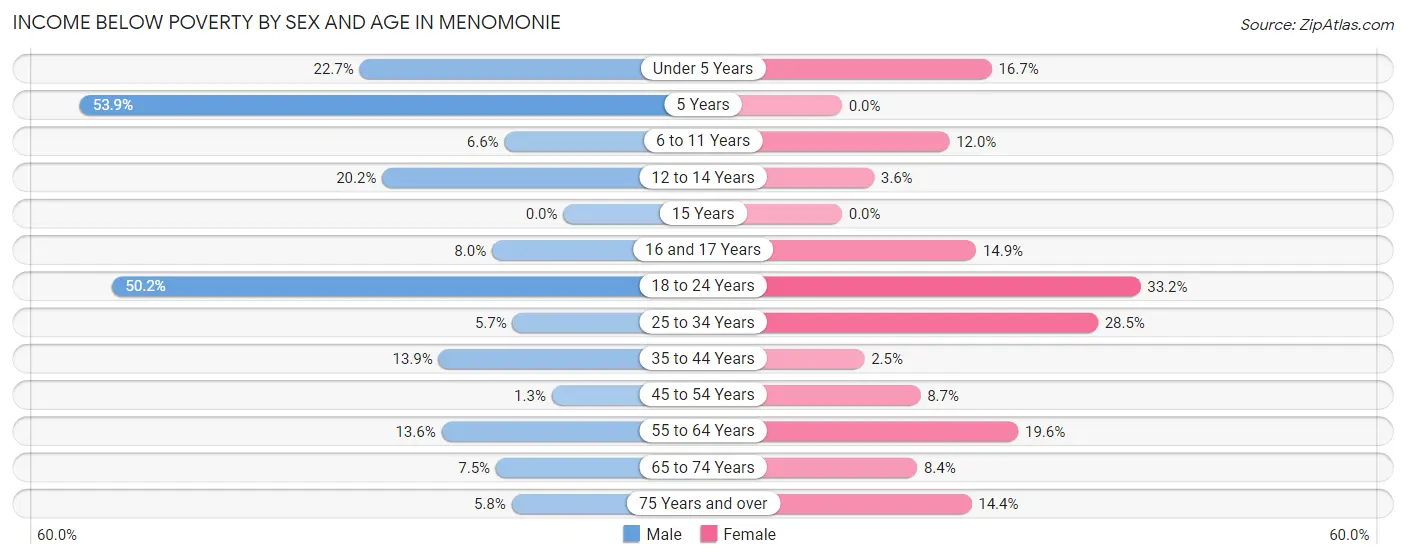
| Age Bracket | Male | Female |
| Under 5 Years | 37 (22.7%) | 57 (16.7%) |
| 5 Years | 7 (53.8%) | 0 (0.0%) |
| 6 to 11 Years | 29 (6.6%) | 36 (12.0%) |
| 12 to 14 Years | 24 (20.2%) | 6 (3.6%) |
| 15 Years | 0 (0.0%) | 0 (0.0%) |
| 16 and 17 Years | 7 (8.0%) | 13 (14.9%) |
| 18 to 24 Years | 811 (50.2%) | 676 (33.2%) |
| 25 to 34 Years | 50 (5.7%) | 242 (28.5%) |
| 35 to 44 Years | 108 (13.9%) | 17 (2.5%) |
| 45 to 54 Years | 8 (1.3%) | 49 (8.7%) |
| 55 to 64 Years | 79 (13.6%) | 127 (19.6%) |
| 65 to 74 Years | 31 (7.5%) | 64 (8.4%) |
| 75 Years and over | 16 (5.8%) | 89 (14.4%) |
| Total | 1,207 (20.0%) | 1,376 (19.2%) |
Income Above Poverty by Sex and Age in Menomonie
According to the poverty statistics in Menomonie, males aged 15 years and females aged 5 years are the age groups that are most secure financially, with 100.0% of males and 100.0% of females in these age groups living above the poverty line.
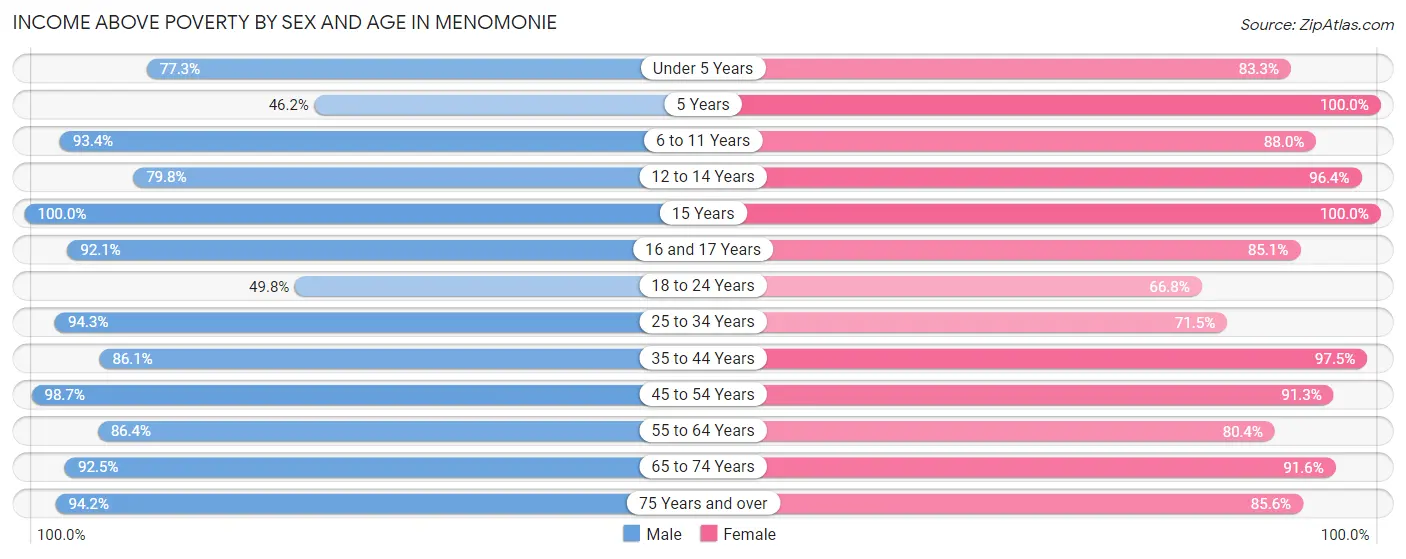
| Age Bracket | Male | Female |
| Under 5 Years | 126 (77.3%) | 285 (83.3%) |
| 5 Years | 6 (46.2%) | 99 (100.0%) |
| 6 to 11 Years | 413 (93.4%) | 265 (88.0%) |
| 12 to 14 Years | 95 (79.8%) | 162 (96.4%) |
| 15 Years | 33 (100.0%) | 35 (100.0%) |
| 16 and 17 Years | 81 (92.0%) | 74 (85.1%) |
| 18 to 24 Years | 804 (49.8%) | 1,358 (66.8%) |
| 25 to 34 Years | 834 (94.3%) | 607 (71.5%) |
| 35 to 44 Years | 669 (86.1%) | 663 (97.5%) |
| 45 to 54 Years | 612 (98.7%) | 512 (91.3%) |
| 55 to 64 Years | 503 (86.4%) | 520 (80.4%) |
| 65 to 74 Years | 382 (92.5%) | 701 (91.6%) |
| 75 Years and over | 262 (94.2%) | 528 (85.6%) |
| Total | 4,820 (80.0%) | 5,809 (80.8%) |
Income Below Poverty Among Married-Couple Families in Menomonie
The poverty statistics for married-couple families in Menomonie show that 2.1% or 36 of the total 1,736 families live below the poverty line. Families with 5 or more children have the highest poverty rate of 100.0%, comprising of 12 families. On the other hand, families with 1 or 2 children have the lowest poverty rate of 0.0%, which includes 0 families.
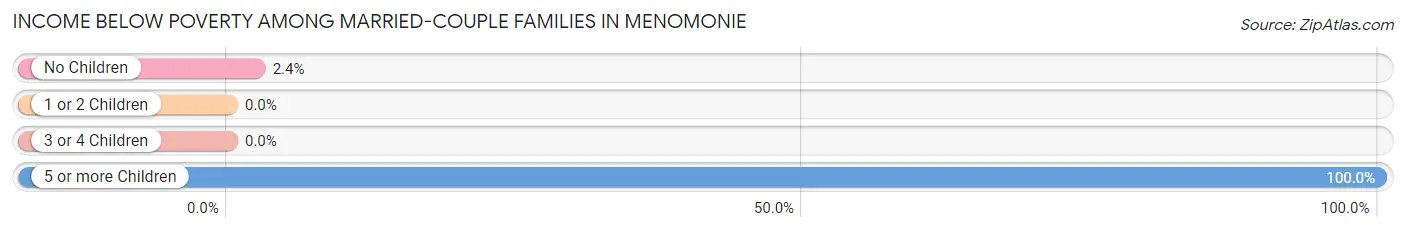
| Children | Above Poverty | Below Poverty |
| No Children | 973 (97.6%) | 24 (2.4%) |
| 1 or 2 Children | 659 (100.0%) | 0 (0.0%) |
| 3 or 4 Children | 68 (100.0%) | 0 (0.0%) |
| 5 or more Children | 0 (0.0%) | 12 (100.0%) |
| Total | 1,700 (97.9%) | 36 (2.1%) |
Income Below Poverty Among Single-Parent Households in Menomonie
According to the poverty data in Menomonie, 9.4% or 21 single-father households and 33.4% or 143 single-mother households are living below the poverty line. Among single-father households, those with no children have the highest poverty rate, with 14 households (17.5%) experiencing poverty. Likewise, among single-mother households, those with 3 or 4 children have the highest poverty rate, with 7 households (63.6%) falling below the poverty line.
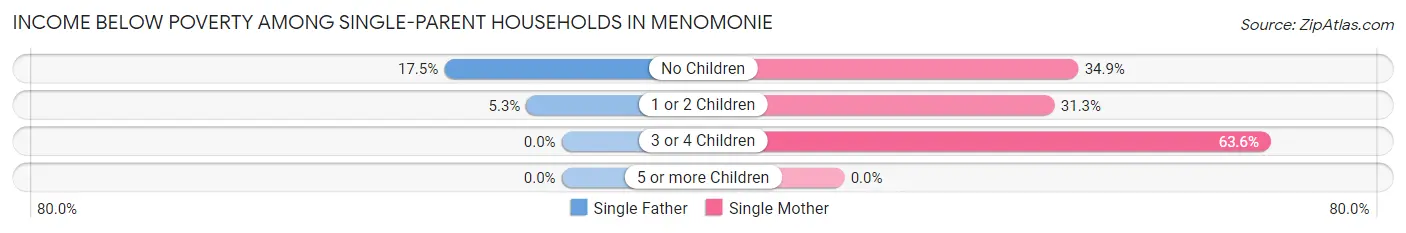
| Children | Single Father | Single Mother |
| No Children | 14 (17.5%) | 53 (34.9%) |
| 1 or 2 Children | 7 (5.3%) | 83 (31.3%) |
| 3 or 4 Children | 0 (0.0%) | 7 (63.6%) |
| 5 or more Children | 0 (0.0%) | 0 (0.0%) |
| Total | 21 (9.4%) | 143 (33.4%) |
Income Below Poverty Among Married-Couple vs Single-Parent Households in Menomonie
The poverty data for Menomonie shows that 36 of the married-couple family households (2.1%) and 164 of the single-parent households (25.2%) are living below the poverty level. Within the married-couple family households, those with 5 or more children have the highest poverty rate, with 12 households (100.0%) falling below the poverty line. Among the single-parent households, those with 3 or 4 children have the highest poverty rate, with 7 household (31.8%) living below poverty.
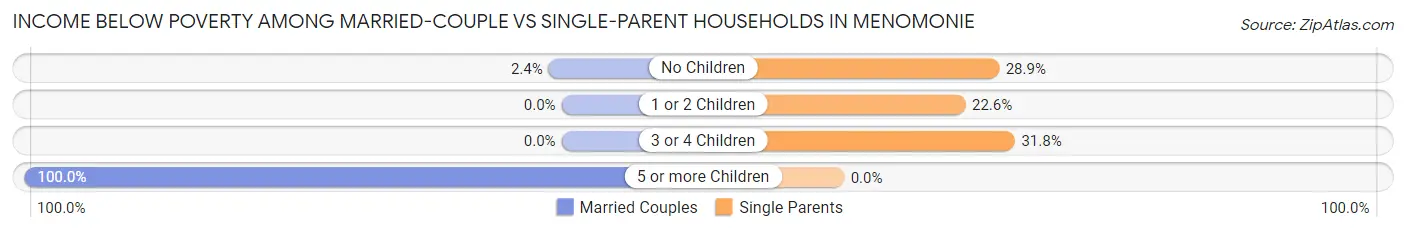
| Children | Married-Couple Families | Single-Parent Households |
| No Children | 24 (2.4%) | 67 (28.9%) |
| 1 or 2 Children | 0 (0.0%) | 90 (22.6%) |
| 3 or 4 Children | 0 (0.0%) | 7 (31.8%) |
| 5 or more Children | 12 (100.0%) | 0 (0.0%) |
| Total | 36 (2.1%) | 164 (25.2%) |
Race in Menomonie
The most populous races in Menomonie are White / Caucasian (15,404 | 93.0%), Asian (487 | 2.9%), and Two or more Races (446 | 2.7%).
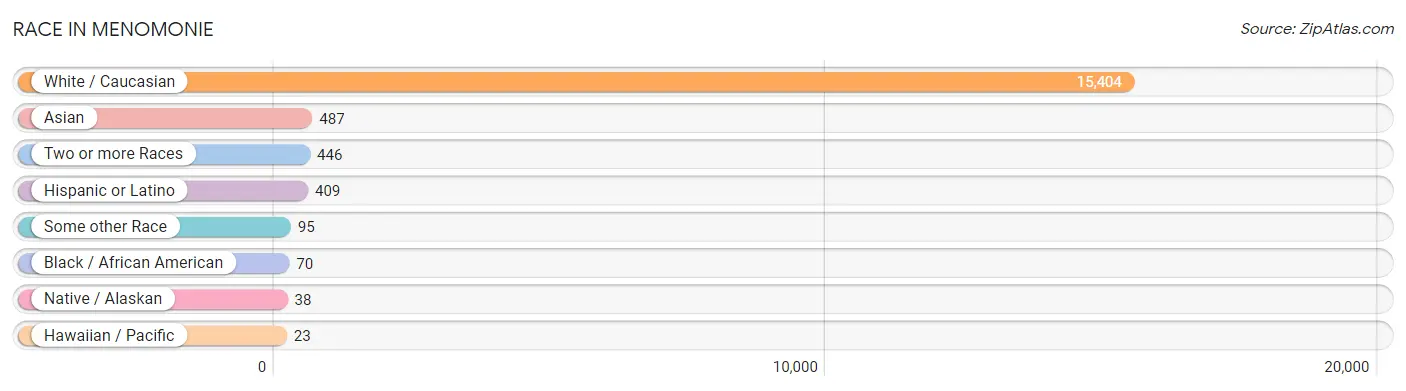
| Race | # Population | % Population |
| Asian | 487 | 2.9% |
| Black / African American | 70 | 0.4% |
| Hawaiian / Pacific | 23 | 0.1% |
| Hispanic or Latino | 409 | 2.5% |
| Native / Alaskan | 38 | 0.2% |
| White / Caucasian | 15,404 | 93.0% |
| Two or more Races | 446 | 2.7% |
| Some other Race | 95 | 0.6% |
| Total | 16,563 | 100.0% |
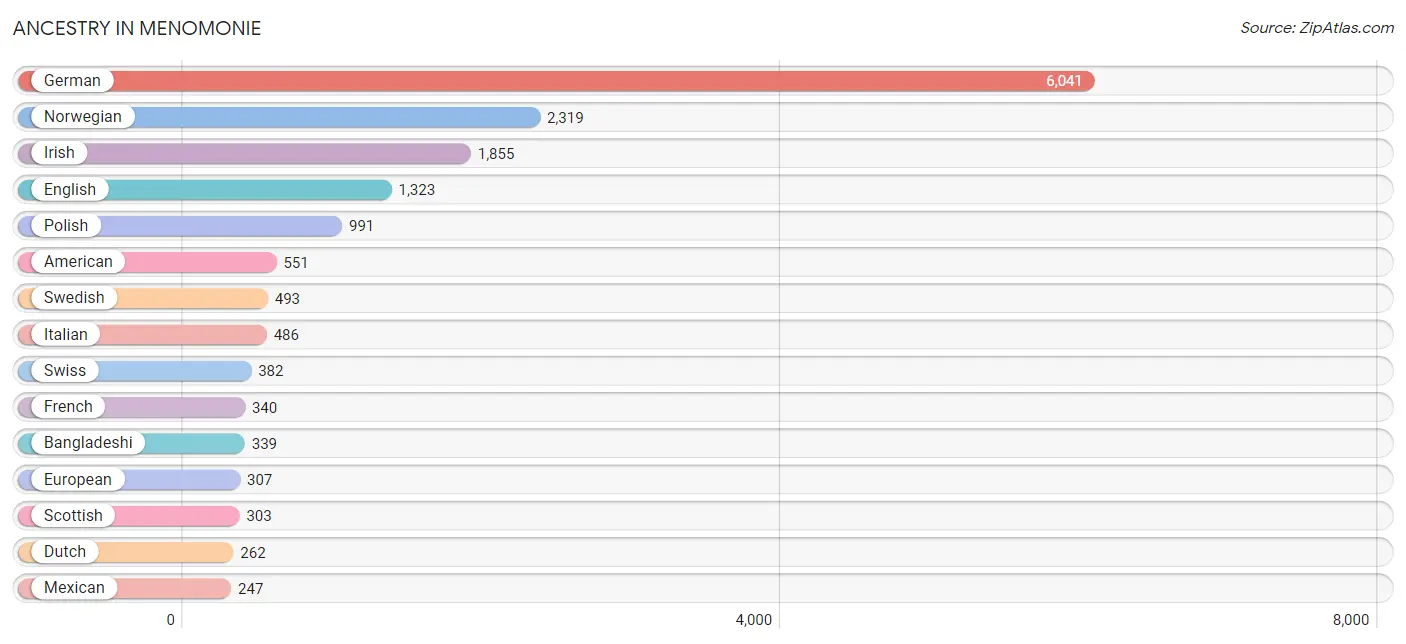
Ancestry in Menomonie
The most populous ancestries reported in Menomonie are German (6,041 | 36.5%), Norwegian (2,319 | 14.0%), Irish (1,855 | 11.2%), English (1,323 | 8.0%), and Polish (991 | 6.0%), together accounting for 75.6% of all Menomonie residents.
| Ancestry | # Population | % Population |
| African | 3 | 0.0% |
| Alaska Native | 1 | 0.0% |
| American | 551 | 3.3% |
| Arab | 86 | 0.5% |
| Austrian | 80 | 0.5% |
| Bangladeshi | 339 | 2.1% |
| Belgian | 33 | 0.2% |
| Blackfeet | 7 | 0.0% |
| British | 38 | 0.2% |
| Burmese | 39 | 0.2% |
| Canadian | 56 | 0.3% |
| Celtic | 8 | 0.1% |
| Central American | 57 | 0.3% |
| Cherokee | 17 | 0.1% |
| Chippewa | 78 | 0.5% |
| Colombian | 10 | 0.1% |
| Croatian | 26 | 0.2% |
| Cuban | 9 | 0.1% |
| Czech | 157 | 0.9% |
| Czechoslovakian | 112 | 0.7% |
| Danish | 165 | 1.0% |
| Dutch | 262 | 1.6% |
| Eastern European | 41 | 0.3% |
| Ecuadorian | 11 | 0.1% |
| English | 1,323 | 8.0% |
| European | 307 | 1.8% |
| Filipino | 56 | 0.3% |
| Finnish | 111 | 0.7% |
| French | 340 | 2.1% |
| French Canadian | 57 | 0.3% |
| German | 6,041 | 36.5% |
| Guatemalan | 18 | 0.1% |
| Honduran | 15 | 0.1% |
| Hungarian | 33 | 0.2% |
| Indian (Asian) | 100 | 0.6% |
| Iranian | 2 | 0.0% |
| Irish | 1,855 | 11.2% |
| Iroquois | 8 | 0.1% |
| Italian | 486 | 2.9% |
| Korean | 77 | 0.5% |
| Latvian | 10 | 0.1% |
| Lithuanian | 66 | 0.4% |
| Mexican | 247 | 1.5% |
| Moroccan | 8 | 0.1% |
| Northern European | 105 | 0.6% |
| Norwegian | 2,319 | 14.0% |
| Palestinian | 7 | 0.0% |
| Polish | 991 | 6.0% |
| Puerto Rican | 19 | 0.1% |
| Russian | 54 | 0.3% |
| Salvadoran | 24 | 0.1% |
| Samoan | 23 | 0.1% |
| Scandinavian | 151 | 0.9% |
| Scotch-Irish | 125 | 0.7% |
| Scottish | 303 | 1.8% |
| Slovak | 62 | 0.4% |
| Slovene | 8 | 0.1% |
| Somali | 6 | 0.0% |
| South American | 21 | 0.1% |
| Spanish | 56 | 0.3% |
| Subsaharan African | 37 | 0.2% |
| Swedish | 493 | 3.0% |
| Swiss | 382 | 2.3% |
| Thai | 60 | 0.4% |
| Turkish | 16 | 0.1% |
| Ukrainian | 69 | 0.4% |
| Welsh | 37 | 0.2% | View All 67 Rows |
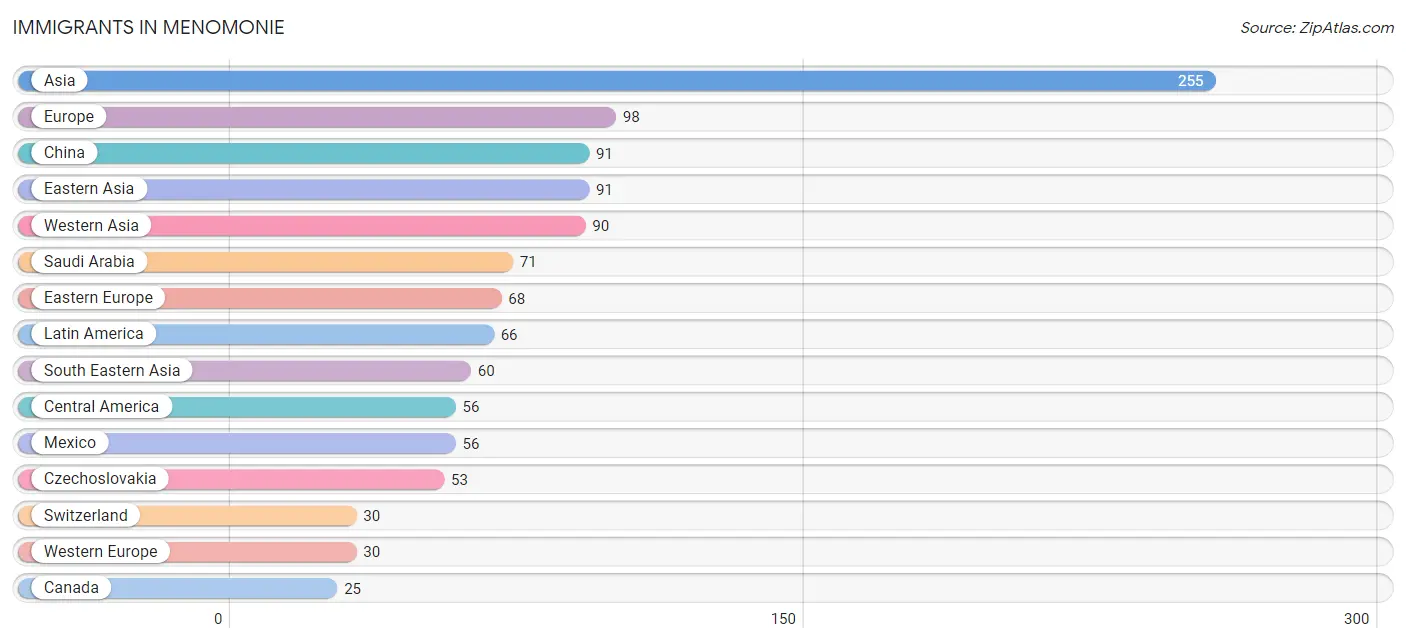
Immigrants in Menomonie
The most numerous immigrant groups reported in Menomonie came from Asia (255 | 1.5%), Europe (98 | 0.6%), China (91 | 0.5%), Eastern Asia (91 | 0.5%), and Western Asia (90 | 0.5%), together accounting for 3.8% of all Menomonie residents.
| Immigration Origin | # Population | % Population |
| Asia | 255 | 1.5% |
| Canada | 25 | 0.2% |
| Central America | 56 | 0.3% |
| China | 91 | 0.5% |
| Colombia | 10 | 0.1% |
| Czechoslovakia | 53 | 0.3% |
| Eastern Asia | 91 | 0.5% |
| Eastern Europe | 68 | 0.4% |
| Europe | 98 | 0.6% |
| India | 14 | 0.1% |
| Laos | 23 | 0.1% |
| Latin America | 66 | 0.4% |
| Mexico | 56 | 0.3% |
| Moldova | 15 | 0.1% |
| Philippines | 12 | 0.1% |
| Saudi Arabia | 71 | 0.4% |
| South America | 10 | 0.1% |
| South Central Asia | 14 | 0.1% |
| South Eastern Asia | 60 | 0.4% |
| Switzerland | 30 | 0.2% |
| Taiwan | 13 | 0.1% |
| Thailand | 25 | 0.2% |
| Turkey | 16 | 0.1% |
| Western Asia | 90 | 0.5% |
| Western Europe | 30 | 0.2% | View All 25 Rows |
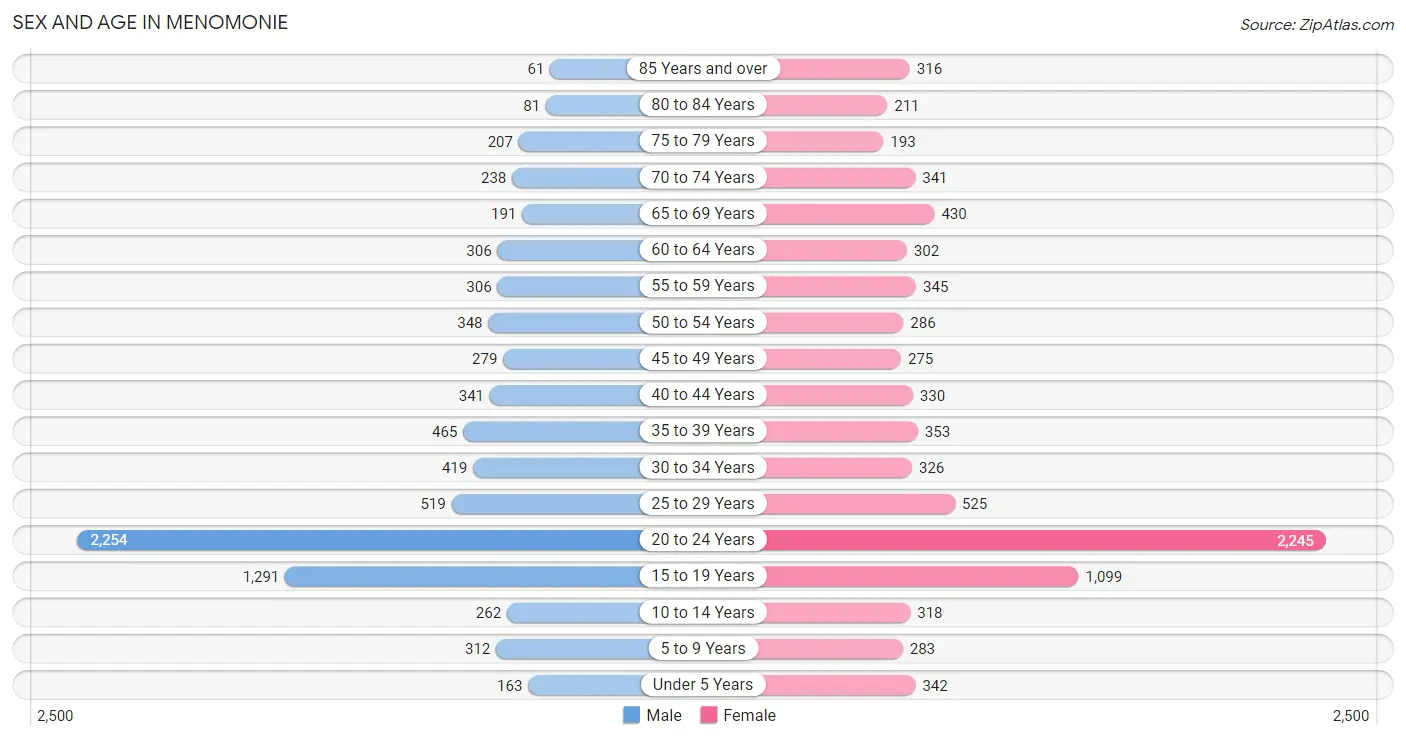
Sex and Age in Menomonie
Sex and Age in Menomonie
The most populous age groups in Menomonie are 20 to 24 Years (2,254 | 28.0%) for men and 20 to 24 Years (2,245 | 26.4%) for women.
| Age Bracket | Male | Female |
| Under 5 Years | 163 (2.0%) | 342 (4.0%) |
| 5 to 9 Years | 312 (3.9%) | 283 (3.3%) |
| 10 to 14 Years | 262 (3.3%) | 318 (3.7%) |
| 15 to 19 Years | 1,291 (16.1%) | 1,099 (12.9%) |
| 20 to 24 Years | 2,254 (28.0%) | 2,245 (26.4%) |
| 25 to 29 Years | 519 (6.5%) | 525 (6.2%) |
| 30 to 34 Years | 419 (5.2%) | 326 (3.8%) |
| 35 to 39 Years | 465 (5.8%) | 353 (4.1%) |
| 40 to 44 Years | 341 (4.2%) | 330 (3.9%) |
| 45 to 49 Years | 279 (3.5%) | 275 (3.2%) |
| 50 to 54 Years | 348 (4.3%) | 286 (3.4%) |
| 55 to 59 Years | 306 (3.8%) | 345 (4.1%) |
| 60 to 64 Years | 306 (3.8%) | 302 (3.5%) |
| 65 to 69 Years | 191 (2.4%) | 430 (5.1%) |
| 70 to 74 Years | 238 (3.0%) | 341 (4.0%) |
| 75 to 79 Years | 207 (2.6%) | 193 (2.3%) |
| 80 to 84 Years | 81 (1.0%) | 211 (2.5%) |
| 85 Years and over | 61 (0.8%) | 316 (3.7%) |
| Total | 8,043 (100.0%) | 8,520 (100.0%) |
Families and Households in Menomonie
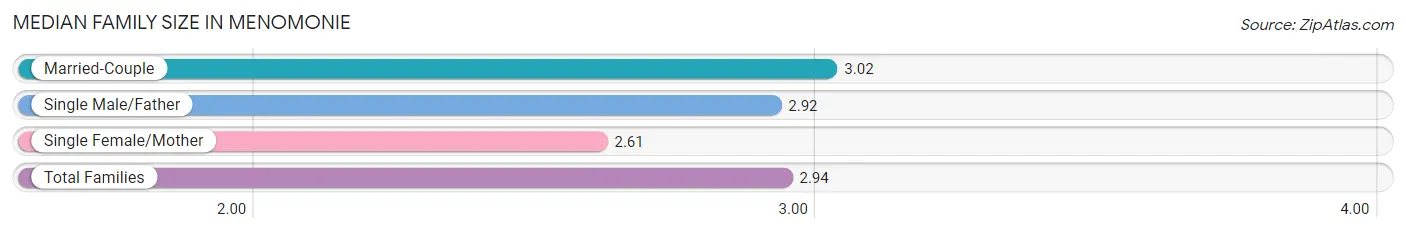
Median Family Size in Menomonie
The median family size in Menomonie is 2.94 persons per family, with married-couple families (1,736 | 72.7%) accounting for the largest median family size of 3.02 persons per family. On the other hand, single female/mother families (428 | 17.9%) represent the smallest median family size with 2.61 persons per family.
| Family Type | # Families | Family Size |
| Married-Couple | 1,736 (72.7%) | 3.02 |
| Single Male/Father | 224 (9.4%) | 2.92 |
| Single Female/Mother | 428 (17.9%) | 2.61 |
| Total Families | 2,388 (100.0%) | 2.94 |
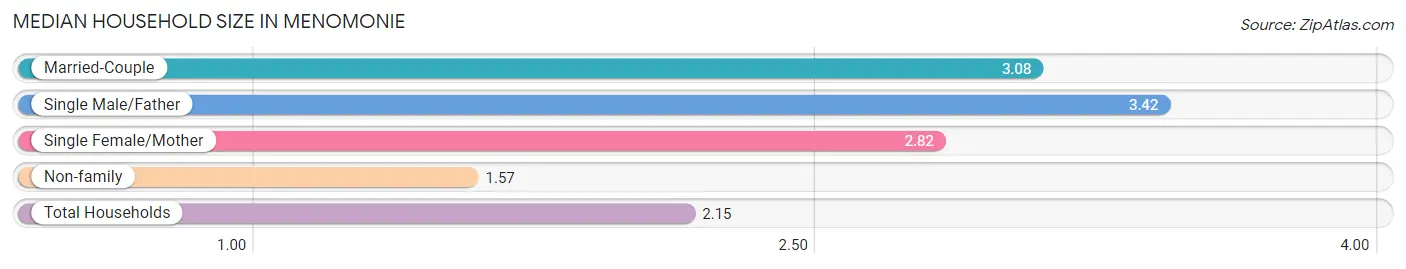
Median Household Size in Menomonie
The median household size in Menomonie is 2.15 persons per household, with single male/father households (224 | 3.7%) accounting for the largest median household size of 3.42 persons per household. non-family households (3,730 | 61.0%) represent the smallest median household size with 1.57 persons per household.
| Household Type | # Households | Household Size |
| Married-Couple | 1,736 (28.4%) | 3.08 |
| Single Male/Father | 224 (3.7%) | 3.42 |
| Single Female/Mother | 428 (7.0%) | 2.82 |
| Non-family | 3,730 (61.0%) | 1.57 |
| Total Households | 6,118 (100.0%) | 2.15 |
Household Size by Marriage Status in Menomonie
Out of a total of 6,118 households in Menomonie, 2,388 (39.0%) are family households, while 3,730 (61.0%) are nonfamily households. The most numerous type of family households are 2-person households, comprising 1,131, and the most common type of nonfamily households are 1-person households, comprising 2,698.
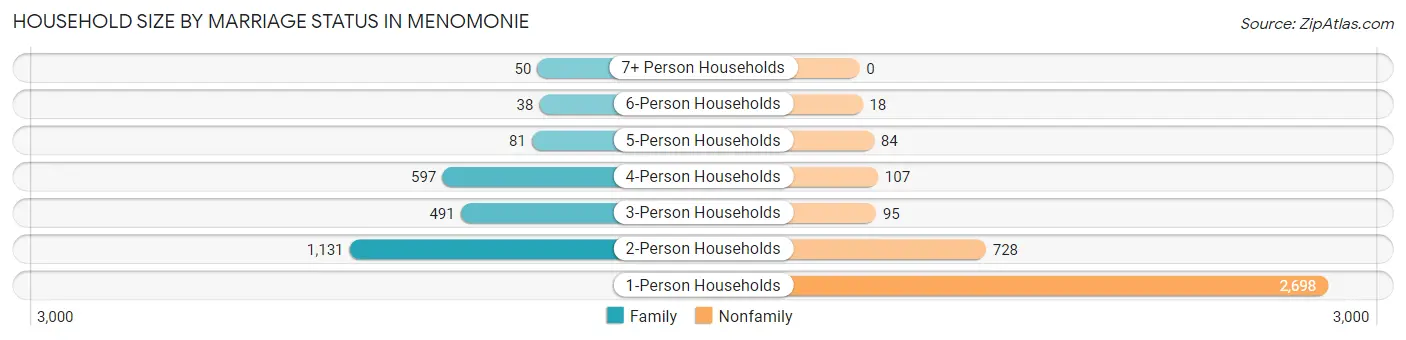
| Household Size | Family Households | Nonfamily Households |
| 1-Person Households | - | 2,698 (44.1%) |
| 2-Person Households | 1,131 (18.5%) | 728 (11.9%) |
| 3-Person Households | 491 (8.0%) | 95 (1.5%) |
| 4-Person Households | 597 (9.8%) | 107 (1.8%) |
| 5-Person Households | 81 (1.3%) | 84 (1.4%) |
| 6-Person Households | 38 (0.6%) | 18 (0.3%) |
| 7+ Person Households | 50 (0.8%) | 0 (0.0%) |
| Total | 2,388 (39.0%) | 3,730 (61.0%) |
Female Fertility in Menomonie
Fertility by Age in Menomonie
Average fertility rate in Menomonie is 35.0 births per 1,000 women. Women in the age bracket of 35 to 50 years have the highest fertility rate with 75.0 births per 1,000 women. Women in the age bracket of 20 to 34 years acount for 57.5% of all women with births.
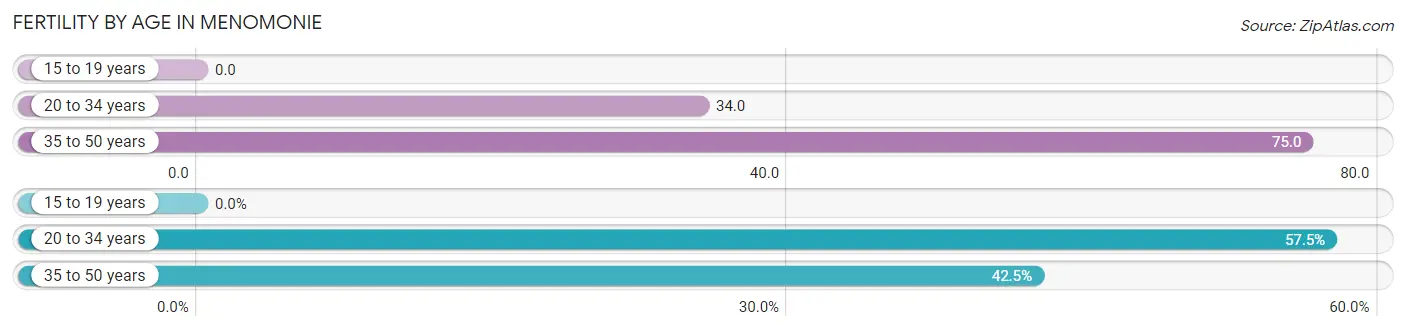
| Age Bracket | Women with Births | Births / 1,000 Women |
| 15 to 19 years | 0 (0.0%) | 0.0 |
| 20 to 34 years | 104 (57.5%) | 34.0 |
| 35 to 50 years | 77 (42.5%) | 75.0 |
| Total | 181 (100.0%) | 35.0 |
Fertility by Age by Marriage Status in Menomonie
96.1% of women with births (181) in Menomonie are married. The highest percentage of unmarried women with births falls into 20 to 34 years age bracket with 6.7% of them unmarried at the time of birth, while the lowest percentage of unmarried women with births belong to 35 to 50 years age bracket with 0.0% of them unmarried.
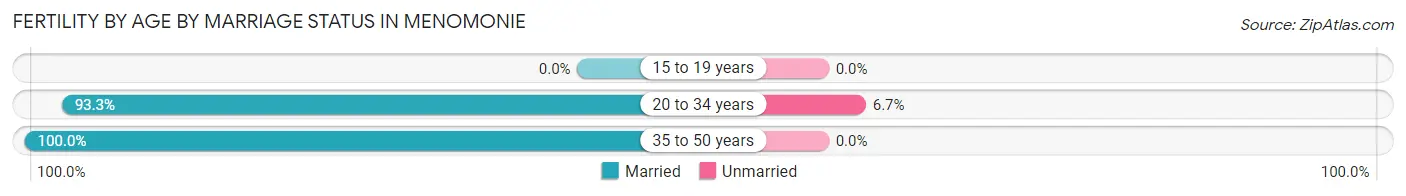
| Age Bracket | Married | Unmarried |
| 15 to 19 years | 0 (0.0%) | 0 (0.0%) |
| 20 to 34 years | 97 (93.3%) | 7 (6.7%) |
| 35 to 50 years | 77 (100.0%) | 0 (0.0%) |
| Total | 174 (96.1%) | 7 (3.9%) |
Fertility by Education in Menomonie
Average fertility rate in Menomonie is 35.0 births per 1,000 women. Women with the education attainment of less than high school have the highest fertility rate of 67.0 births per 1,000 women, while women with the education attainment of bachelor's degree have the lowest fertility at 15.0 births per 1,000 women. Women with the education attainment of college or associate's degree represent 44.2% of all women with births.
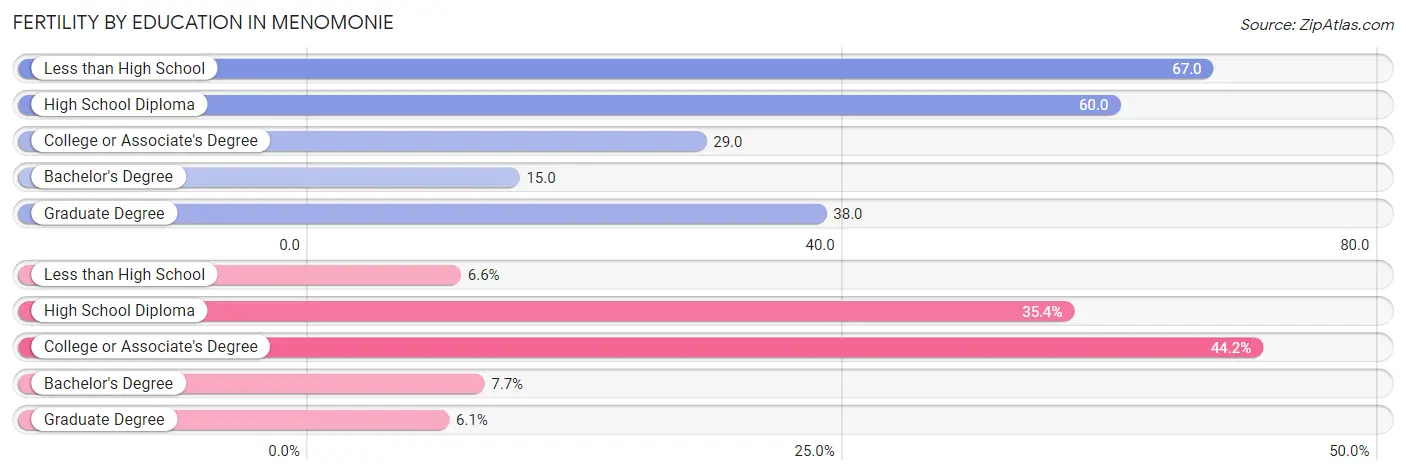
| Educational Attainment | Women with Births | Births / 1,000 Women |
| Less than High School | 12 (6.6%) | 67.0 |
| High School Diploma | 64 (35.4%) | 60.0 |
| College or Associate's Degree | 80 (44.2%) | 29.0 |
| Bachelor's Degree | 14 (7.7%) | 15.0 |
| Graduate Degree | 11 (6.1%) | 38.0 |
| Total | 181 (100.0%) | 35.0 |
Fertility by Education by Marriage Status in Menomonie
3.9% of women with births in Menomonie are unmarried. Women with the educational attainment of less than high school are most likely to be married with 100.0% of them married at childbirth, while women with the educational attainment of college or associate's degree are least likely to be married with 8.7% of them unmarried at childbirth.
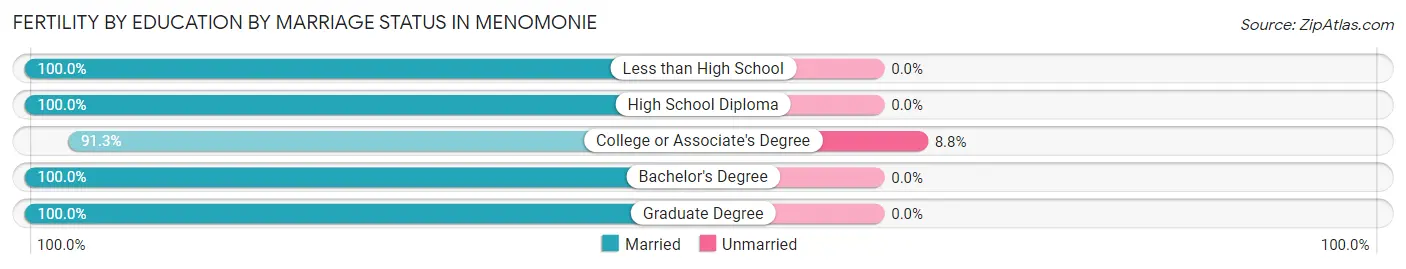
| Educational Attainment | Married | Unmarried |
| Less than High School | 12 (100.0%) | 0 (0.0%) |
| High School Diploma | 64 (100.0%) | 0 (0.0%) |
| College or Associate's Degree | 73 (91.2%) | 7 (8.7%) |
| Bachelor's Degree | 14 (100.0%) | 0 (0.0%) |
| Graduate Degree | 11 (100.0%) | 0 (0.0%) |
| Total | 174 (96.1%) | 7 (3.9%) |
Employment Characteristics in Menomonie
Employment by Class of Employer in Menomonie
Among the 8,803 employed individuals in Menomonie, private company employees (6,120 | 69.5%), state government employees (997 | 11.3%), and local government employees (586 | 6.7%) make up the most common classes of employment.
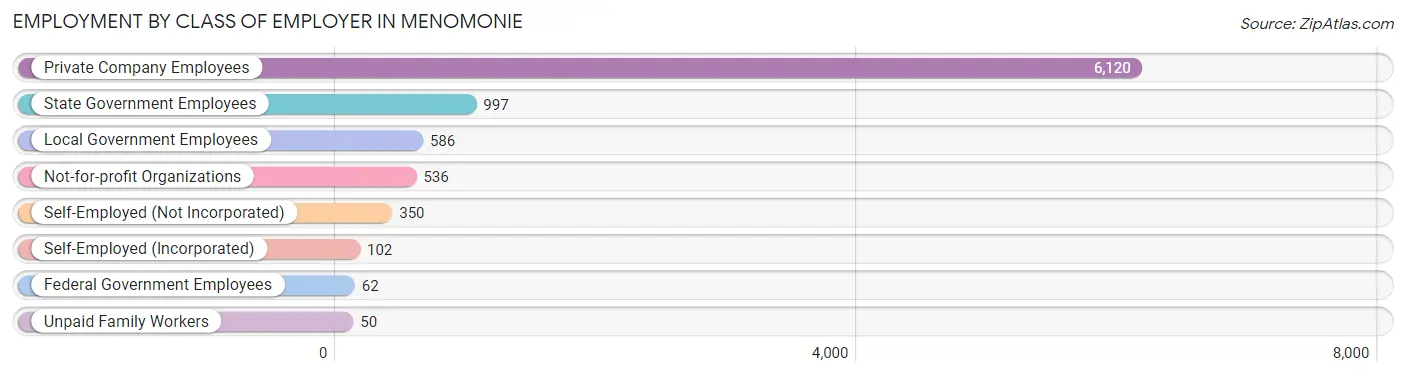
| Employer Class | # Employees | % Employees |
| Private Company Employees | 6,120 | 69.5% |
| Self-Employed (Incorporated) | 102 | 1.2% |
| Self-Employed (Not Incorporated) | 350 | 4.0% |
| Not-for-profit Organizations | 536 | 6.1% |
| Local Government Employees | 586 | 6.7% |
| State Government Employees | 997 | 11.3% |
| Federal Government Employees | 62 | 0.7% |
| Unpaid Family Workers | 50 | 0.6% |
| Total | 8,803 | 100.0% |
Employment Status by Age in Menomonie
According to the labor force statistics for Menomonie, out of the total population over 16 years of age (14,815), 64.6% or 9,570 individuals are in the labor force, with 3.6% or 345 of them unemployed. The age group with the highest labor force participation rate is 25 to 29 years, with 91.4% or 954 individuals in the labor force. Within the labor force, the 55 to 59 years age range has the highest percentage of unemployed individuals, with 8.2% or 37 of them being unemployed.
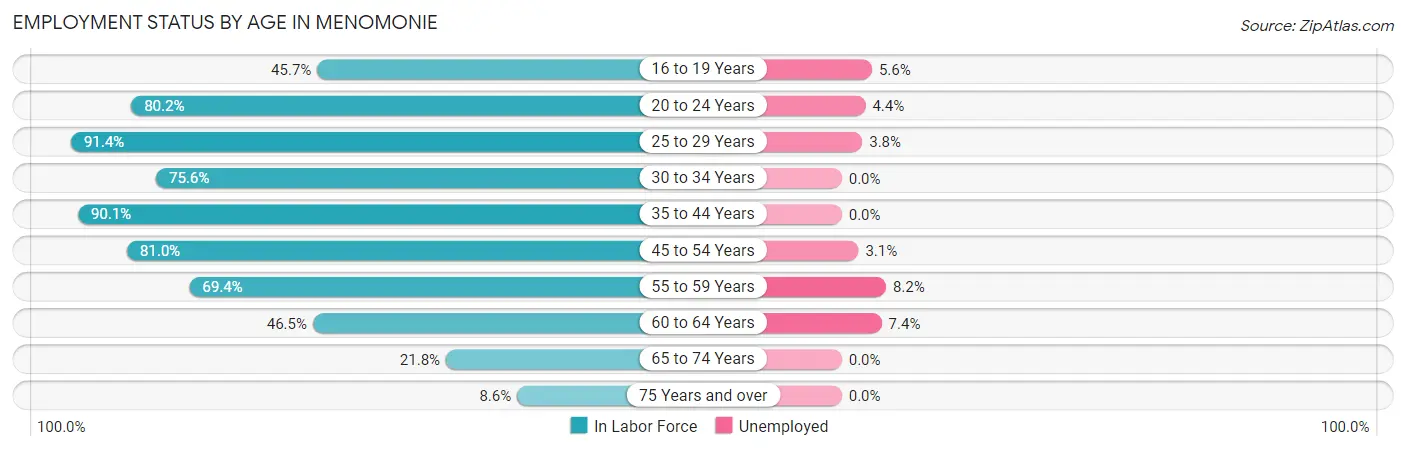
| Age Bracket | In Labor Force | Unemployed |
| 16 to 19 Years | 1,061 (45.7%) | 59 (5.6%) |
| 20 to 24 Years | 3,608 (80.2%) | 159 (4.4%) |
| 25 to 29 Years | 954 (91.4%) | 36 (3.8%) |
| 30 to 34 Years | 563 (75.6%) | 0 (0.0%) |
| 35 to 44 Years | 1,342 (90.1%) | 0 (0.0%) |
| 45 to 54 Years | 962 (81.0%) | 30 (3.1%) |
| 55 to 59 Years | 452 (69.4%) | 37 (8.2%) |
| 60 to 64 Years | 283 (46.5%) | 21 (7.4%) |
| 65 to 74 Years | 262 (21.8%) | 0 (0.0%) |
| 75 Years and over | 92 (8.6%) | 0 (0.0%) |
| Total | 9,570 (64.6%) | 345 (3.6%) |
Employment Status by Educational Attainment in Menomonie
According to labor force statistics for Menomonie, 79.6% of individuals (4,557) out of the total population between 25 and 64 years of age (5,725) are in the labor force, with 2.7% or 123 of them being unemployed. The group with the highest labor force participation rate are those with the educational attainment of bachelor's degree or higher, with 83.0% or 1,743 individuals in the labor force. Within the labor force, individuals with less than high school education have the highest percentage of unemployment, with 14.4% or 20 of them being unemployed.
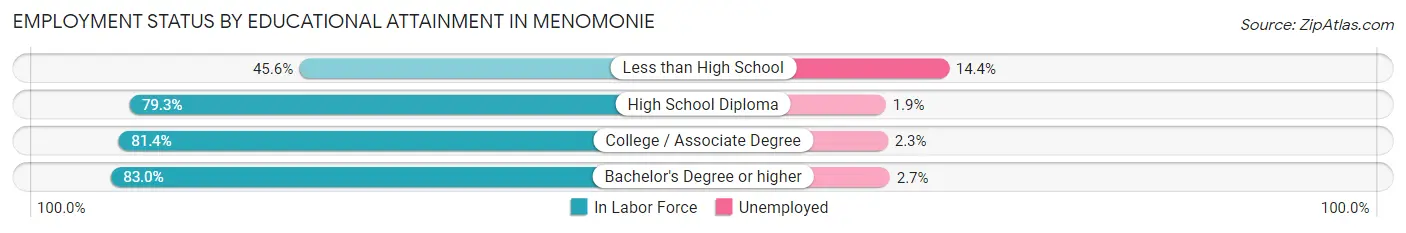
| Educational Attainment | In Labor Force | Unemployed |
| Less than High School | 139 (45.6%) | 44 (14.4%) |
| High School Diploma | 1,094 (79.3%) | 26 (1.9%) |
| College / Associate Degree | 1,579 (81.4%) | 45 (2.3%) |
| Bachelor's Degree or higher | 1,743 (83.0%) | 57 (2.7%) |
| Total | 4,557 (79.6%) | 155 (2.7%) |
Employment Occupations by Sex in Menomonie
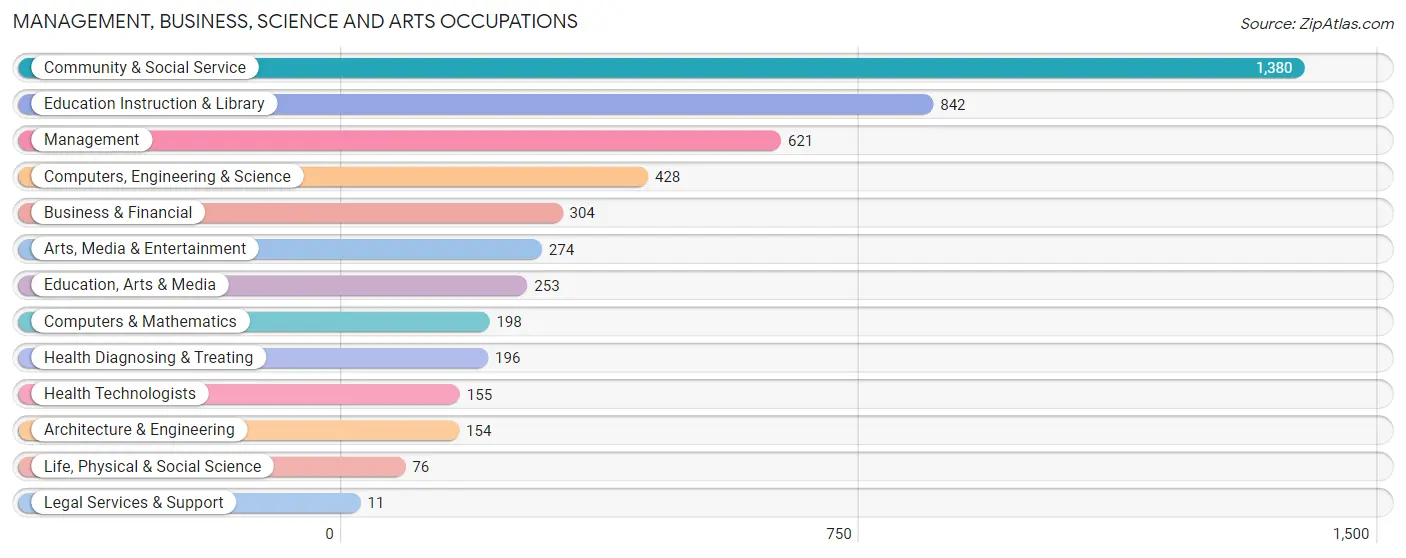
Management, Business, Science and Arts Occupations
The most common Management, Business, Science and Arts occupations in Menomonie are Community & Social Service (1,380 | 14.9%), Education Instruction & Library (842 | 9.1%), Management (621 | 6.7%), Computers, Engineering & Science (428 | 4.6%), and Business & Financial (304 | 3.3%).
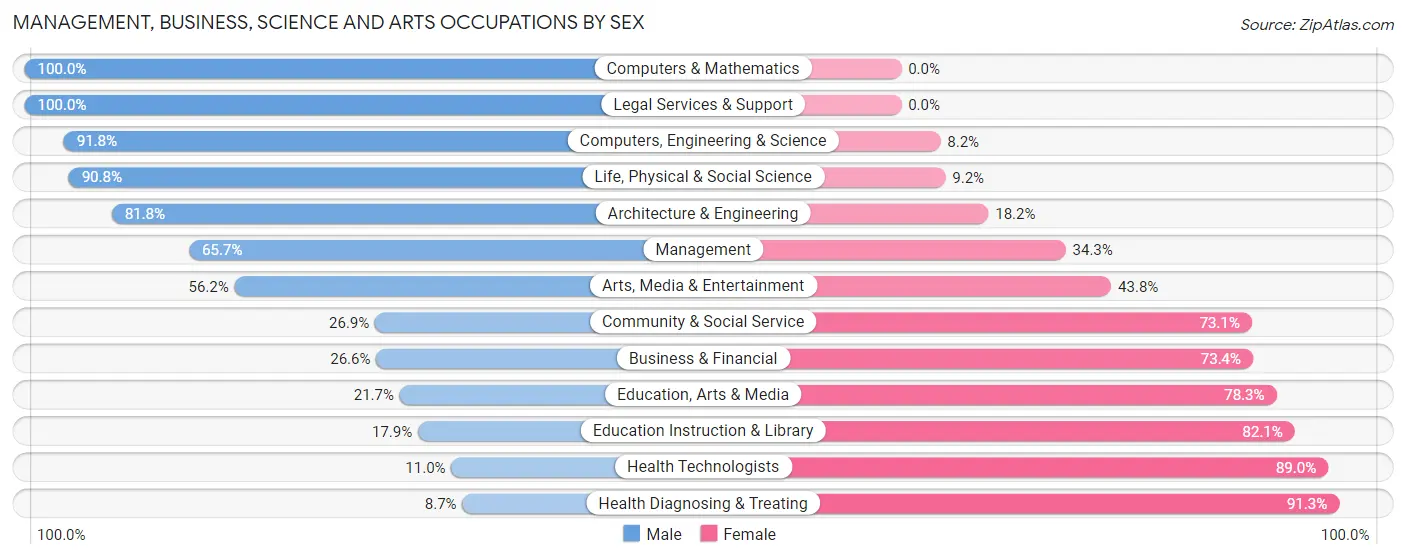
Management, Business, Science and Arts Occupations by Sex
Within the Management, Business, Science and Arts occupations in Menomonie, the most male-oriented occupations are Computers & Mathematics (100.0%), Legal Services & Support (100.0%), and Computers, Engineering & Science (91.8%), while the most female-oriented occupations are Health Diagnosing & Treating (91.3%), Health Technologists (89.0%), and Education Instruction & Library (82.1%).
| Occupation | Male | Female |
| Management | 408 (65.7%) | 213 (34.3%) |
| Business & Financial | 81 (26.6%) | 223 (73.4%) |
| Computers, Engineering & Science | 393 (91.8%) | 35 (8.2%) |
| Computers & Mathematics | 198 (100.0%) | 0 (0.0%) |
| Architecture & Engineering | 126 (81.8%) | 28 (18.2%) |
| Life, Physical & Social Science | 69 (90.8%) | 7 (9.2%) |
| Community & Social Service | 371 (26.9%) | 1,009 (73.1%) |
| Education, Arts & Media | 55 (21.7%) | 198 (78.3%) |
| Legal Services & Support | 11 (100.0%) | 0 (0.0%) |
| Education Instruction & Library | 151 (17.9%) | 691 (82.1%) |
| Arts, Media & Entertainment | 154 (56.2%) | 120 (43.8%) |
| Health Diagnosing & Treating | 17 (8.7%) | 179 (91.3%) |
| Health Technologists | 17 (11.0%) | 138 (89.0%) |
| Total (Category) | 1,270 (43.4%) | 1,659 (56.6%) |
| Total (Overall) | 4,639 (50.2%) | 4,596 (49.8%) |
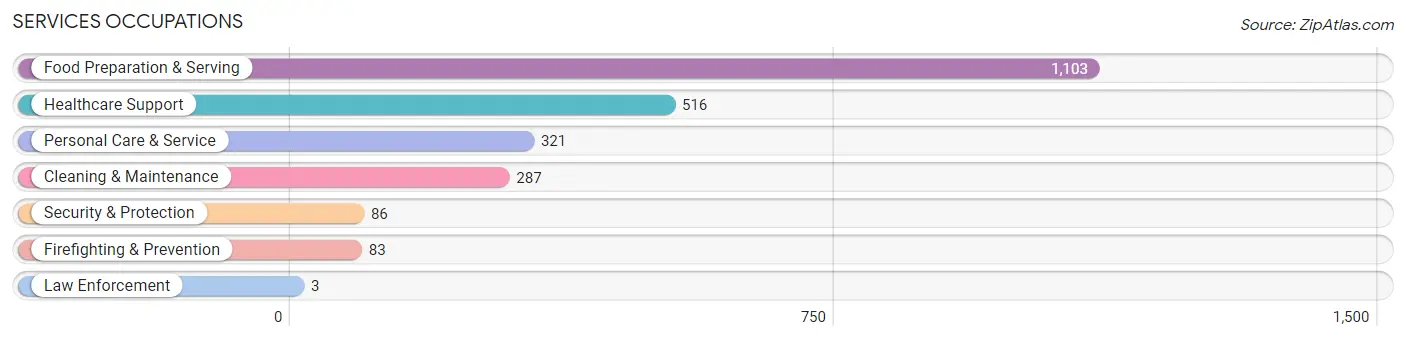
Services Occupations
The most common Services occupations in Menomonie are Food Preparation & Serving (1,103 | 11.9%), Healthcare Support (516 | 5.6%), Personal Care & Service (321 | 3.5%), Cleaning & Maintenance (287 | 3.1%), and Security & Protection (86 | 0.9%).
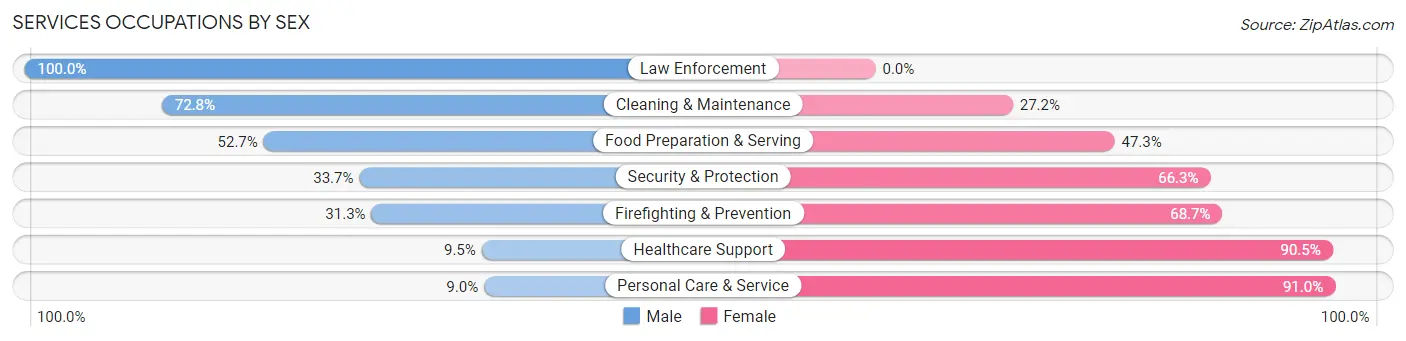
Services Occupations by Sex
Within the Services occupations in Menomonie, the most male-oriented occupations are Law Enforcement (100.0%), Cleaning & Maintenance (72.8%), and Food Preparation & Serving (52.7%), while the most female-oriented occupations are Personal Care & Service (91.0%), Healthcare Support (90.5%), and Firefighting & Prevention (68.7%).
| Occupation | Male | Female |
| Healthcare Support | 49 (9.5%) | 467 (90.5%) |
| Security & Protection | 29 (33.7%) | 57 (66.3%) |
| Firefighting & Prevention | 26 (31.3%) | 57 (68.7%) |
| Law Enforcement | 3 (100.0%) | 0 (0.0%) |
| Food Preparation & Serving | 581 (52.7%) | 522 (47.3%) |
| Cleaning & Maintenance | 209 (72.8%) | 78 (27.2%) |
| Personal Care & Service | 29 (9.0%) | 292 (91.0%) |
| Total (Category) | 897 (38.8%) | 1,416 (61.2%) |
| Total (Overall) | 4,639 (50.2%) | 4,596 (49.8%) |
Sales and Office Occupations
The most common Sales and Office occupations in Menomonie are Office & Administration (878 | 9.5%), and Sales & Related (758 | 8.2%).

Sales and Office Occupations by Sex
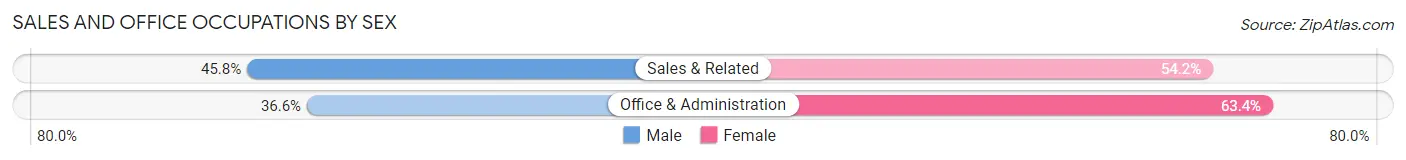
| Occupation | Male | Female |
| Sales & Related | 347 (45.8%) | 411 (54.2%) |
| Office & Administration | 321 (36.6%) | 557 (63.4%) |
| Total (Category) | 668 (40.8%) | 968 (59.2%) |
| Total (Overall) | 4,639 (50.2%) | 4,596 (49.8%) |
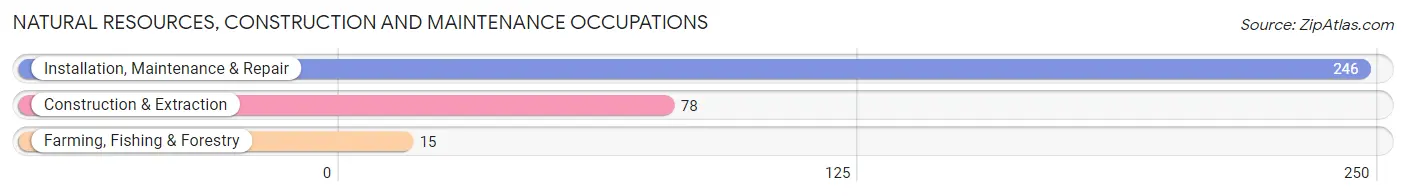
Natural Resources, Construction and Maintenance Occupations
The most common Natural Resources, Construction and Maintenance occupations in Menomonie are Installation, Maintenance & Repair (246 | 2.7%), Construction & Extraction (78 | 0.8%), and Farming, Fishing & Forestry (15 | 0.2%).
Natural Resources, Construction and Maintenance Occupations by Sex
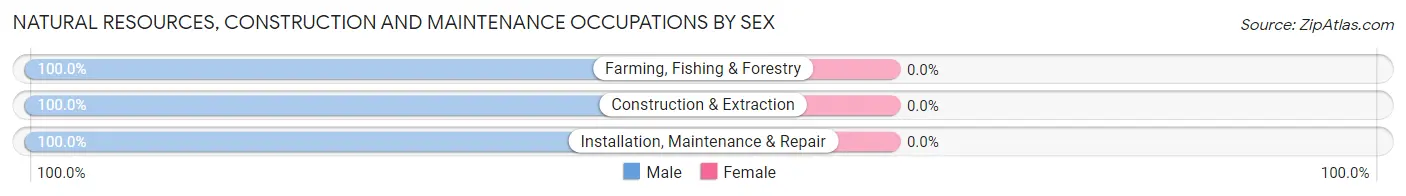
| Occupation | Male | Female |
| Farming, Fishing & Forestry | 15 (100.0%) | 0 (0.0%) |
| Construction & Extraction | 78 (100.0%) | 0 (0.0%) |
| Installation, Maintenance & Repair | 246 (100.0%) | 0 (0.0%) |
| Total (Category) | 339 (100.0%) | 0 (0.0%) |
| Total (Overall) | 4,639 (50.2%) | 4,596 (49.8%) |
Production, Transportation and Moving Occupations
The most common Production, Transportation and Moving occupations in Menomonie are Production (819 | 8.9%), Material Moving (756 | 8.2%), and Transportation (443 | 4.8%).
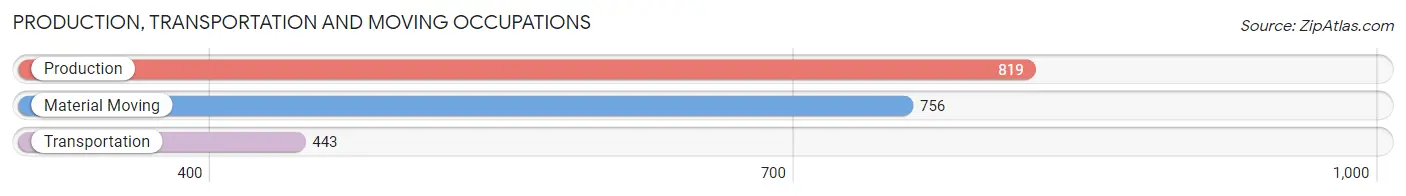
Production, Transportation and Moving Occupations by Sex
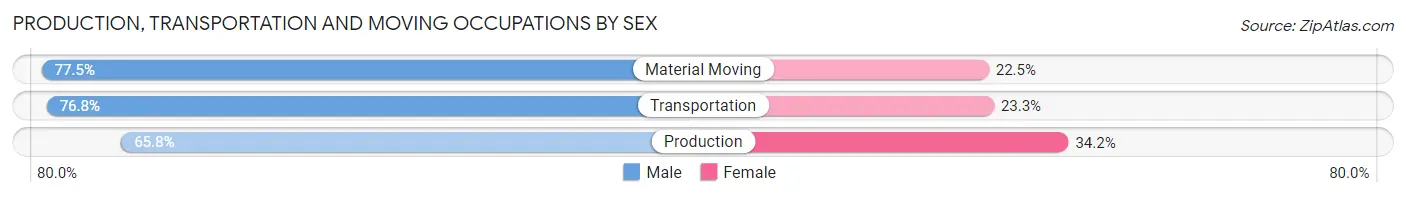
| Occupation | Male | Female |
| Production | 539 (65.8%) | 280 (34.2%) |
| Transportation | 340 (76.7%) | 103 (23.3%) |
| Material Moving | 586 (77.5%) | 170 (22.5%) |
| Total (Category) | 1,465 (72.6%) | 553 (27.4%) |
| Total (Overall) | 4,639 (50.2%) | 4,596 (49.8%) |
Employment Industries by Sex in Menomonie
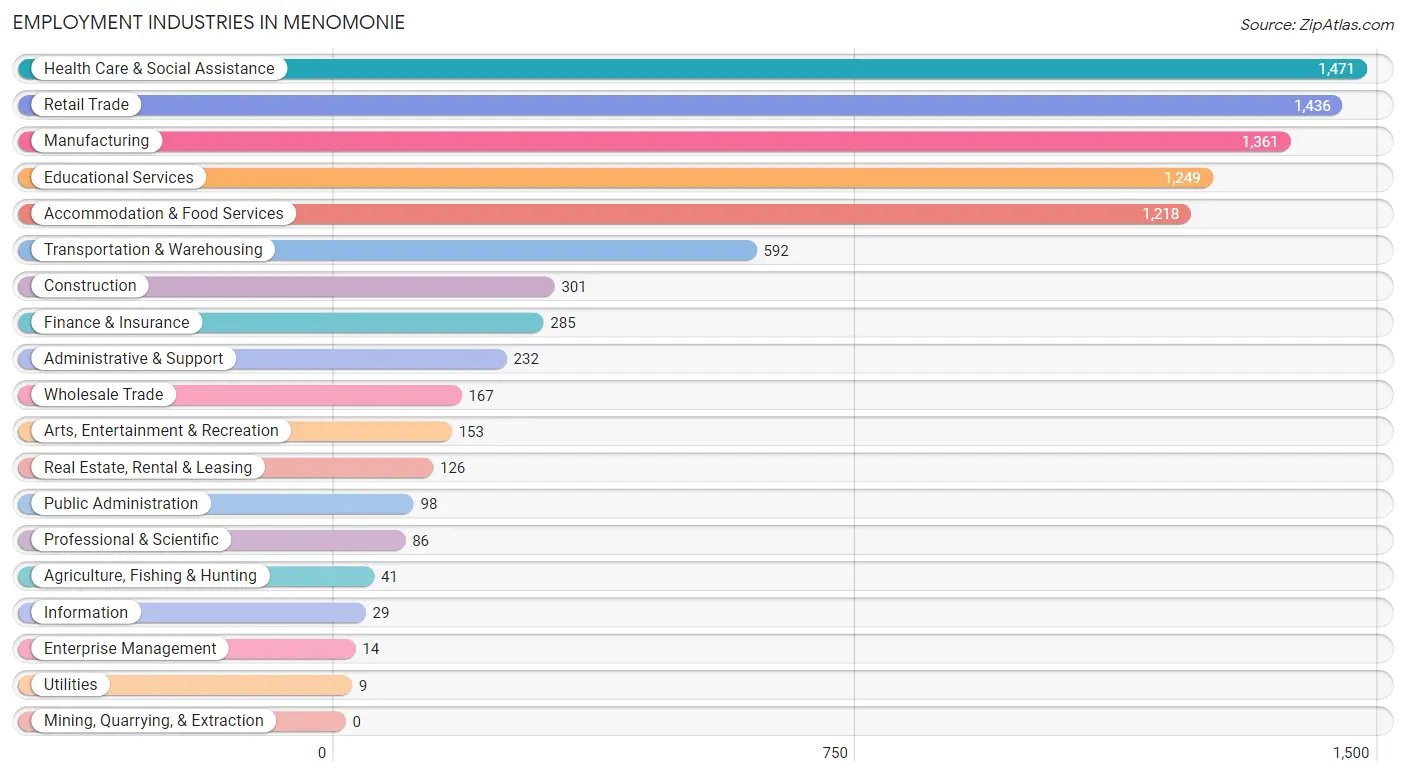
Employment Industries in Menomonie
The major employment industries in Menomonie include Health Care & Social Assistance (1,471 | 15.9%), Retail Trade (1,436 | 15.5%), Manufacturing (1,361 | 14.7%), Educational Services (1,249 | 13.5%), and Accommodation & Food Services (1,218 | 13.2%).
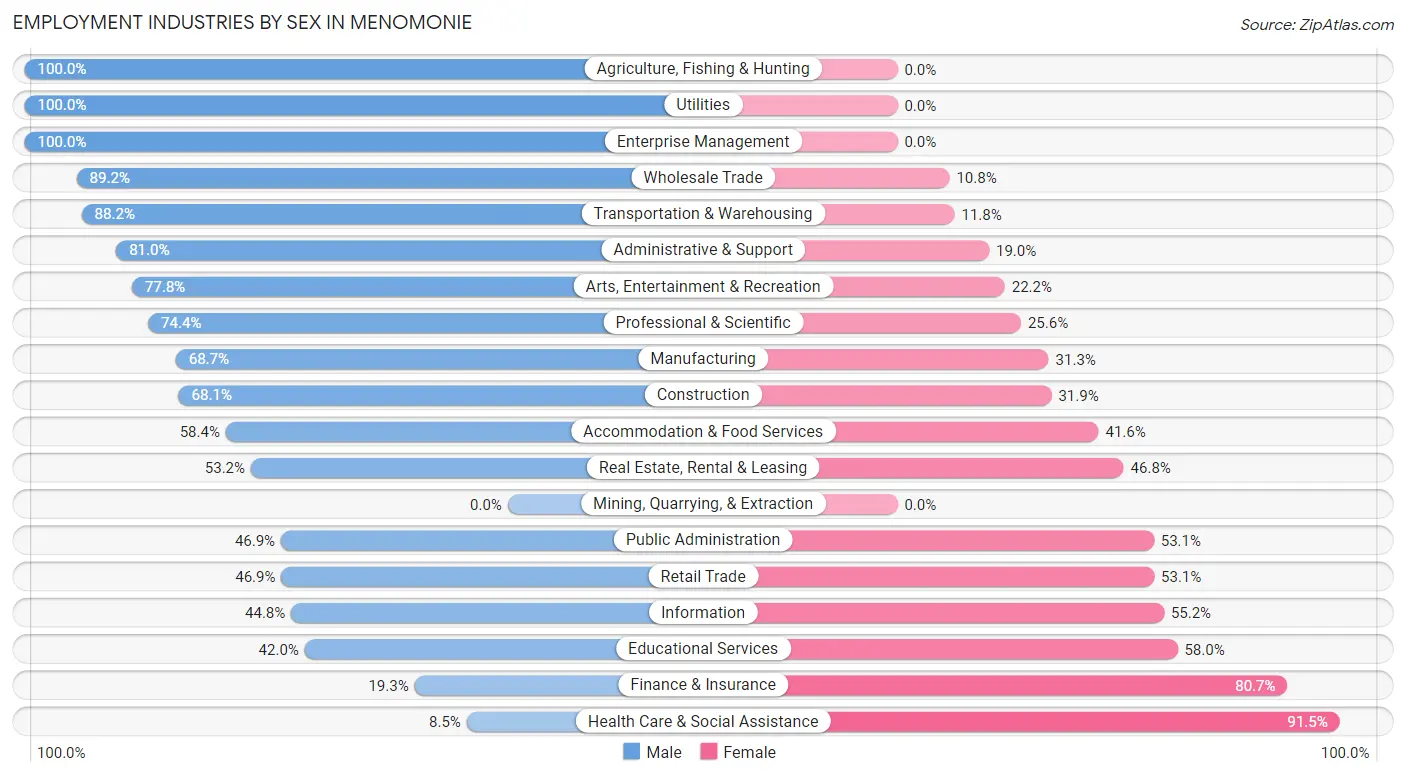
Employment Industries by Sex in Menomonie
The Menomonie industries that see more men than women are Agriculture, Fishing & Hunting (100.0%), Utilities (100.0%), and Enterprise Management (100.0%), whereas the industries that tend to have a higher number of women are Health Care & Social Assistance (91.5%), Finance & Insurance (80.7%), and Educational Services (58.0%).
| Industry | Male | Female |
| Agriculture, Fishing & Hunting | 41 (100.0%) | 0 (0.0%) |
| Mining, Quarrying, & Extraction | 0 (0.0%) | 0 (0.0%) |
| Construction | 205 (68.1%) | 96 (31.9%) |
| Manufacturing | 935 (68.7%) | 426 (31.3%) |
| Wholesale Trade | 149 (89.2%) | 18 (10.8%) |
| Retail Trade | 673 (46.9%) | 763 (53.1%) |
| Transportation & Warehousing | 522 (88.2%) | 70 (11.8%) |
| Utilities | 9 (100.0%) | 0 (0.0%) |
| Information | 13 (44.8%) | 16 (55.2%) |
| Finance & Insurance | 55 (19.3%) | 230 (80.7%) |
| Real Estate, Rental & Leasing | 67 (53.2%) | 59 (46.8%) |
| Professional & Scientific | 64 (74.4%) | 22 (25.6%) |
| Enterprise Management | 14 (100.0%) | 0 (0.0%) |
| Administrative & Support | 188 (81.0%) | 44 (19.0%) |
| Educational Services | 525 (42.0%) | 724 (58.0%) |
| Health Care & Social Assistance | 125 (8.5%) | 1,346 (91.5%) |
| Arts, Entertainment & Recreation | 119 (77.8%) | 34 (22.2%) |
| Accommodation & Food Services | 711 (58.4%) | 507 (41.6%) |
| Public Administration | 46 (46.9%) | 52 (53.1%) |
| Total | 4,639 (50.2%) | 4,596 (49.8%) |
Education in Menomonie
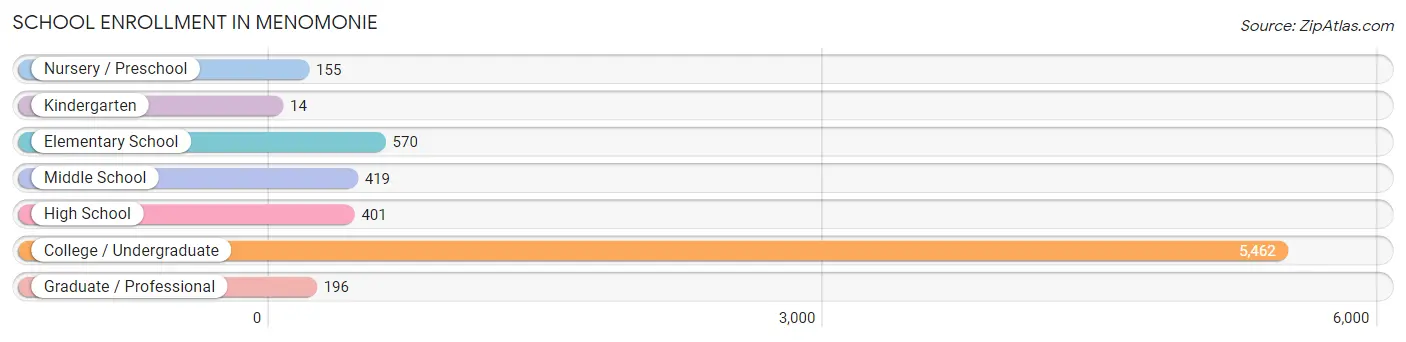
School Enrollment in Menomonie
The most common levels of schooling among the 7,217 students in Menomonie are college / undergraduate (5,462 | 75.7%), elementary school (570 | 7.9%), and middle school (419 | 5.8%).
| School Level | # Students | % Students |
| Nursery / Preschool | 155 | 2.1% |
| Kindergarten | 14 | 0.2% |
| Elementary School | 570 | 7.9% |
| Middle School | 419 | 5.8% |
| High School | 401 | 5.6% |
| College / Undergraduate | 5,462 | 75.7% |
| Graduate / Professional | 196 | 2.7% |
| Total | 7,217 | 100.0% |
School Enrollment by Age by Funding Source in Menomonie
Out of a total of 7,217 students who are enrolled in schools in Menomonie, 339 (4.7%) attend a private institution, while the remaining 6,878 (95.3%) are enrolled in public schools. The age group of 15 to 17 year olds has the highest likelihood of being enrolled in private schools, with 94 (37.3% in the age bracket) enrolled. Conversely, the age group of 5 to 9 year old has the lowest likelihood of being enrolled in a private school, with 573 (100.0% in the age bracket) attending a public institution.
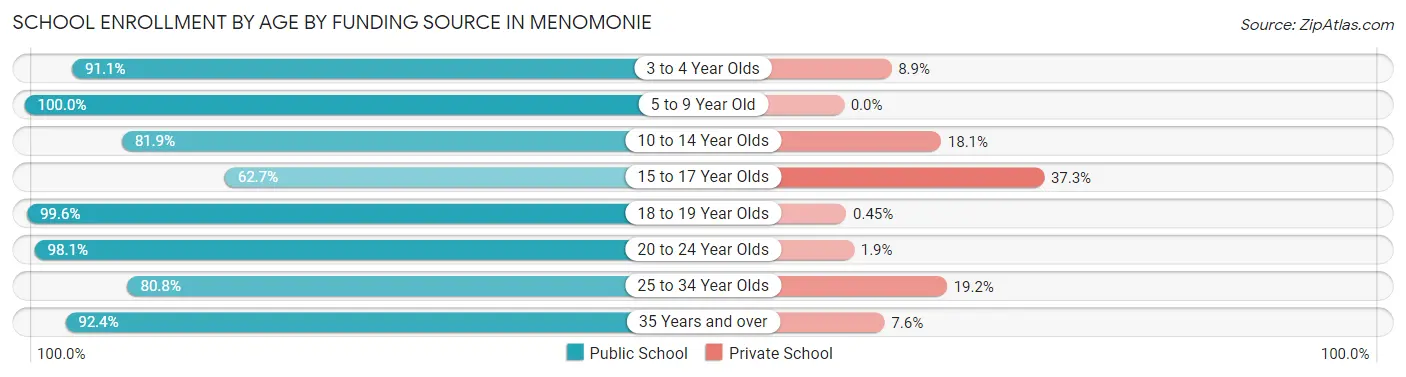
| Age Bracket | Public School | Private School |
| 3 to 4 Year Olds | 72 (91.1%) | 7 (8.9%) |
| 5 to 9 Year Old | 573 (100.0%) | 0 (0.0%) |
| 10 to 14 Year Olds | 475 (81.9%) | 105 (18.1%) |
| 15 to 17 Year Olds | 158 (62.7%) | 94 (37.3%) |
| 18 to 19 Year Olds | 1,983 (99.6%) | 9 (0.4%) |
| 20 to 24 Year Olds | 3,192 (98.1%) | 61 (1.9%) |
| 25 to 34 Year Olds | 160 (80.8%) | 38 (19.2%) |
| 35 Years and over | 268 (92.4%) | 22 (7.6%) |
| Total | 6,878 (95.3%) | 339 (4.7%) |
Educational Attainment by Field of Study in Menomonie
Education (619 | 19.3%), business (500 | 15.6%), arts & humanities (387 | 12.1%), science & technology (335 | 10.5%), and visual & performing arts (207 | 6.5%) are the most common fields of study among 3,204 individuals in Menomonie who have obtained a bachelor's degree or higher.
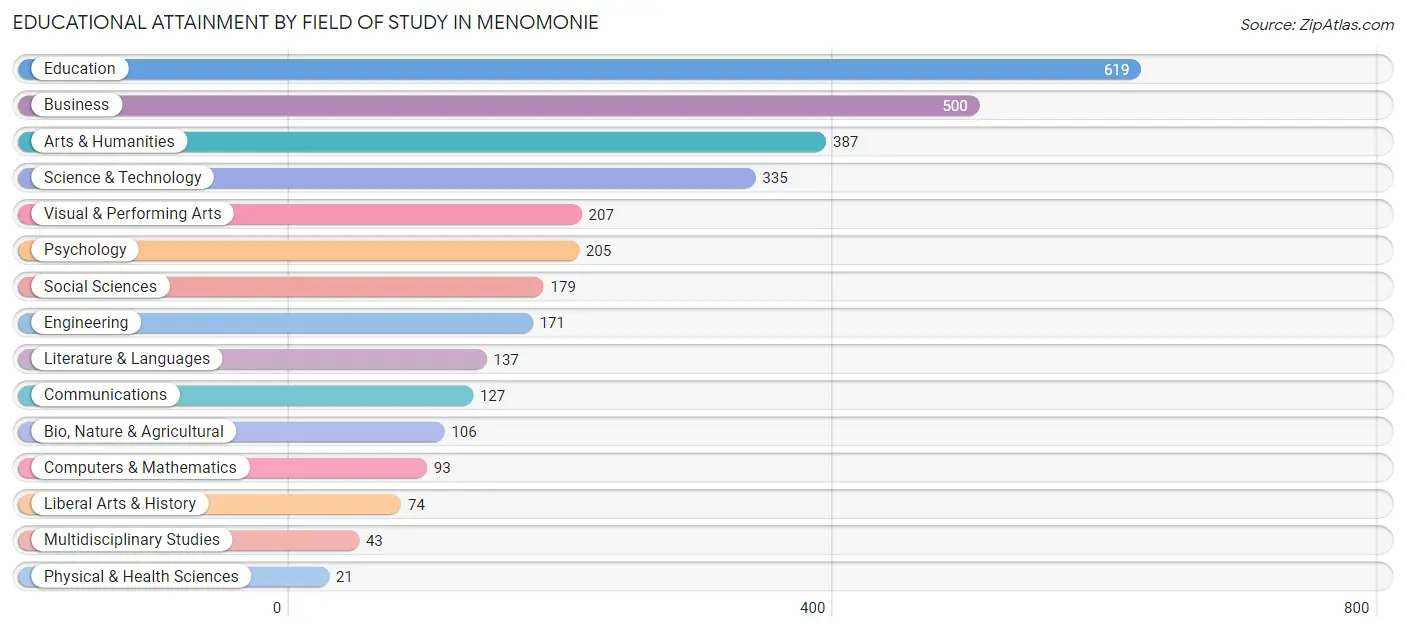
| Field of Study | # Graduates | % Graduates |
| Computers & Mathematics | 93 | 2.9% |
| Bio, Nature & Agricultural | 106 | 3.3% |
| Physical & Health Sciences | 21 | 0.7% |
| Psychology | 205 | 6.4% |
| Social Sciences | 179 | 5.6% |
| Engineering | 171 | 5.3% |
| Multidisciplinary Studies | 43 | 1.3% |
| Science & Technology | 335 | 10.5% |
| Business | 500 | 15.6% |
| Education | 619 | 19.3% |
| Literature & Languages | 137 | 4.3% |
| Liberal Arts & History | 74 | 2.3% |
| Visual & Performing Arts | 207 | 6.5% |
| Communications | 127 | 4.0% |
| Arts & Humanities | 387 | 12.1% |
| Total | 3,204 | 100.0% |
Transportation & Commute in Menomonie
Vehicle Availability by Sex in Menomonie
The most prevalent vehicle ownership categories in Menomonie are males with 2 vehicles (1,542, accounting for 40.7%) and females with 2 vehicles (1,465, making up 39.5%).
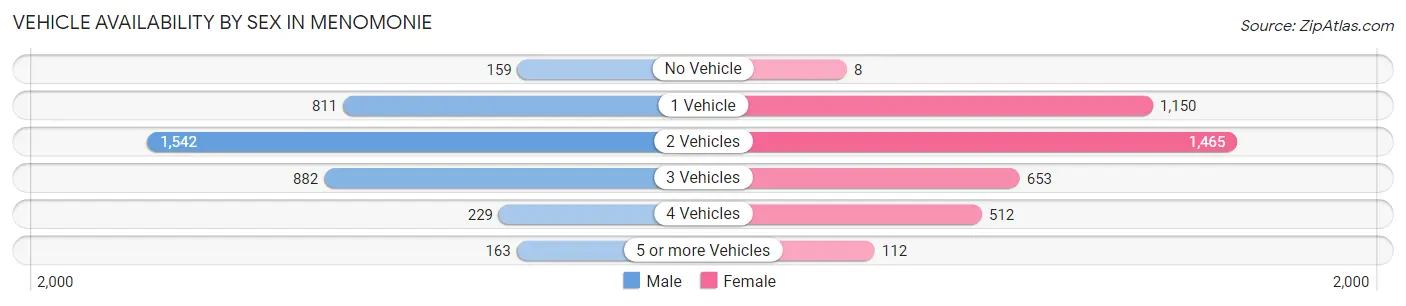
| Vehicles Available | Male | Female |
| No Vehicle | 159 (4.2%) | 8 (0.2%) |
| 1 Vehicle | 811 (21.4%) | 1,150 (29.5%) |
| 2 Vehicles | 1,542 (40.7%) | 1,465 (37.6%) |
| 3 Vehicles | 882 (23.3%) | 653 (16.7%) |
| 4 Vehicles | 229 (6.0%) | 512 (13.1%) |
| 5 or more Vehicles | 163 (4.3%) | 112 (2.9%) |
| Total | 3,786 (100.0%) | 3,900 (100.0%) |
Commute Time in Menomonie
The most frequently occuring commute durations in Menomonie are 5 to 9 minutes (2,175 commuters, 26.4%), 10 to 14 minutes (1,901 commuters, 23.1%), and 15 to 19 minutes (960 commuters, 11.6%).
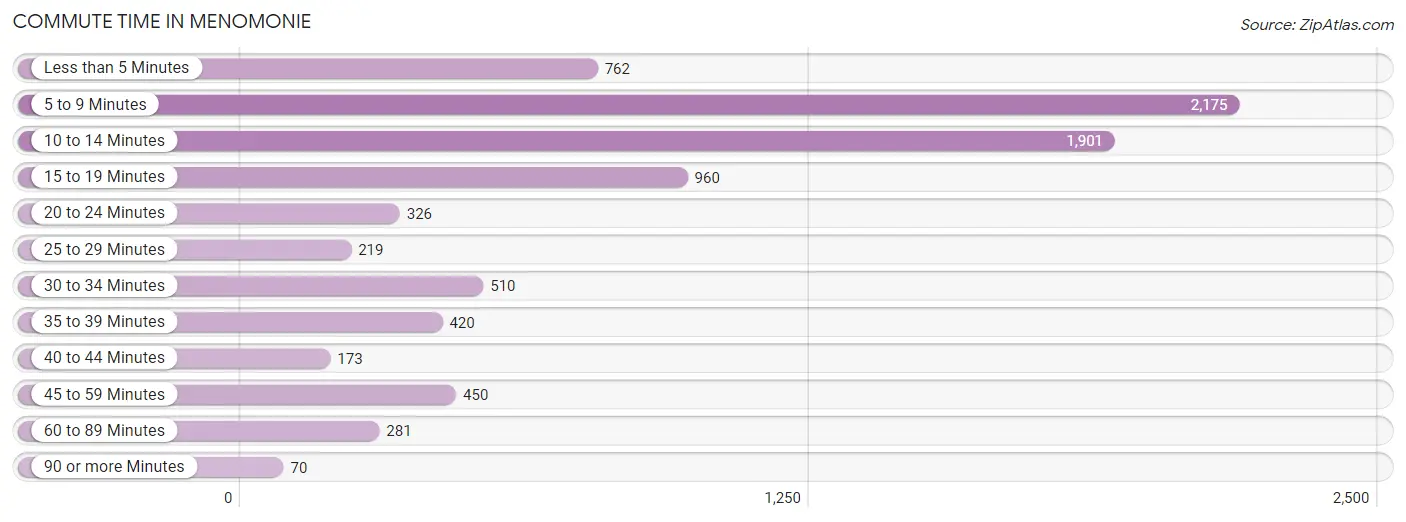
| Commute Time | # Commuters | % Commuters |
| Less than 5 Minutes | 762 | 9.2% |
| 5 to 9 Minutes | 2,175 | 26.4% |
| 10 to 14 Minutes | 1,901 | 23.1% |
| 15 to 19 Minutes | 960 | 11.6% |
| 20 to 24 Minutes | 326 | 4.0% |
| 25 to 29 Minutes | 219 | 2.7% |
| 30 to 34 Minutes | 510 | 6.2% |
| 35 to 39 Minutes | 420 | 5.1% |
| 40 to 44 Minutes | 173 | 2.1% |
| 45 to 59 Minutes | 450 | 5.5% |
| 60 to 89 Minutes | 281 | 3.4% |
| 90 or more Minutes | 70 | 0.9% |
Commute Time by Sex in Menomonie
The most common commute times in Menomonie are 10 to 14 minutes (954 commuters, 22.8%) for males and 5 to 9 minutes (1,316 commuters, 32.5%) for females.
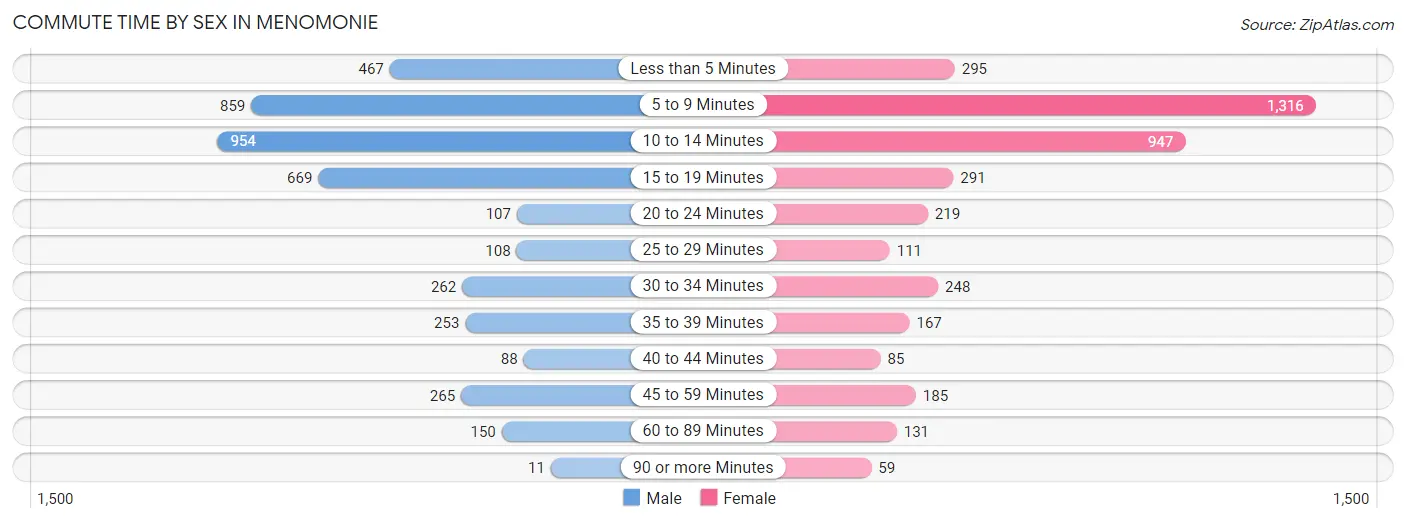
| Commute Time | Male | Female |
| Less than 5 Minutes | 467 (11.1%) | 295 (7.3%) |
| 5 to 9 Minutes | 859 (20.5%) | 1,316 (32.5%) |
| 10 to 14 Minutes | 954 (22.8%) | 947 (23.4%) |
| 15 to 19 Minutes | 669 (16.0%) | 291 (7.2%) |
| 20 to 24 Minutes | 107 (2.5%) | 219 (5.4%) |
| 25 to 29 Minutes | 108 (2.6%) | 111 (2.7%) |
| 30 to 34 Minutes | 262 (6.2%) | 248 (6.1%) |
| 35 to 39 Minutes | 253 (6.0%) | 167 (4.1%) |
| 40 to 44 Minutes | 88 (2.1%) | 85 (2.1%) |
| 45 to 59 Minutes | 265 (6.3%) | 185 (4.6%) |
| 60 to 89 Minutes | 150 (3.6%) | 131 (3.2%) |
| 90 or more Minutes | 11 (0.3%) | 59 (1.5%) |
Time of Departure to Work by Sex in Menomonie
The most frequent times of departure to work in Menomonie are 4:00 PM to 11:59 PM (733, 17.5%) for males and 12:00 PM to 3:59 PM (719, 17.7%) for females.
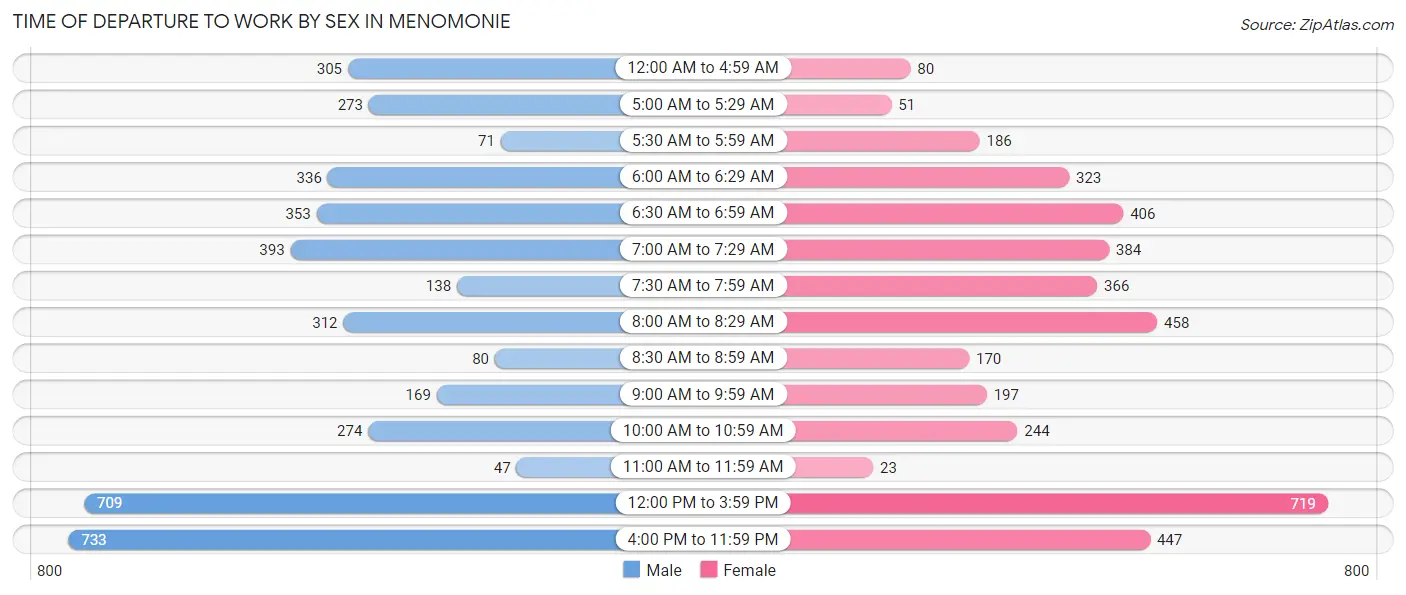
| Time of Departure | Male | Female |
| 12:00 AM to 4:59 AM | 305 (7.3%) | 80 (2.0%) |
| 5:00 AM to 5:29 AM | 273 (6.5%) | 51 (1.3%) |
| 5:30 AM to 5:59 AM | 71 (1.7%) | 186 (4.6%) |
| 6:00 AM to 6:29 AM | 336 (8.0%) | 323 (8.0%) |
| 6:30 AM to 6:59 AM | 353 (8.4%) | 406 (10.0%) |
| 7:00 AM to 7:29 AM | 393 (9.4%) | 384 (9.5%) |
| 7:30 AM to 7:59 AM | 138 (3.3%) | 366 (9.0%) |
| 8:00 AM to 8:29 AM | 312 (7.4%) | 458 (11.3%) |
| 8:30 AM to 8:59 AM | 80 (1.9%) | 170 (4.2%) |
| 9:00 AM to 9:59 AM | 169 (4.0%) | 197 (4.9%) |
| 10:00 AM to 10:59 AM | 274 (6.5%) | 244 (6.0%) |
| 11:00 AM to 11:59 AM | 47 (1.1%) | 23 (0.6%) |
| 12:00 PM to 3:59 PM | 709 (16.9%) | 719 (17.7%) |
| 4:00 PM to 11:59 PM | 733 (17.5%) | 447 (11.0%) |
| Total | 4,193 (100.0%) | 4,054 (100.0%) |
Housing Occupancy in Menomonie
Occupancy by Ownership in Menomonie
Of the total 6,118 dwellings in Menomonie, owner-occupied units account for 2,368 (38.7%), while renter-occupied units make up 3,750 (61.3%).
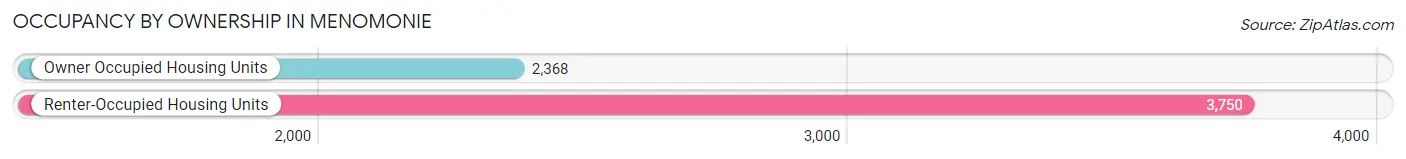
| Occupancy | # Housing Units | % Housing Units |
| Owner Occupied Housing Units | 2,368 | 38.7% |
| Renter-Occupied Housing Units | 3,750 | 61.3% |
| Total Occupied Housing Units | 6,118 | 100.0% |
Occupancy by Household Size in Menomonie
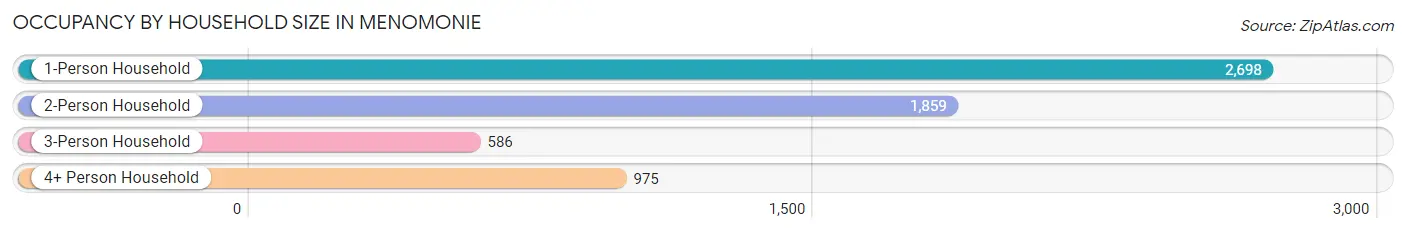
| Household Size | # Housing Units | % Housing Units |
| 1-Person Household | 2,698 | 44.1% |
| 2-Person Household | 1,859 | 30.4% |
| 3-Person Household | 586 | 9.6% |
| 4+ Person Household | 975 | 15.9% |
| Total Housing Units | 6,118 | 100.0% |
Occupancy by Ownership by Household Size in Menomonie
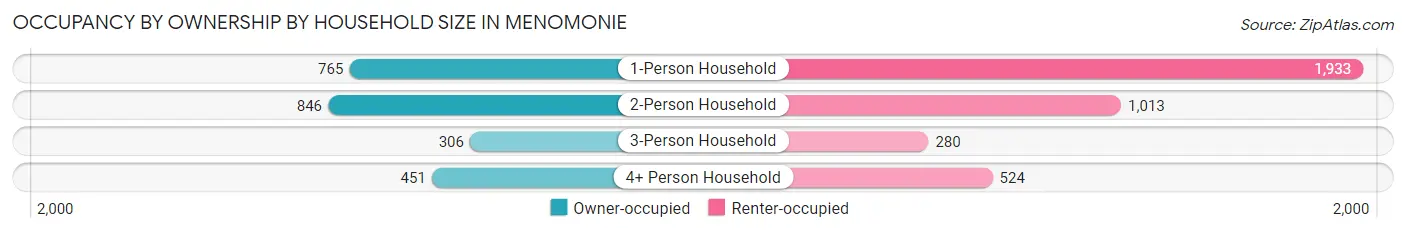
| Household Size | Owner-occupied | Renter-occupied |
| 1-Person Household | 765 (28.3%) | 1,933 (71.7%) |
| 2-Person Household | 846 (45.5%) | 1,013 (54.5%) |
| 3-Person Household | 306 (52.2%) | 280 (47.8%) |
| 4+ Person Household | 451 (46.3%) | 524 (53.7%) |
| Total Housing Units | 2,368 (38.7%) | 3,750 (61.3%) |
Occupancy by Educational Attainment in Menomonie
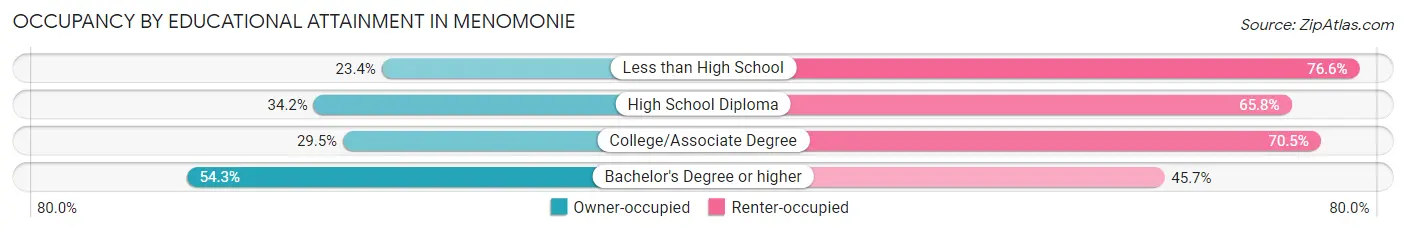
| Household Size | Owner-occupied | Renter-occupied |
| Less than High School | 68 (23.4%) | 223 (76.6%) |
| High School Diploma | 401 (34.2%) | 773 (65.8%) |
| College/Associate Degree | 747 (29.5%) | 1,784 (70.5%) |
| Bachelor's Degree or higher | 1,152 (54.3%) | 970 (45.7%) |
Occupancy by Age of Householder in Menomonie
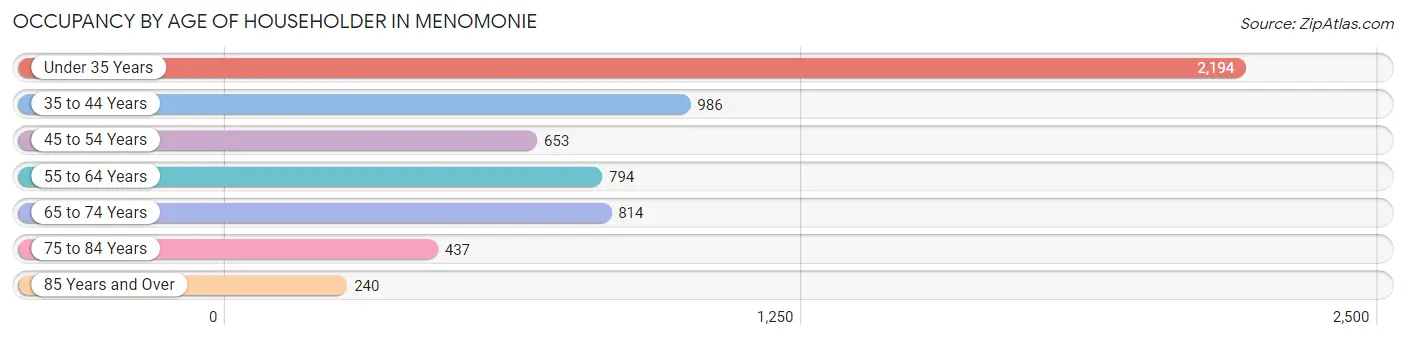
| Age Bracket | # Households | % Households |
| Under 35 Years | 2,194 | 35.9% |
| 35 to 44 Years | 986 | 16.1% |
| 45 to 54 Years | 653 | 10.7% |
| 55 to 64 Years | 794 | 13.0% |
| 65 to 74 Years | 814 | 13.3% |
| 75 to 84 Years | 437 | 7.1% |
| 85 Years and Over | 240 | 3.9% |
| Total | 6,118 | 100.0% |
Housing Finances in Menomonie
Median Income by Occupancy in Menomonie
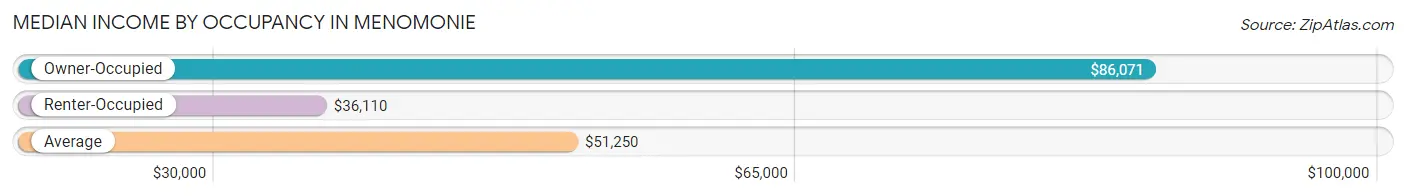
| Occupancy Type | # Households | Median Income |
| Owner-Occupied | 2,368 (38.7%) | $86,071 |
| Renter-Occupied | 3,750 (61.3%) | $36,110 |
| Average | 6,118 (100.0%) | $51,250 |
Occupancy by Householder Income Bracket in Menomonie
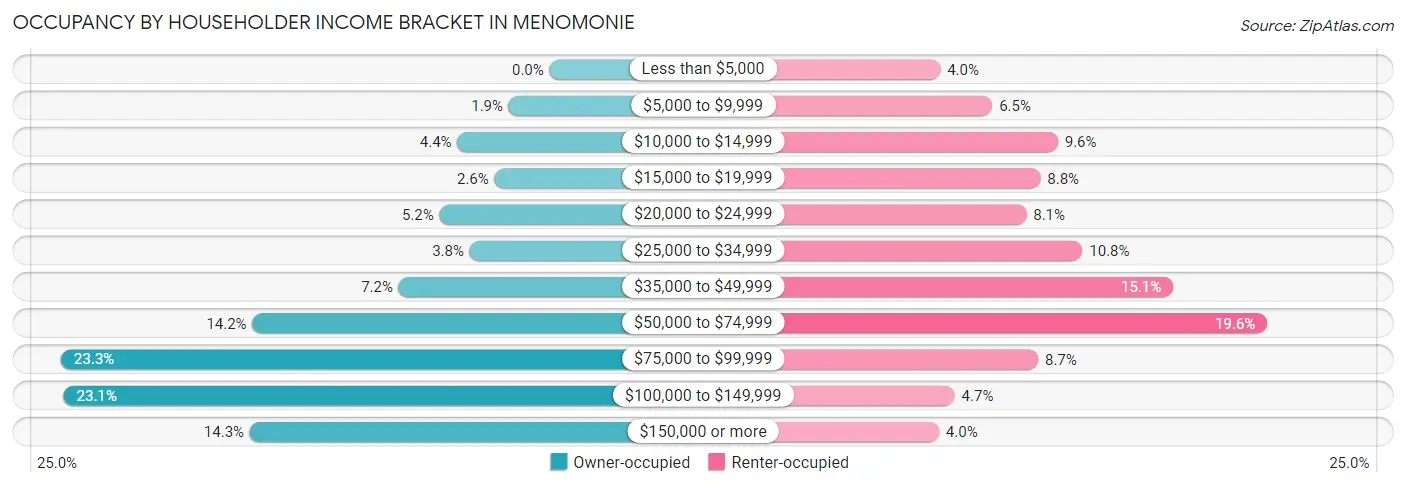
| Income Bracket | Owner-occupied | Renter-occupied |
| Less than $5,000 | 0 (0.0%) | 151 (4.0%) |
| $5,000 to $9,999 | 46 (1.9%) | 244 (6.5%) |
| $10,000 to $14,999 | 104 (4.4%) | 361 (9.6%) |
| $15,000 to $19,999 | 62 (2.6%) | 330 (8.8%) |
| $20,000 to $24,999 | 124 (5.2%) | 305 (8.1%) |
| $25,000 to $34,999 | 90 (3.8%) | 405 (10.8%) |
| $35,000 to $49,999 | 170 (7.2%) | 567 (15.1%) |
| $50,000 to $74,999 | 335 (14.1%) | 735 (19.6%) |
| $75,000 to $99,999 | 551 (23.3%) | 326 (8.7%) |
| $100,000 to $149,999 | 548 (23.1%) | 177 (4.7%) |
| $150,000 or more | 338 (14.3%) | 149 (4.0%) |
| Total | 2,368 (100.0%) | 3,750 (100.0%) |
Monthly Housing Cost Tiers in Menomonie
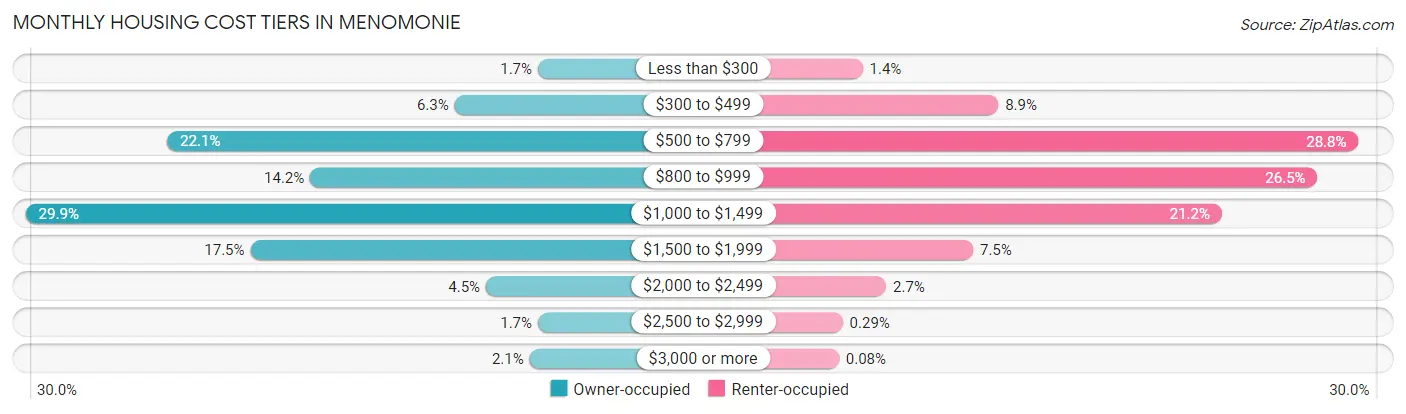
| Monthly Cost | Owner-occupied | Renter-occupied |
| Less than $300 | 39 (1.7%) | 52 (1.4%) |
| $300 to $499 | 148 (6.2%) | 333 (8.9%) |
| $500 to $799 | 524 (22.1%) | 1,079 (28.8%) |
| $800 to $999 | 337 (14.2%) | 994 (26.5%) |
| $1,000 to $1,499 | 709 (29.9%) | 796 (21.2%) |
| $1,500 to $1,999 | 415 (17.5%) | 281 (7.5%) |
| $2,000 to $2,499 | 107 (4.5%) | 101 (2.7%) |
| $2,500 to $2,999 | 39 (1.7%) | 11 (0.3%) |
| $3,000 or more | 50 (2.1%) | 3 (0.1%) |
| Total | 2,368 (100.0%) | 3,750 (100.0%) |
Physical Housing Characteristics in Menomonie
Housing Structures in Menomonie
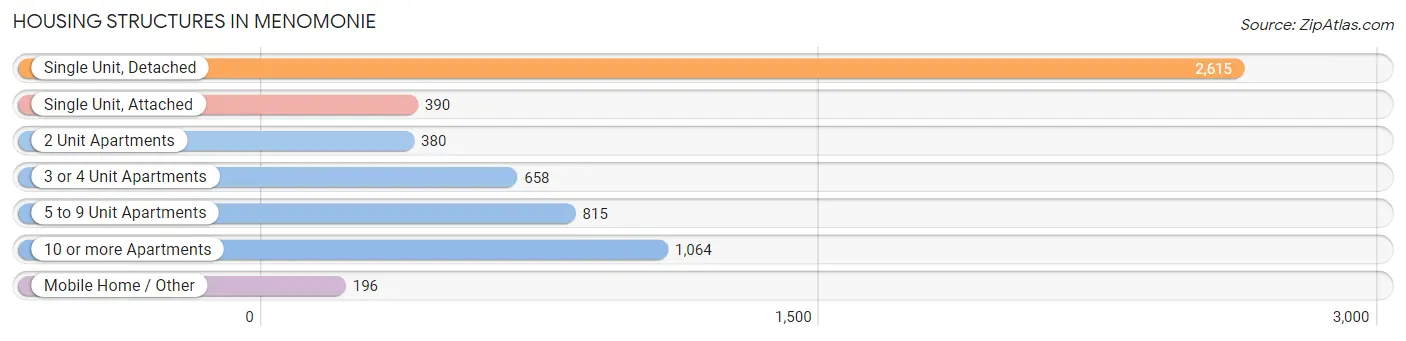
| Structure Type | # Housing Units | % Housing Units |
| Single Unit, Detached | 2,615 | 42.7% |
| Single Unit, Attached | 390 | 6.4% |
| 2 Unit Apartments | 380 | 6.2% |
| 3 or 4 Unit Apartments | 658 | 10.8% |
| 5 to 9 Unit Apartments | 815 | 13.3% |
| 10 or more Apartments | 1,064 | 17.4% |
| Mobile Home / Other | 196 | 3.2% |
| Total | 6,118 | 100.0% |
Housing Structures by Occupancy in Menomonie
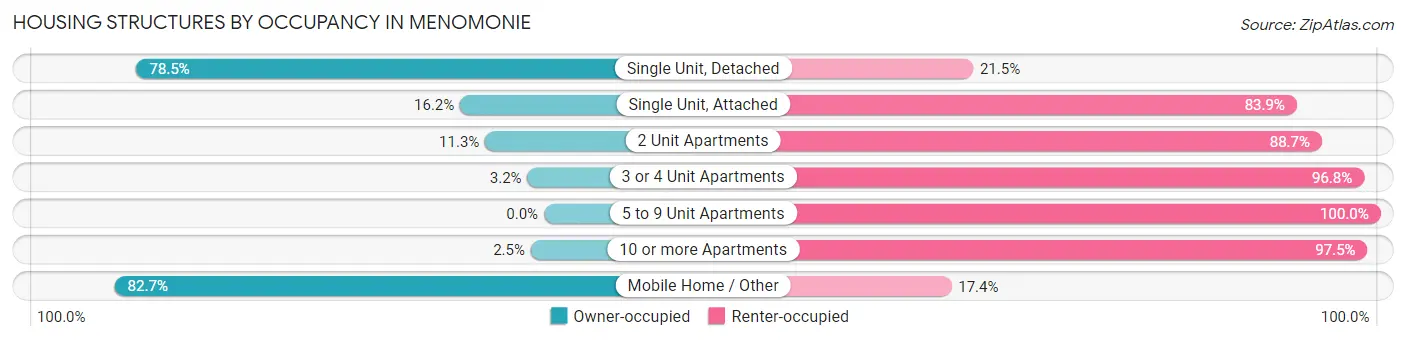
| Structure Type | Owner-occupied | Renter-occupied |
| Single Unit, Detached | 2,052 (78.5%) | 563 (21.5%) |
| Single Unit, Attached | 63 (16.2%) | 327 (83.9%) |
| 2 Unit Apartments | 43 (11.3%) | 337 (88.7%) |
| 3 or 4 Unit Apartments | 21 (3.2%) | 637 (96.8%) |
| 5 to 9 Unit Apartments | 0 (0.0%) | 815 (100.0%) |
| 10 or more Apartments | 27 (2.5%) | 1,037 (97.5%) |
| Mobile Home / Other | 162 (82.7%) | 34 (17.3%) |
| Total | 2,368 (38.7%) | 3,750 (61.3%) |
Housing Structures by Number of Rooms in Menomonie
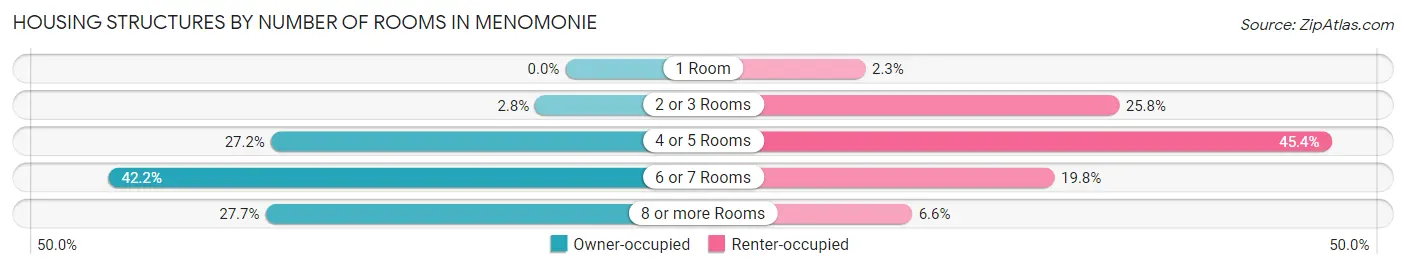
| Number of Rooms | Owner-occupied | Renter-occupied |
| 1 Room | 0 (0.0%) | 87 (2.3%) |
| 2 or 3 Rooms | 66 (2.8%) | 967 (25.8%) |
| 4 or 5 Rooms | 645 (27.2%) | 1,704 (45.4%) |
| 6 or 7 Rooms | 1,000 (42.2%) | 743 (19.8%) |
| 8 or more Rooms | 657 (27.7%) | 249 (6.6%) |
| Total | 2,368 (100.0%) | 3,750 (100.0%) |
Housing Structure by Heating Type in Menomonie
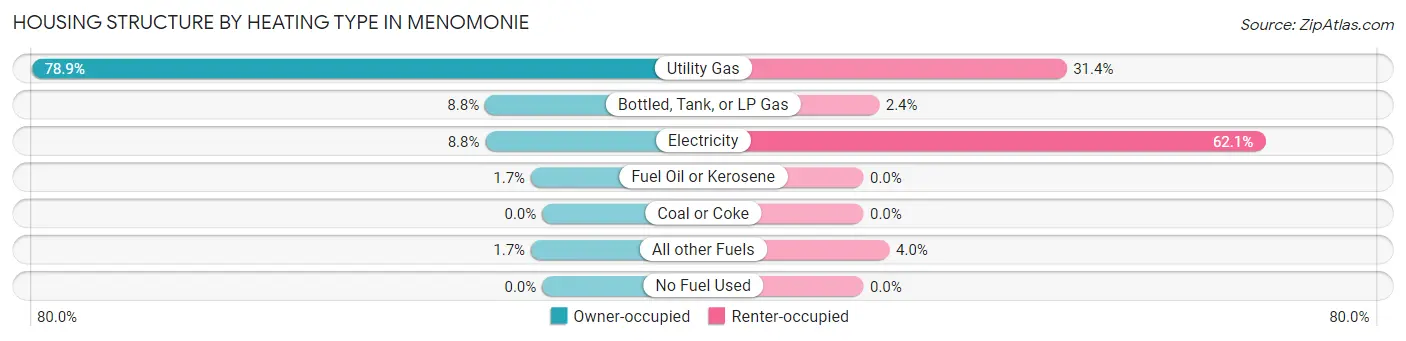
| Heating Type | Owner-occupied | Renter-occupied |
| Utility Gas | 1,869 (78.9%) | 1,178 (31.4%) |
| Bottled, Tank, or LP Gas | 209 (8.8%) | 91 (2.4%) |
| Electricity | 208 (8.8%) | 2,330 (62.1%) |
| Fuel Oil or Kerosene | 41 (1.7%) | 0 (0.0%) |
| Coal or Coke | 0 (0.0%) | 0 (0.0%) |
| All other Fuels | 41 (1.7%) | 151 (4.0%) |
| No Fuel Used | 0 (0.0%) | 0 (0.0%) |
| Total | 2,368 (100.0%) | 3,750 (100.0%) |
Household Vehicle Usage in Menomonie
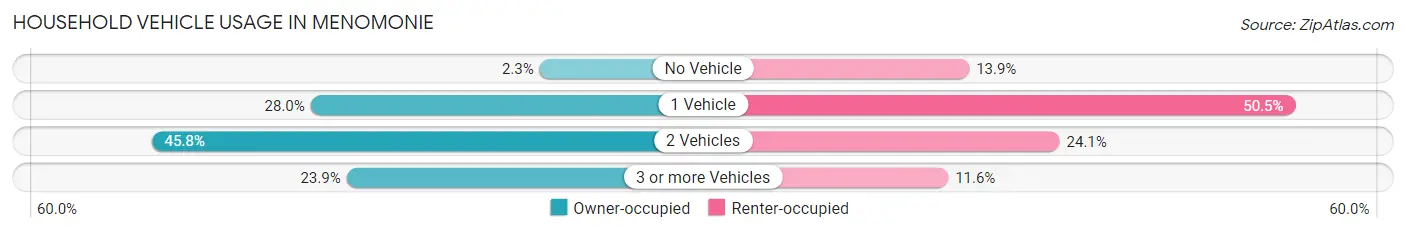
| Vehicles per Household | Owner-occupied | Renter-occupied |
| No Vehicle | 55 (2.3%) | 522 (13.9%) |
| 1 Vehicle | 662 (28.0%) | 1,892 (50.4%) |
| 2 Vehicles | 1,084 (45.8%) | 902 (24.0%) |
| 3 or more Vehicles | 567 (23.9%) | 434 (11.6%) |
| Total | 2,368 (100.0%) | 3,750 (100.0%) |
Real Estate & Mortgages in Menomonie
Real Estate and Mortgage Overview in Menomonie
| Characteristic | Without Mortgage | With Mortgage |
| Housing Units | 817 | 1,551 |
| Median Property Value | $158,600 | $195,400 |
| Median Household Income | $73,646 | $296 |
| Monthly Housing Costs | $635 | $50 |
| Real Estate Taxes | $3,309 | $27 |
Property Value by Mortgage Status in Menomonie
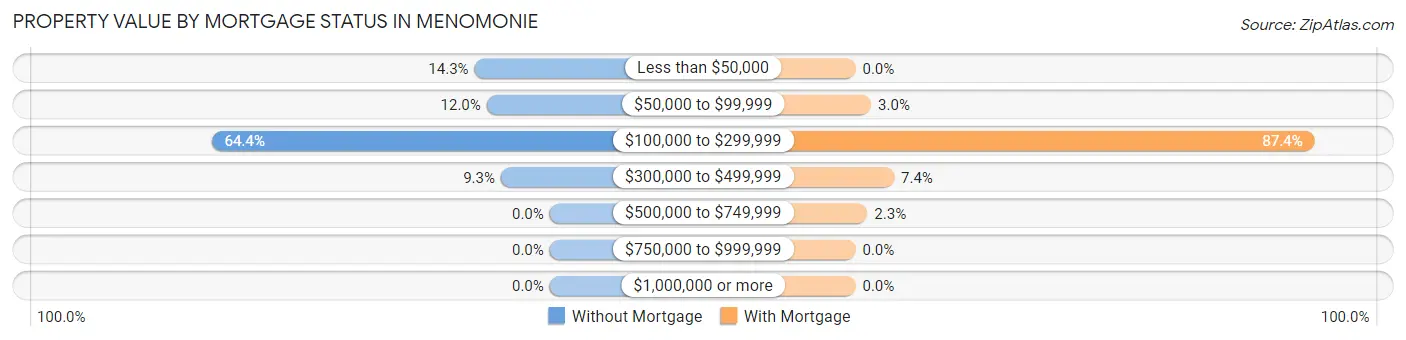
| Property Value | Without Mortgage | With Mortgage |
| Less than $50,000 | 117 (14.3%) | 0 (0.0%) |
| $50,000 to $99,999 | 98 (12.0%) | 46 (3.0%) |
| $100,000 to $299,999 | 526 (64.4%) | 1,356 (87.4%) |
| $300,000 to $499,999 | 76 (9.3%) | 114 (7.3%) |
| $500,000 to $749,999 | 0 (0.0%) | 35 (2.3%) |
| $750,000 to $999,999 | 0 (0.0%) | 0 (0.0%) |
| $1,000,000 or more | 0 (0.0%) | 0 (0.0%) |
| Total | 817 (100.0%) | 1,551 (100.0%) |
Household Income by Mortgage Status in Menomonie
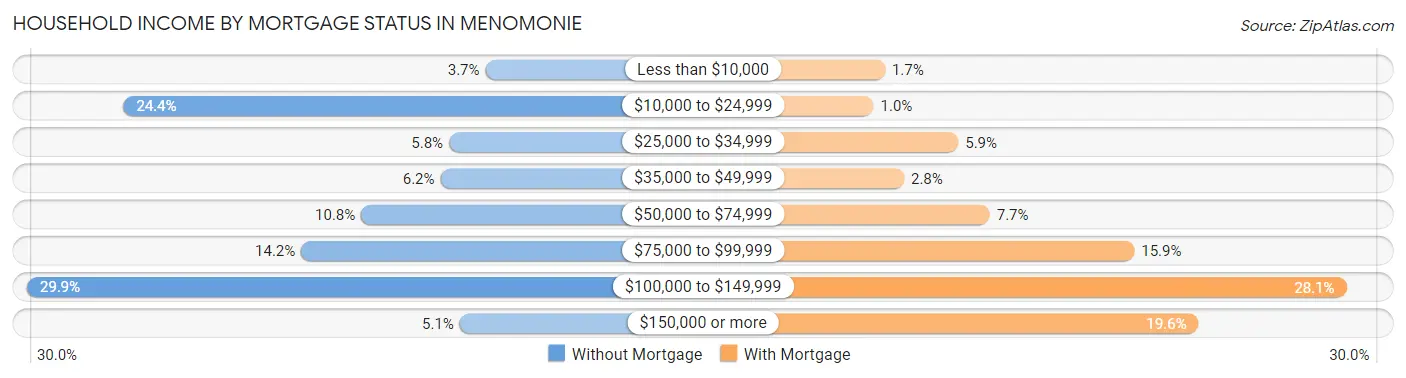
| Household Income | Without Mortgage | With Mortgage |
| Less than $10,000 | 30 (3.7%) | 26 (1.7%) |
| $10,000 to $24,999 | 199 (24.4%) | 16 (1.0%) |
| $25,000 to $34,999 | 47 (5.8%) | 91 (5.9%) |
| $35,000 to $49,999 | 51 (6.2%) | 43 (2.8%) |
| $50,000 to $74,999 | 88 (10.8%) | 119 (7.7%) |
| $75,000 to $99,999 | 116 (14.2%) | 247 (15.9%) |
| $100,000 to $149,999 | 244 (29.9%) | 435 (28.1%) |
| $150,000 or more | 42 (5.1%) | 304 (19.6%) |
| Total | 817 (100.0%) | 1,551 (100.0%) |
Property Value to Household Income Ratio in Menomonie
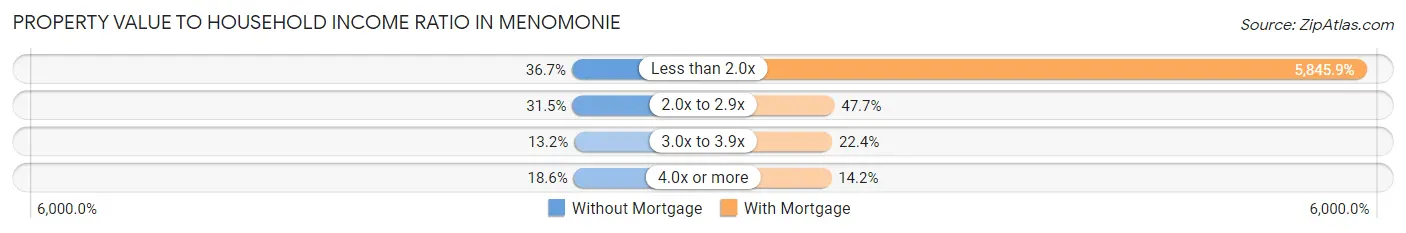
| Value-to-Income Ratio | Without Mortgage | With Mortgage |
| Less than 2.0x | 300 (36.7%) | 90,670 (5,845.9%) |
| 2.0x to 2.9x | 257 (31.5%) | 739 (47.6%) |
| 3.0x to 3.9x | 108 (13.2%) | 347 (22.4%) |
| 4.0x or more | 152 (18.6%) | 220 (14.2%) |
| Total | 817 (100.0%) | 1,551 (100.0%) |
Real Estate Taxes by Mortgage Status in Menomonie
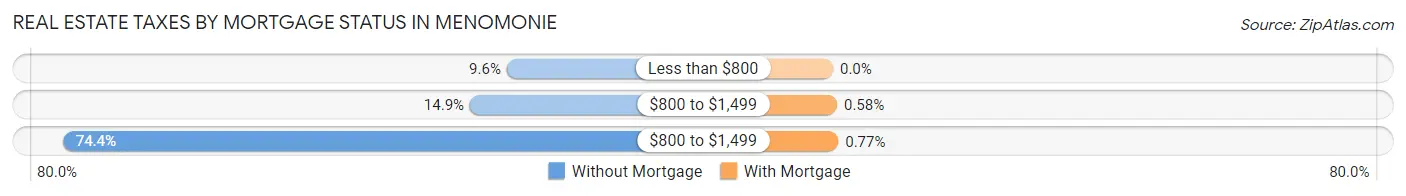
| Property Taxes | Without Mortgage | With Mortgage |
| Less than $800 | 78 (9.6%) | 0 (0.0%) |
| $800 to $1,499 | 122 (14.9%) | 9 (0.6%) |
| $800 to $1,499 | 608 (74.4%) | 12 (0.8%) |
| Total | 817 (100.0%) | 1,551 (100.0%) |
Health & Disability in Menomonie
Health Insurance Coverage by Age in Menomonie
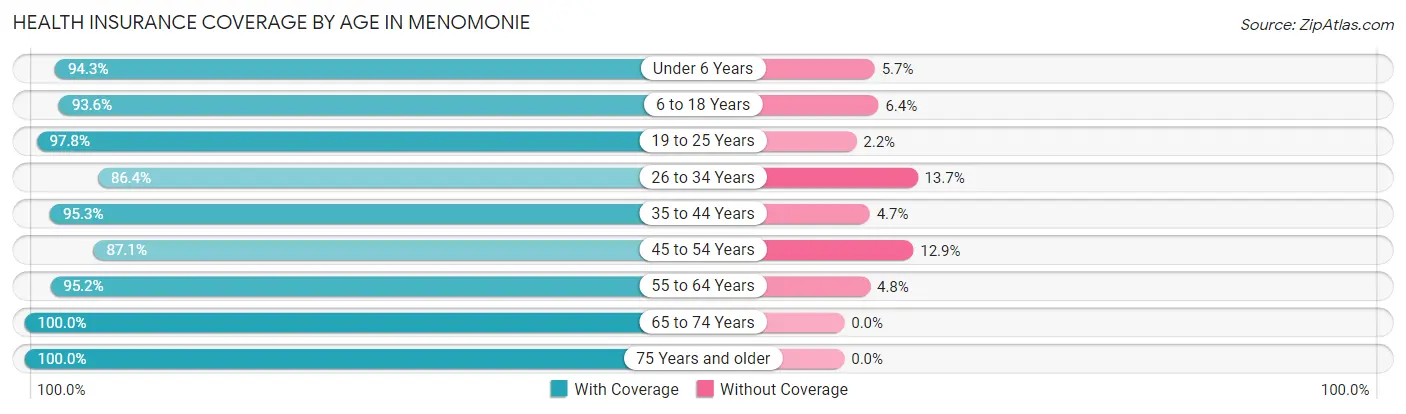
| Age Bracket | With Coverage | Without Coverage |
| Under 6 Years | 582 (94.3%) | 35 (5.7%) |
| 6 to 18 Years | 2,085 (93.6%) | 142 (6.4%) |
| 19 to 25 Years | 5,923 (97.8%) | 136 (2.2%) |
| 26 to 34 Years | 1,240 (86.4%) | 196 (13.7%) |
| 35 to 44 Years | 1,388 (95.3%) | 69 (4.7%) |
| 45 to 54 Years | 1,029 (87.1%) | 152 (12.9%) |
| 55 to 64 Years | 1,170 (95.2%) | 59 (4.8%) |
| 65 to 74 Years | 1,178 (100.0%) | 0 (0.0%) |
| 75 Years and older | 895 (100.0%) | 0 (0.0%) |
| Total | 15,490 (95.2%) | 789 (4.9%) |
Health Insurance Coverage by Citizenship Status in Menomonie
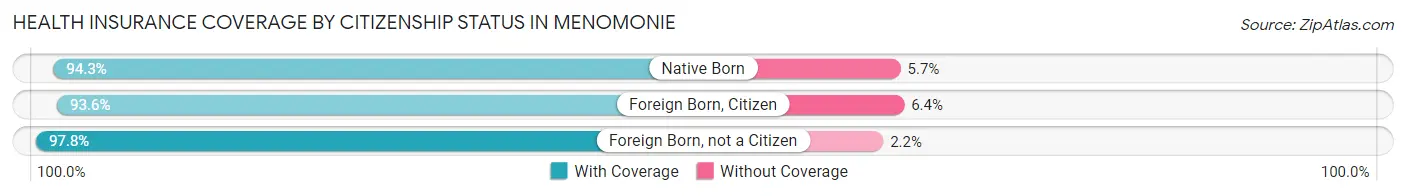
| Citizenship Status | With Coverage | Without Coverage |
| Native Born | 582 (94.3%) | 35 (5.7%) |
| Foreign Born, Citizen | 2,085 (93.6%) | 142 (6.4%) |
| Foreign Born, not a Citizen | 5,923 (97.8%) | 136 (2.2%) |
Health Insurance Coverage by Household Income in Menomonie
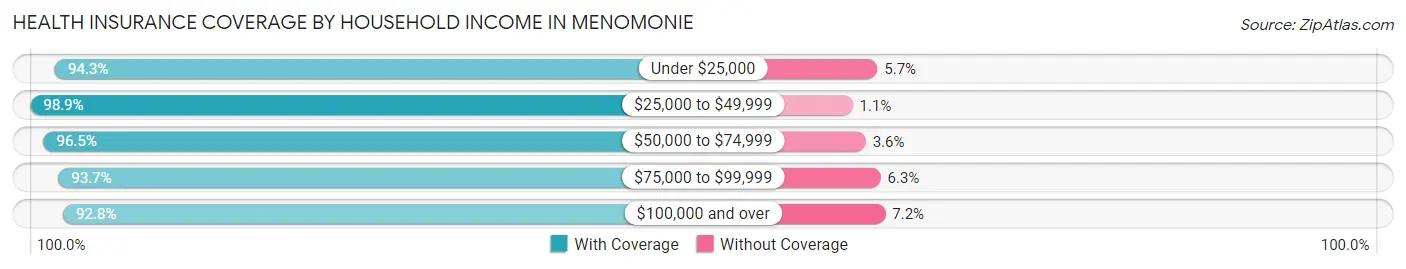
| Household Income | With Coverage | Without Coverage |
| Under $25,000 | 2,342 (94.3%) | 142 (5.7%) |
| $25,000 to $49,999 | 2,472 (98.9%) | 27 (1.1%) |
| $50,000 to $74,999 | 1,904 (96.5%) | 70 (3.5%) |
| $75,000 to $99,999 | 2,131 (93.7%) | 144 (6.3%) |
| $100,000 and over | 3,647 (92.8%) | 284 (7.2%) |
Public vs Private Health Insurance Coverage by Age in Menomonie
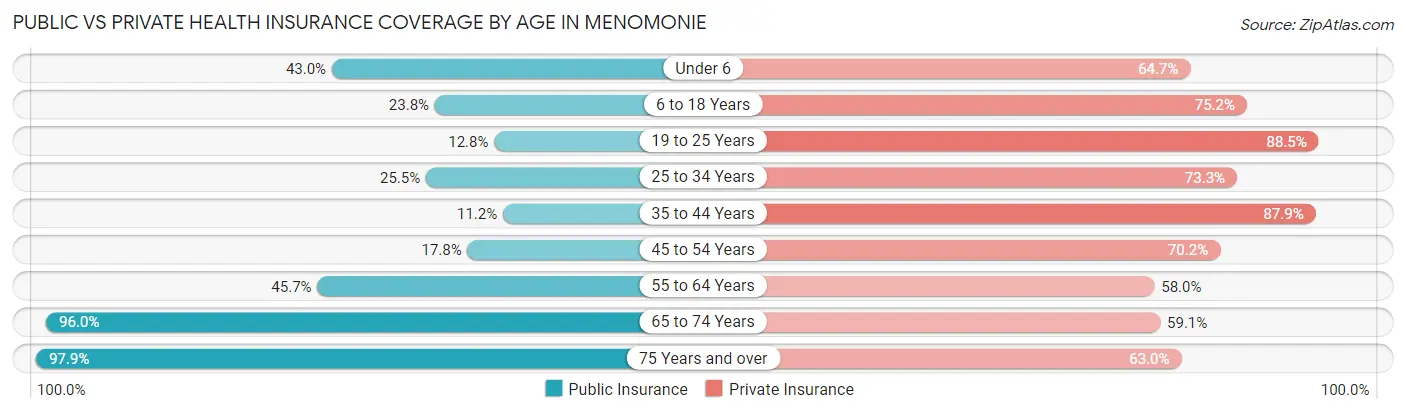
| Age Bracket | Public Insurance | Private Insurance |
| Under 6 | 265 (42.9%) | 399 (64.7%) |
| 6 to 18 Years | 531 (23.8%) | 1,674 (75.2%) |
| 19 to 25 Years | 777 (12.8%) | 5,362 (88.5%) |
| 25 to 34 Years | 366 (25.5%) | 1,053 (73.3%) |
| 35 to 44 Years | 163 (11.2%) | 1,281 (87.9%) |
| 45 to 54 Years | 210 (17.8%) | 829 (70.2%) |
| 55 to 64 Years | 561 (45.7%) | 713 (58.0%) |
| 65 to 74 Years | 1,131 (96.0%) | 696 (59.1%) |
| 75 Years and over | 876 (97.9%) | 564 (63.0%) |
| Total | 4,880 (30.0%) | 12,571 (77.2%) |
Disability Status by Sex by Age in Menomonie
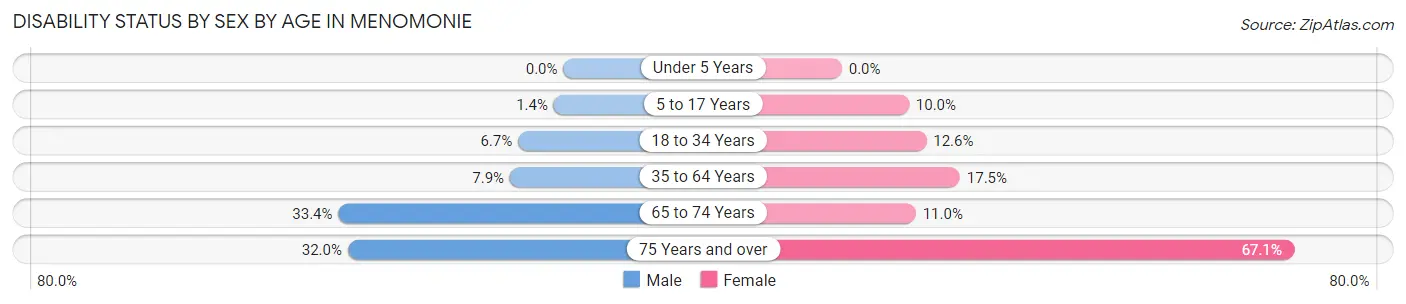
| Age Bracket | Male | Female |
| Under 5 Years | 0 (0.0%) | 0 (0.0%) |
| 5 to 17 Years | 10 (1.4%) | 72 (10.0%) |
| 18 to 34 Years | 292 (6.7%) | 510 (12.6%) |
| 35 to 64 Years | 157 (7.9%) | 331 (17.5%) |
| 65 to 74 Years | 138 (33.4%) | 84 (11.0%) |
| 75 Years and over | 89 (32.0%) | 414 (67.1%) |
Disability Class by Sex by Age in Menomonie
Disability Class: Hearing Difficulty
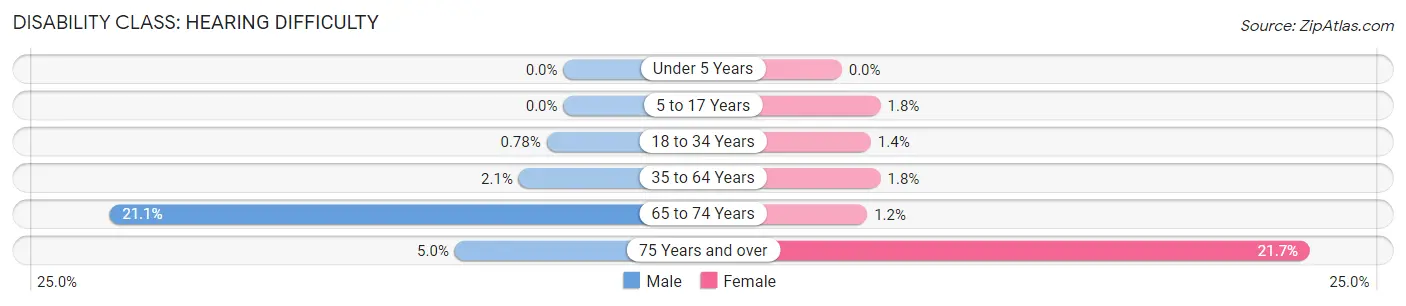
| Age Bracket | Male | Female |
| Under 5 Years | 0 (0.0%) | 0 (0.0%) |
| 5 to 17 Years | 0 (0.0%) | 13 (1.8%) |
| 18 to 34 Years | 34 (0.8%) | 55 (1.3%) |
| 35 to 64 Years | 41 (2.1%) | 34 (1.8%) |
| 65 to 74 Years | 87 (21.1%) | 9 (1.2%) |
| 75 Years and over | 14 (5.0%) | 134 (21.7%) |
Disability Class: Vision Difficulty
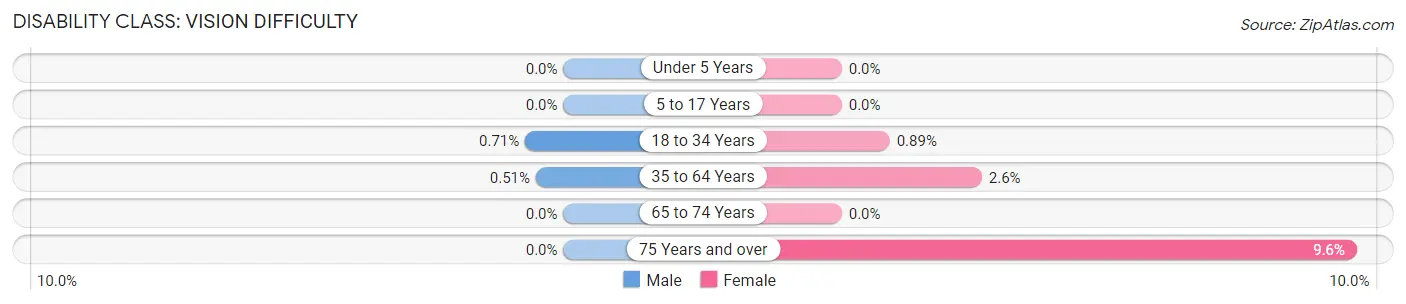
| Age Bracket | Male | Female |
| Under 5 Years | 0 (0.0%) | 0 (0.0%) |
| 5 to 17 Years | 0 (0.0%) | 0 (0.0%) |
| 18 to 34 Years | 31 (0.7%) | 36 (0.9%) |
| 35 to 64 Years | 10 (0.5%) | 49 (2.6%) |
| 65 to 74 Years | 0 (0.0%) | 0 (0.0%) |
| 75 Years and over | 0 (0.0%) | 59 (9.6%) |
Disability Class: Cognitive Difficulty
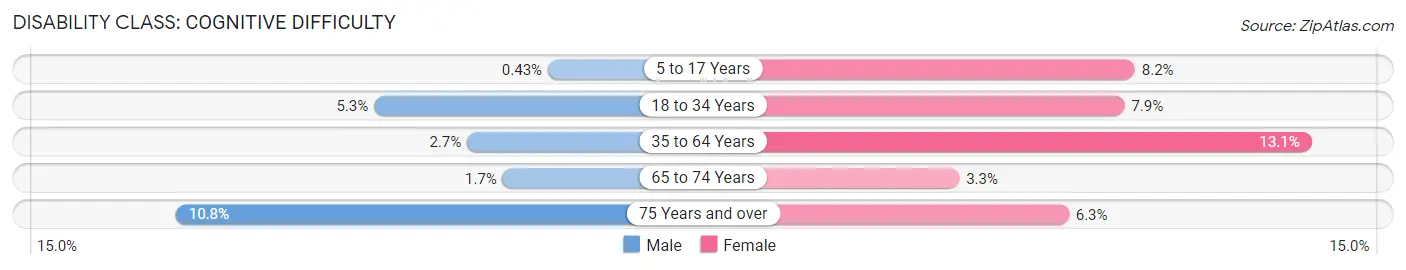
| Age Bracket | Male | Female |
| 5 to 17 Years | 3 (0.4%) | 59 (8.2%) |
| 18 to 34 Years | 229 (5.3%) | 320 (7.9%) |
| 35 to 64 Years | 53 (2.7%) | 247 (13.1%) |
| 65 to 74 Years | 7 (1.7%) | 25 (3.3%) |
| 75 Years and over | 30 (10.8%) | 39 (6.3%) |
Disability Class: Ambulatory Difficulty
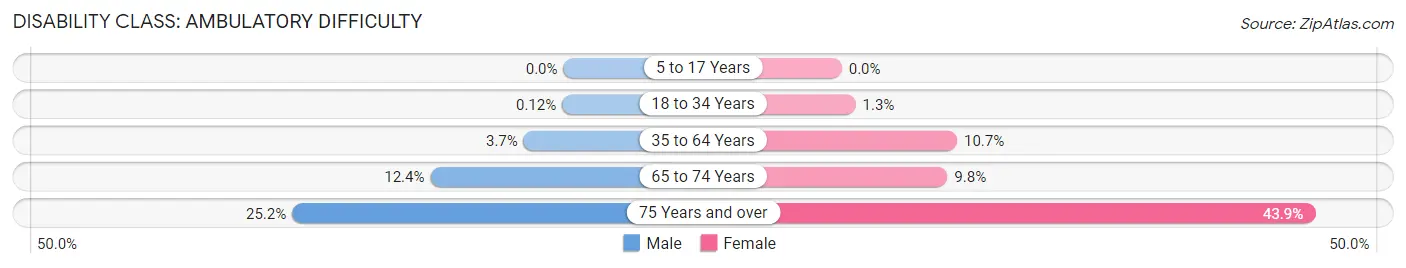
| Age Bracket | Male | Female |
| 5 to 17 Years | 0 (0.0%) | 0 (0.0%) |
| 18 to 34 Years | 5 (0.1%) | 52 (1.3%) |
| 35 to 64 Years | 73 (3.7%) | 202 (10.7%) |
| 65 to 74 Years | 51 (12.3%) | 75 (9.8%) |
| 75 Years and over | 70 (25.2%) | 271 (43.9%) |
Disability Class: Self-Care Difficulty
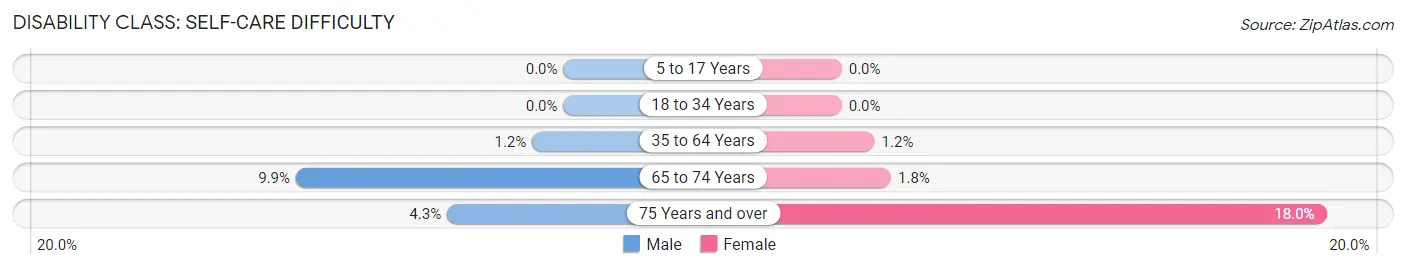
| Age Bracket | Male | Female |
| 5 to 17 Years | 0 (0.0%) | 0 (0.0%) |
| 18 to 34 Years | 0 (0.0%) | 0 (0.0%) |
| 35 to 64 Years | 23 (1.2%) | 23 (1.2%) |
| 65 to 74 Years | 41 (9.9%) | 14 (1.8%) |
| 75 Years and over | 12 (4.3%) | 111 (18.0%) |
Technology Access in Menomonie
Computing Device Access in Menomonie
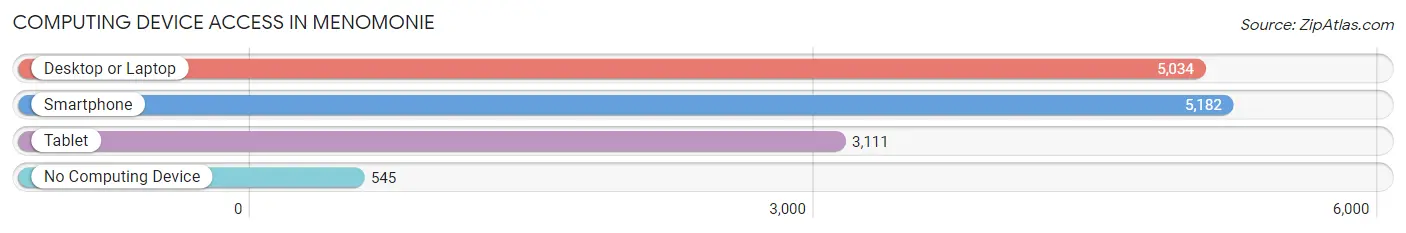
| Device Type | # Households | % Households |
| Desktop or Laptop | 5,034 | 82.3% |
| Smartphone | 5,182 | 84.7% |
| Tablet | 3,111 | 50.8% |
| No Computing Device | 545 | 8.9% |
| Total | 6,118 | 100.0% |
Internet Access in Menomonie
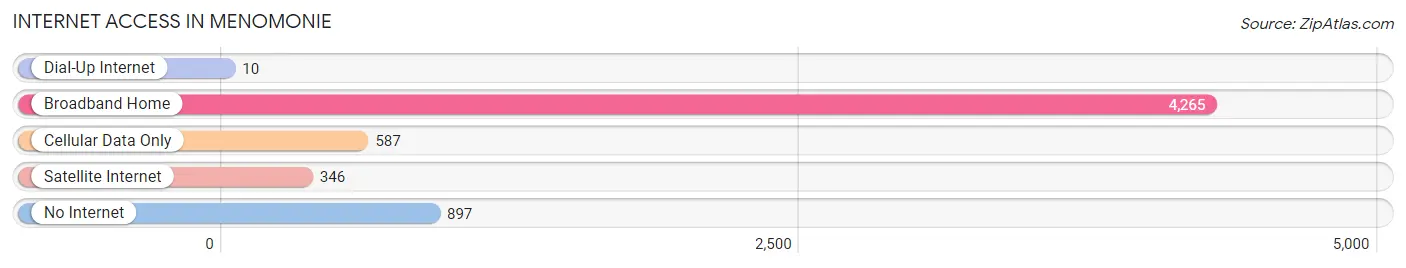
| Internet Type | # Households | % Households |
| Dial-Up Internet | 10 | 0.2% |
| Broadband Home | 4,265 | 69.7% |
| Cellular Data Only | 587 | 9.6% |
| Satellite Internet | 346 | 5.7% |
| No Internet | 897 | 14.7% |
| Total | 6,118 | 100.0% |
Menomonie Summary
Menomonie, Wisconsin is a city located in the western part of the state, in Dunn County. It is situated on the Red Cedar River, and is part of the Chippewa Valley region. The city has a population of 16,264, according to the 2010 census.
History
Menomonie was first settled in 1841 by a group of French-Canadian fur traders. The city was named after the Menominee tribe, who had a village in the area. The city was officially incorporated in 1883.
In the late 19th century, Menomonie was a major lumbering center, with several sawmills and lumberyards. The city was also home to a number of brickyards, which produced bricks for buildings in the area.
In the early 20th century, Menomonie became a center for the dairy industry. The city was home to several creameries, which produced butter and cheese. The city also had a number of cheese factories, which produced a variety of cheeses.
Geography
Menomonie is located in western Wisconsin, in Dunn County. The city is situated on the Red Cedar River, and is part of the Chippewa Valley region. The city is located about 50 miles east of Minneapolis, Minnesota.
The city has a total area of 8.3 square miles, of which 8.2 square miles is land and 0.1 square miles is water. The city is located at an elevation of 890 feet above sea level.
Economy
Menomonie’s economy is largely based on agriculture and manufacturing. The city is home to several dairy farms, as well as a number of food processing plants. The city is also home to a number of manufacturing companies, including a paper mill, a plastics plant, and a furniture factory.
The city is also home to the University of Wisconsin-Stout, which is a major employer in the area. The university has an enrollment of over 9,000 students, and employs over 1,000 faculty and staff.
Demographics
According to the 2010 census, Menomonie has a population of 16,264. The city has a median household income of $41,945, and a median family income of $54,945. The city has a poverty rate of 16.3%.
The city is predominantly white, with a population that is 94.2% white, 1.3% African American, 1.2% Asian, 0.7% Native American, and 2.6% other. The city has a population that is predominantly Christian, with a population that is 79.2% Christian, 0.7% Jewish, 0.3% Muslim, and 19.8% other.
Conclusion
Menomonie, Wisconsin is a city located in the western part of the state, in Dunn County. It is situated on the Red Cedar River, and is part of the Chippewa Valley region. The city has a population of 16,264, according to the 2010 census. Menomonie’s economy is largely based on agriculture and manufacturing, and the city is home to the University of Wisconsin-Stout. The city is predominantly white, with a population that is 94.2% white, 1.3% African American, 1.2% Asian, 0.7% Native American, and 2.6% other. The city has a median household income of $41,945, and a poverty rate of 16.3%.
Common Questions
What is Per Capita Income in Menomonie?
Per Capita income in Menomonie is $28,021.
What is the Median Family Income in Menomonie?
Median Family Income in Menomonie is $83,531.
What is the Median Household income in Menomonie?
Median Household Income in Menomonie is $51,250.
What is Income or Wage Gap in Menomonie?
Income or Wage Gap in Menomonie is 2.5%.
Women in Menomonie earn 97.5 cents for every dollar earned by a man.
What is Inequality or Gini Index in Menomonie?
Inequality or Gini Index in Menomonie is 0.45.
What is the Total Population of Menomonie?
Total Population of Menomonie is 16,563.
What is the Total Male Population of Menomonie?
Total Male Population of Menomonie is 8,043.
What is the Total Female Population of Menomonie?
Total Female Population of Menomonie is 8,520.
What is the Ratio of Males per 100 Females in Menomonie?
There are 94.40 Males per 100 Females in Menomonie.
What is the Ratio of Females per 100 Males in Menomonie?
There are 105.93 Females per 100 Males in Menomonie.
What is the Median Population Age in Menomonie?
Median Population Age in Menomonie is 24.0 Years.
What is the Average Family Size in Menomonie
Average Family Size in Menomonie is 2.9 People.
What is the Average Household Size in Menomonie
Average Household Size in Menomonie is 2.1 People.
How Large is the Labor Force in Menomonie?
There are 9,570 People in the Labor Forcein in Menomonie.
What is the Percentage of People in the Labor Force in Menomonie?
64.6% of People are in the Labor Force in Menomonie.
What is the Unemployment Rate in Menomonie?
Unemployment Rate in Menomonie is 3.6%.