Neenah, WI Map & Demographics
Neenah Map
Neenah Overview
$38,823
PER CAPITA INCOME
$92,679
AVG FAMILY INCOME
$71,280
AVG HOUSEHOLD INCOME
28.3%
WAGE / INCOME GAP [ % ]
71.7¢/ $1
WAGE / INCOME GAP [ $ ]
$9,474
FAMILY INCOME DEFICIT
0.43
INEQUALITY / GINI INDEX
27,309
TOTAL POPULATION
13,842
MALE POPULATION
13,467
FEMALE POPULATION
102.78
MALES / 100 FEMALES
97.29
FEMALES / 100 MALES
36.9
MEDIAN AGE
3.0
AVG FAMILY SIZE
2.4
AVG HOUSEHOLD SIZE
14,769
LABOR FORCE [ PEOPLE ]
69.5%
PERCENT IN LABOR FORCE
2.7%
UNEMPLOYMENT RATE
Neenah Zip Codes
Neenah Area Codes
Income in Neenah
Income Overview in Neenah
Per Capita Income in Neenah is $38,823, while median incomes of families and households are $92,679 and $71,280 respectively.
| Characteristic | Number | Measure |
| Per Capita Income | 27,309 | $38,823 |
| Median Family Income | 7,063 | $92,679 |
| Mean Family Income | 7,063 | $113,873 |
| Median Household Income | 11,262 | $71,280 |
| Mean Household Income | 11,262 | $92,444 |
| Income Deficit | 7,063 | $9,474 |
| Wage / Income Gap (%) | 27,309 | 28.25% |
| Wage / Income Gap ($) | 27,309 | 71.75¢ per $1 |
| Gini / Inequality Index | 27,309 | 0.43 |
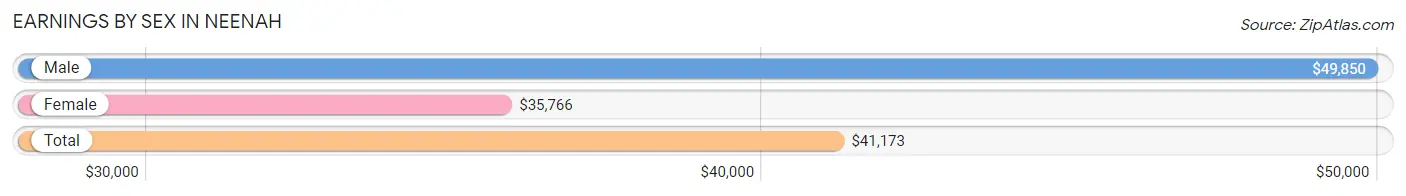
Earnings by Sex in Neenah
Average Earnings in Neenah are $41,173, $49,850 for men and $35,766 for women, a difference of 28.2%.
| Sex | Number | Average Earnings |
| Male | 8,460 (54.6%) | $49,850 |
| Female | 7,038 (45.4%) | $35,766 |
| Total | 15,498 (100.0%) | $41,173 |
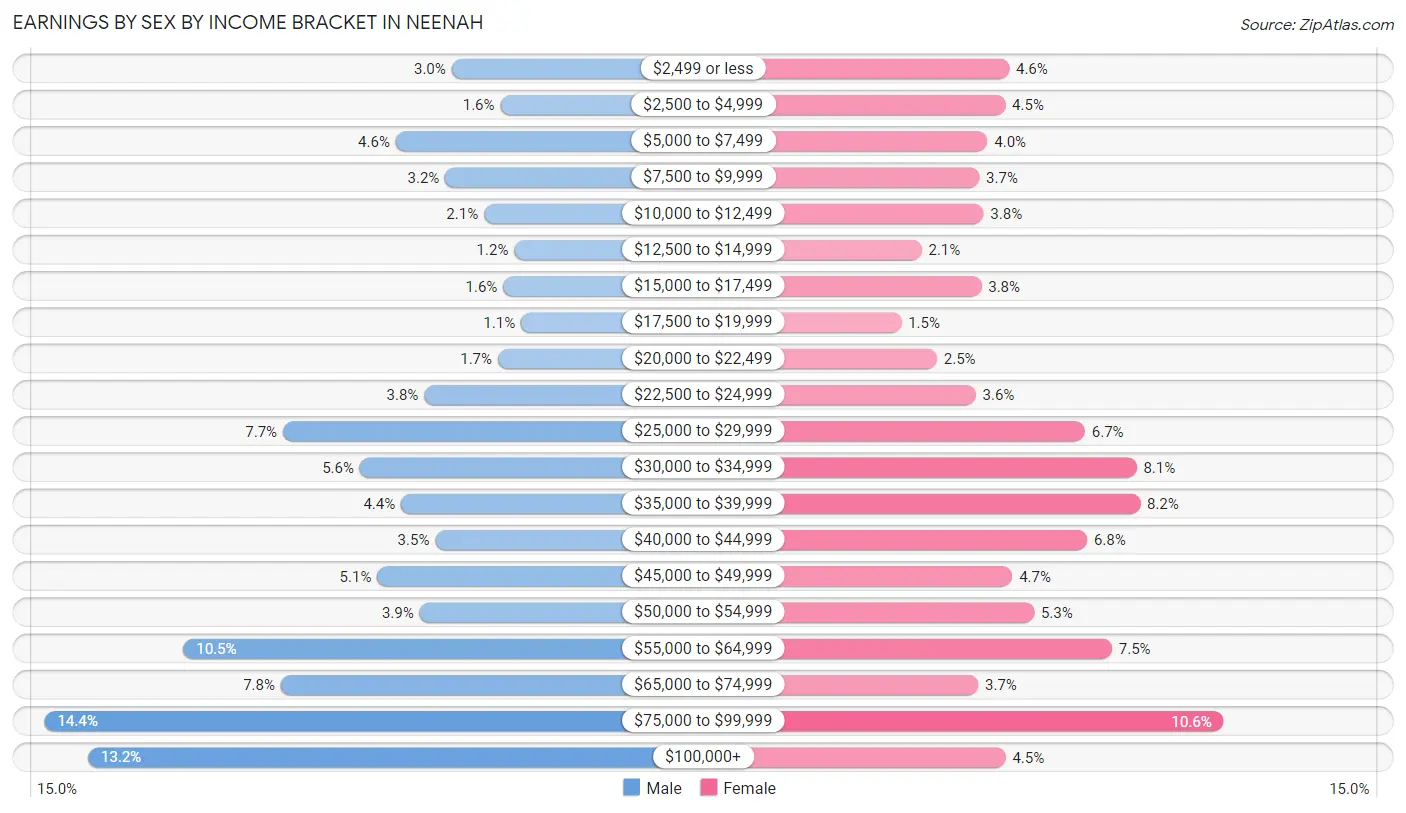
Earnings by Sex by Income Bracket in Neenah
The most common earnings brackets in Neenah are $75,000 to $99,999 for men (1,222 | 14.4%) and $75,000 to $99,999 for women (745 | 10.6%).
| Income | Male | Female |
| $2,499 or less | 254 (3.0%) | 321 (4.6%) |
| $2,500 to $4,999 | 138 (1.6%) | 313 (4.4%) |
| $5,000 to $7,499 | 387 (4.6%) | 278 (4.0%) |
| $7,500 to $9,999 | 269 (3.2%) | 262 (3.7%) |
| $10,000 to $12,499 | 177 (2.1%) | 270 (3.8%) |
| $12,500 to $14,999 | 105 (1.2%) | 148 (2.1%) |
| $15,000 to $17,499 | 131 (1.5%) | 266 (3.8%) |
| $17,500 to $19,999 | 89 (1.1%) | 108 (1.5%) |
| $20,000 to $22,499 | 144 (1.7%) | 178 (2.5%) |
| $22,500 to $24,999 | 319 (3.8%) | 255 (3.6%) |
| $25,000 to $29,999 | 655 (7.7%) | 471 (6.7%) |
| $30,000 to $34,999 | 472 (5.6%) | 573 (8.1%) |
| $35,000 to $39,999 | 374 (4.4%) | 580 (8.2%) |
| $40,000 to $44,999 | 293 (3.5%) | 475 (6.8%) |
| $45,000 to $49,999 | 431 (5.1%) | 327 (4.6%) |
| $50,000 to $54,999 | 330 (3.9%) | 370 (5.3%) |
| $55,000 to $64,999 | 892 (10.5%) | 524 (7.4%) |
| $65,000 to $74,999 | 660 (7.8%) | 260 (3.7%) |
| $75,000 to $99,999 | 1,222 (14.4%) | 745 (10.6%) |
| $100,000+ | 1,118 (13.2%) | 314 (4.5%) |
| Total | 8,460 (100.0%) | 7,038 (100.0%) |
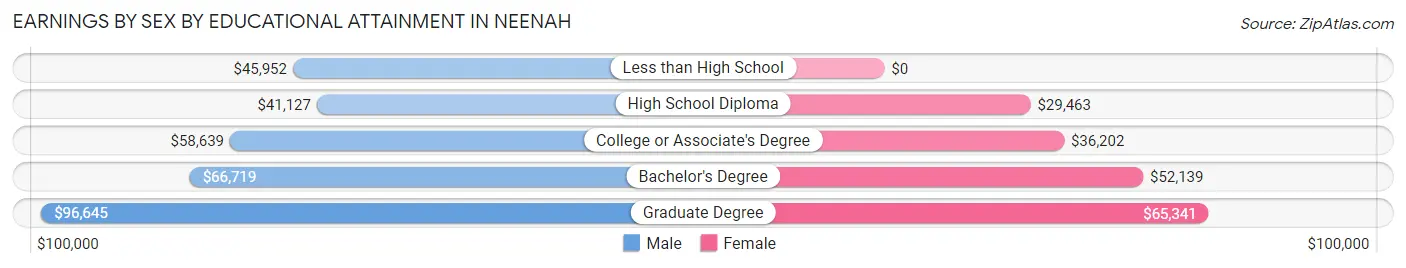
Earnings by Sex by Educational Attainment in Neenah
Average earnings in Neenah are $57,508 for men and $39,834 for women, a difference of 30.7%. Men with an educational attainment of graduate degree enjoy the highest average annual earnings of $96,645, while those with high school diploma education earn the least with $41,127. Women with an educational attainment of graduate degree earn the most with the average annual earnings of $65,341, while those with high school diploma education have the smallest earnings of $29,463.
| Educational Attainment | Male Income | Female Income |
| Less than High School | $45,952 | $0 |
| High School Diploma | $41,127 | $29,463 |
| College or Associate's Degree | $58,639 | $36,202 |
| Bachelor's Degree | $66,719 | $52,139 |
| Graduate Degree | $96,645 | $65,341 |
| Total | $57,508 | $39,834 |
Family Income in Neenah
Family Income Brackets in Neenah
According to the Neenah family income data, there are 1,610 families falling into the $100,000 to $149,999 income range, which is the most common income bracket and makes up 22.8% of all families. Conversely, the $10,000 to $14,999 income bracket is the least frequent group with only 78 families (1.1%) belonging to this category.
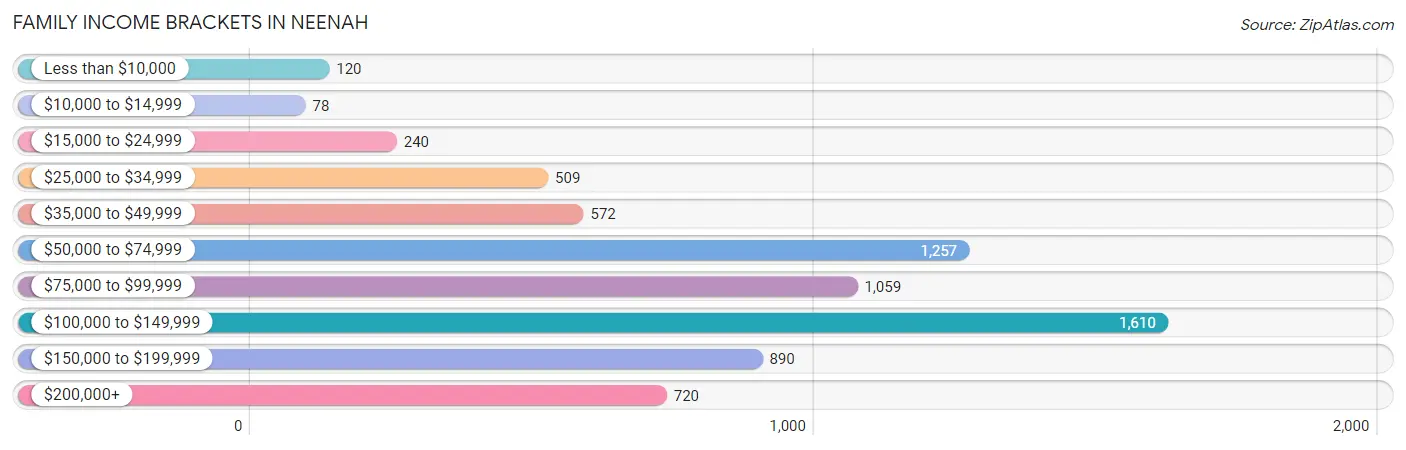
| Income Bracket | # Families | % Families |
| Less than $10,000 | 120 | 1.7% |
| $10,000 to $14,999 | 78 | 1.1% |
| $15,000 to $24,999 | 240 | 3.4% |
| $25,000 to $34,999 | 509 | 7.2% |
| $35,000 to $49,999 | 572 | 8.1% |
| $50,000 to $74,999 | 1,257 | 17.8% |
| $75,000 to $99,999 | 1,059 | 15.0% |
| $100,000 to $149,999 | 1,610 | 22.8% |
| $150,000 to $199,999 | 890 | 12.6% |
| $200,000+ | 720 | 10.2% |
Family Income by Famaliy Size in Neenah
5-person families (567 | 8.0%) account for the highest median family income in Neenah with $118,116 per family, while 2-person families (3,582 | 50.7%) have the highest median income of $39,223 per family member.
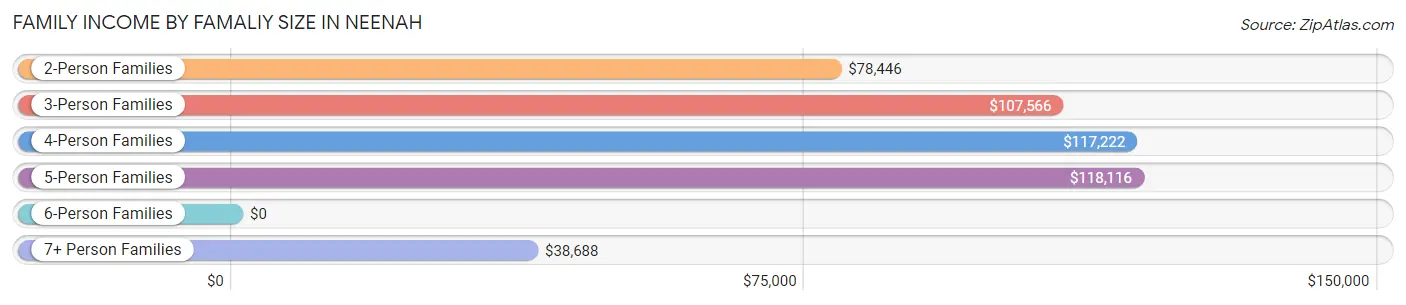
| Income Bracket | # Families | Median Income |
| 2-Person Families | 3,582 (50.7%) | $78,446 |
| 3-Person Families | 1,539 (21.8%) | $107,566 |
| 4-Person Families | 1,018 (14.4%) | $117,222 |
| 5-Person Families | 567 (8.0%) | $118,116 |
| 6-Person Families | 282 (4.0%) | $0 |
| 7+ Person Families | 75 (1.1%) | $38,688 |
| Total | 7,063 (100.0%) | $92,679 |
Family Income by Number of Earners in Neenah
The median family income in Neenah is $92,679, with families comprising 3+ earners (784) having the highest median family income of $154,205, while families with 1 earner (1,951) have the lowest median family income of $52,354, accounting for 11.1% and 27.6% of families, respectively.
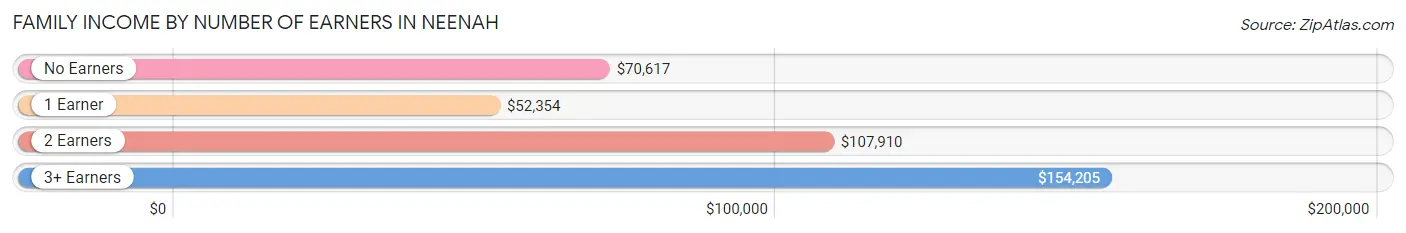
| Number of Earners | # Families | Median Income |
| No Earners | 1,066 (15.1%) | $70,617 |
| 1 Earner | 1,951 (27.6%) | $52,354 |
| 2 Earners | 3,262 (46.2%) | $107,910 |
| 3+ Earners | 784 (11.1%) | $154,205 |
| Total | 7,063 (100.0%) | $92,679 |
Household Income in Neenah
Household Income Brackets in Neenah
With 2,016 households falling in the category, the $50,000 to $74,999 income range is the most frequent in Neenah, accounting for 17.9% of all households. In contrast, only 248 households (2.2%) fall into the $10,000 to $14,999 income bracket, making it the least populous group.
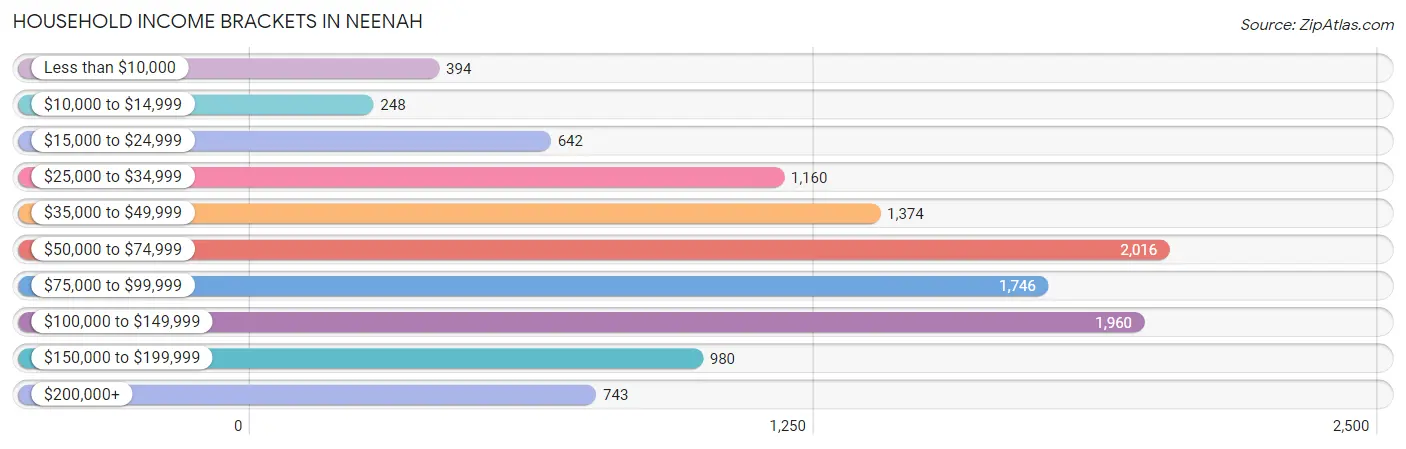
| Income Bracket | # Households | % Households |
| Less than $10,000 | 394 | 3.5% |
| $10,000 to $14,999 | 248 | 2.2% |
| $15,000 to $24,999 | 642 | 5.7% |
| $25,000 to $34,999 | 1,160 | 10.3% |
| $35,000 to $49,999 | 1,374 | 12.2% |
| $50,000 to $74,999 | 2,016 | 17.9% |
| $75,000 to $99,999 | 1,746 | 15.5% |
| $100,000 to $149,999 | 1,960 | 17.4% |
| $150,000 to $199,999 | 980 | 8.7% |
| $200,000+ | 743 | 6.6% |
Household Income by Householder Age in Neenah
The median household income in Neenah is $71,280, with the highest median household income of $82,230 found in the 45 to 64 years age bracket for the primary householder. A total of 4,136 households (36.7%) fall into this category. Meanwhile, the 65+ years age bracket for the primary householder has the lowest median household income of $47,461, with 2,731 households (24.2%) in this group.
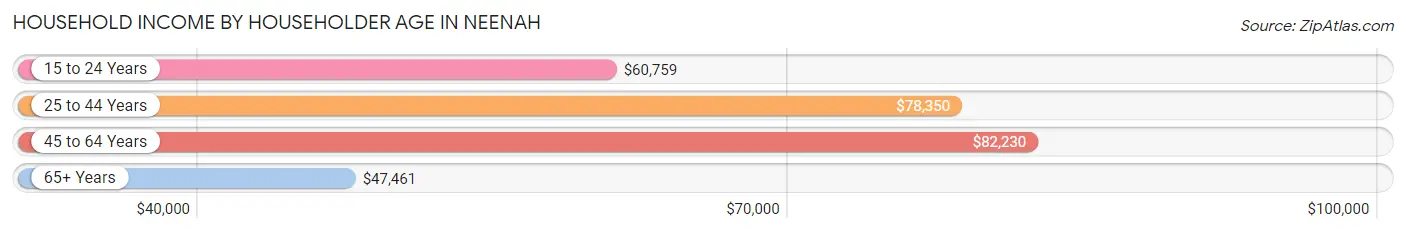
| Income Bracket | # Households | Median Income |
| 15 to 24 Years | 353 (3.1%) | $60,759 |
| 25 to 44 Years | 4,042 (35.9%) | $78,350 |
| 45 to 64 Years | 4,136 (36.7%) | $82,230 |
| 65+ Years | 2,731 (24.2%) | $47,461 |
| Total | 11,262 (100.0%) | $71,280 |
Poverty in Neenah
Income Below Poverty by Sex and Age in Neenah
With 10.7% poverty level for males and 9.8% for females among the residents of Neenah, 15 year old males and 5 year old females are the most vulnerable to poverty, with 119 males (49.2%) and 89 females (29.7%) in their respective age groups living below the poverty level.
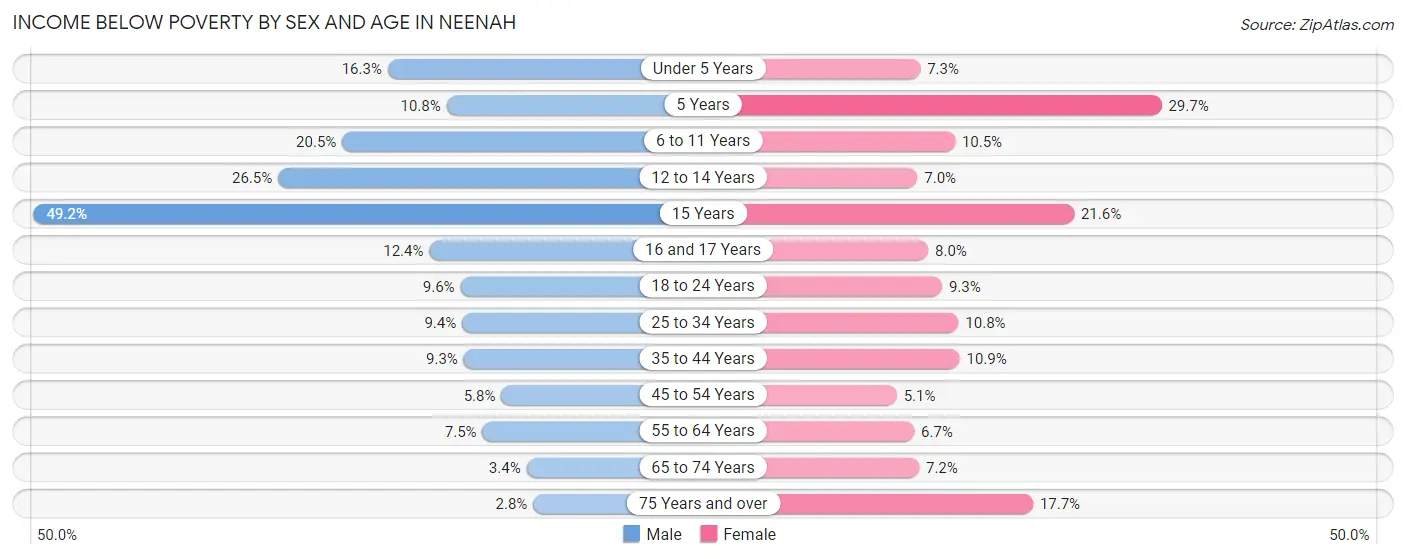
| Age Bracket | Male | Female |
| Under 5 Years | 149 (16.3%) | 47 (7.3%) |
| 5 Years | 22 (10.8%) | 89 (29.7%) |
| 6 to 11 Years | 247 (20.5%) | 135 (10.5%) |
| 12 to 14 Years | 134 (26.5%) | 22 (7.0%) |
| 15 Years | 119 (49.2%) | 64 (21.5%) |
| 16 and 17 Years | 56 (12.4%) | 31 (8.0%) |
| 18 to 24 Years | 95 (9.6%) | 93 (9.3%) |
| 25 to 34 Years | 212 (9.4%) | 191 (10.8%) |
| 35 to 44 Years | 169 (9.2%) | 201 (10.9%) |
| 45 to 54 Years | 106 (5.8%) | 89 (5.1%) |
| 55 to 64 Years | 112 (7.5%) | 109 (6.7%) |
| 65 to 74 Years | 34 (3.4%) | 91 (7.2%) |
| 75 Years and over | 24 (2.8%) | 143 (17.7%) |
| Total | 1,479 (10.7%) | 1,305 (9.8%) |
Income Above Poverty by Sex and Age in Neenah
According to the poverty statistics in Neenah, males aged 75 years and over and females aged 45 to 54 years are the age groups that are most secure financially, with 97.2% of males and 94.9% of females in these age groups living above the poverty line.
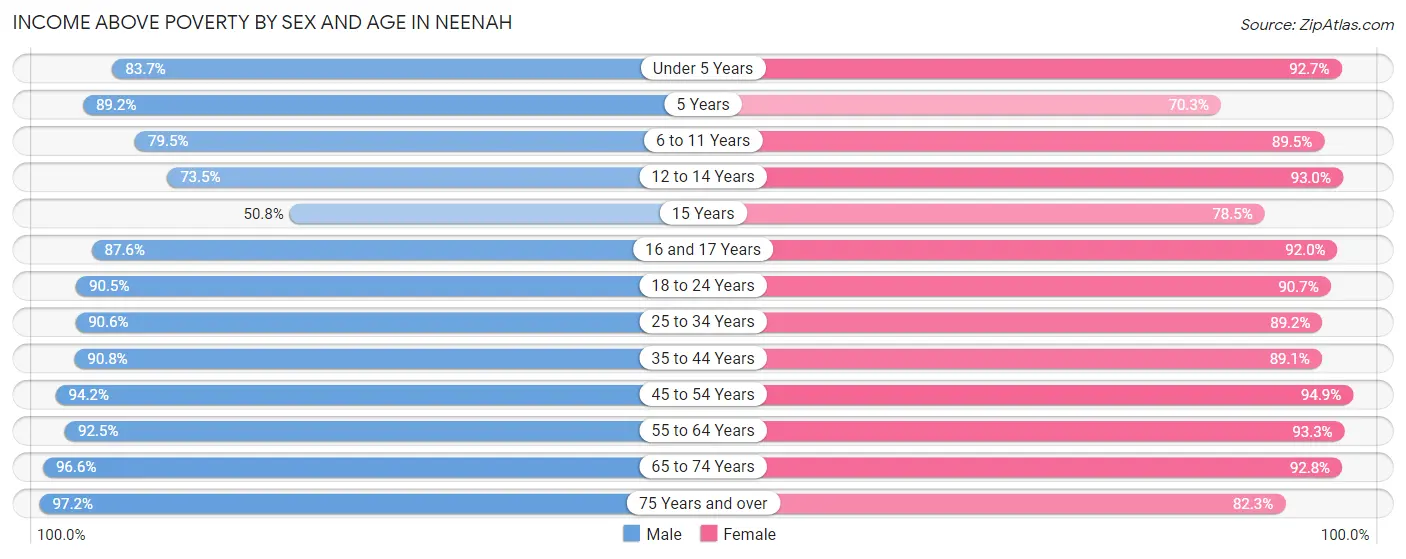
| Age Bracket | Male | Female |
| Under 5 Years | 765 (83.7%) | 599 (92.7%) |
| 5 Years | 181 (89.2%) | 211 (70.3%) |
| 6 to 11 Years | 956 (79.5%) | 1,151 (89.5%) |
| 12 to 14 Years | 372 (73.5%) | 292 (93.0%) |
| 15 Years | 123 (50.8%) | 233 (78.4%) |
| 16 and 17 Years | 394 (87.6%) | 356 (92.0%) |
| 18 to 24 Years | 900 (90.4%) | 907 (90.7%) |
| 25 to 34 Years | 2,043 (90.6%) | 1,574 (89.2%) |
| 35 to 44 Years | 1,659 (90.7%) | 1,638 (89.1%) |
| 45 to 54 Years | 1,734 (94.2%) | 1,656 (94.9%) |
| 55 to 64 Years | 1,379 (92.5%) | 1,515 (93.3%) |
| 65 to 74 Years | 960 (96.6%) | 1,179 (92.8%) |
| 75 Years and over | 834 (97.2%) | 663 (82.3%) |
| Total | 12,300 (89.3%) | 11,974 (90.2%) |
Income Below Poverty Among Married-Couple Families in Neenah
The poverty statistics for married-couple families in Neenah show that 3.0% or 151 of the total 4,974 families live below the poverty line. Families with 5 or more children have the highest poverty rate of 62.9%, comprising of 22 families. On the other hand, families with 1 or 2 children have the lowest poverty rate of 0.6%, which includes 9 families.
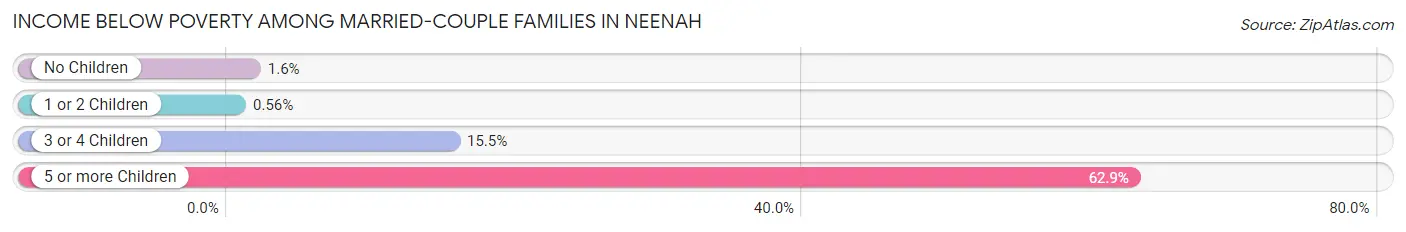
| Children | Above Poverty | Below Poverty |
| No Children | 2,788 (98.4%) | 45 (1.6%) |
| 1 or 2 Children | 1,612 (99.4%) | 9 (0.6%) |
| 3 or 4 Children | 410 (84.5%) | 75 (15.5%) |
| 5 or more Children | 13 (37.1%) | 22 (62.9%) |
| Total | 4,823 (97.0%) | 151 (3.0%) |
Income Below Poverty Among Single-Parent Households in Neenah
According to the poverty data in Neenah, 15.3% or 93 single-father households and 18.0% or 266 single-mother households are living below the poverty line. Among single-father households, those with 1 or 2 children have the highest poverty rate, with 60 households (22.2%) experiencing poverty. Likewise, among single-mother households, those with 3 or 4 children have the highest poverty rate, with 106 households (73.6%) falling below the poverty line.
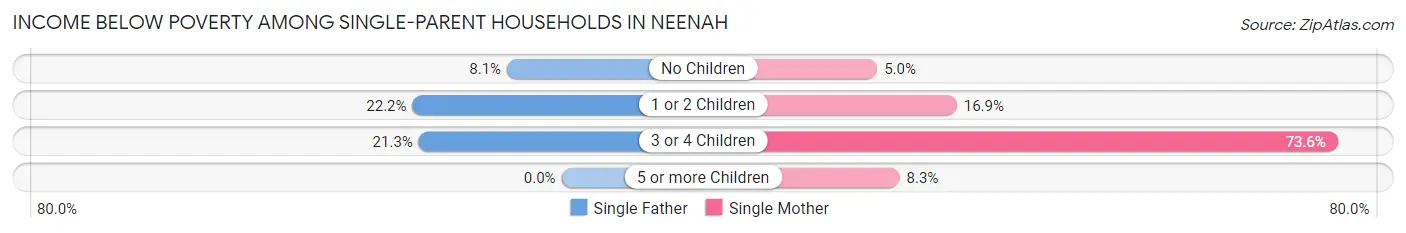
| Children | Single Father | Single Mother |
| No Children | 23 (8.1%) | 25 (5.0%) |
| 1 or 2 Children | 60 (22.2%) | 129 (16.9%) |
| 3 or 4 Children | 10 (21.3%) | 106 (73.6%) |
| 5 or more Children | 0 (0.0%) | 6 (8.3%) |
| Total | 93 (15.3%) | 266 (18.0%) |
Income Below Poverty Among Married-Couple vs Single-Parent Households in Neenah
The poverty data for Neenah shows that 151 of the married-couple family households (3.0%) and 359 of the single-parent households (17.2%) are living below the poverty level. Within the married-couple family households, those with 5 or more children have the highest poverty rate, with 22 households (62.9%) falling below the poverty line. Among the single-parent households, those with 3 or 4 children have the highest poverty rate, with 116 household (60.7%) living below poverty.
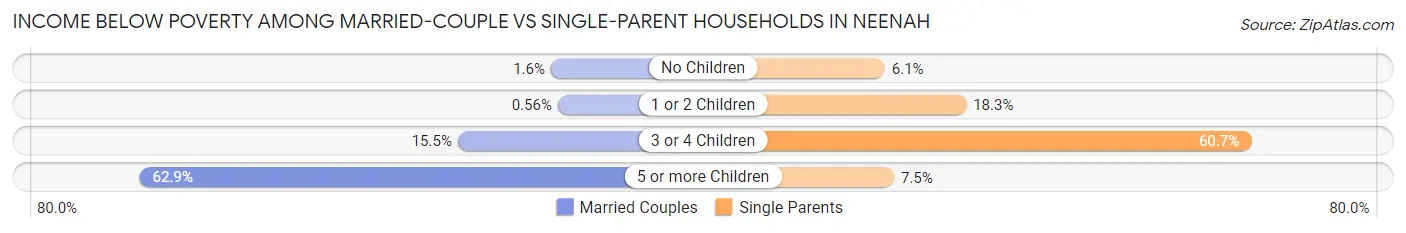
| Children | Married-Couple Families | Single-Parent Households |
| No Children | 45 (1.6%) | 48 (6.1%) |
| 1 or 2 Children | 9 (0.6%) | 189 (18.3%) |
| 3 or 4 Children | 75 (15.5%) | 116 (60.7%) |
| 5 or more Children | 22 (62.9%) | 6 (7.5%) |
| Total | 151 (3.0%) | 359 (17.2%) |
Race in Neenah
The most populous races in Neenah are White / Caucasian (24,343 | 89.1%), Hispanic or Latino (1,392 | 5.1%), and Two or more Races (1,229 | 4.5%).
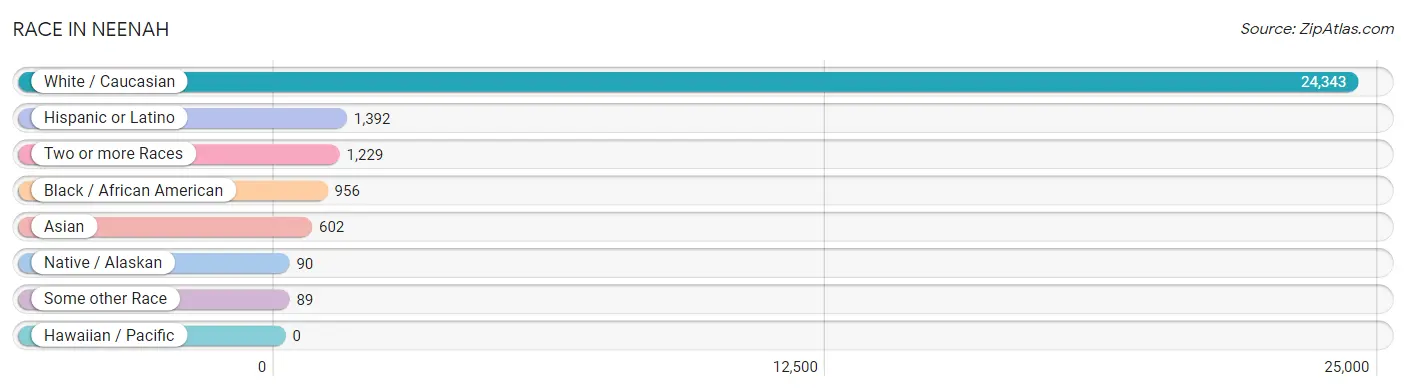
| Race | # Population | % Population |
| Asian | 602 | 2.2% |
| Black / African American | 956 | 3.5% |
| Hawaiian / Pacific | 0 | 0.0% |
| Hispanic or Latino | 1,392 | 5.1% |
| Native / Alaskan | 90 | 0.3% |
| White / Caucasian | 24,343 | 89.1% |
| Two or more Races | 1,229 | 4.5% |
| Some other Race | 89 | 0.3% |
| Total | 27,309 | 100.0% |
Ancestry in Neenah
The most populous ancestries reported in Neenah are German (10,818 | 39.6%), Irish (2,889 | 10.6%), English (1,908 | 7.0%), Polish (1,807 | 6.6%), and Norwegian (1,592 | 5.8%), together accounting for 69.6% of all Neenah residents.
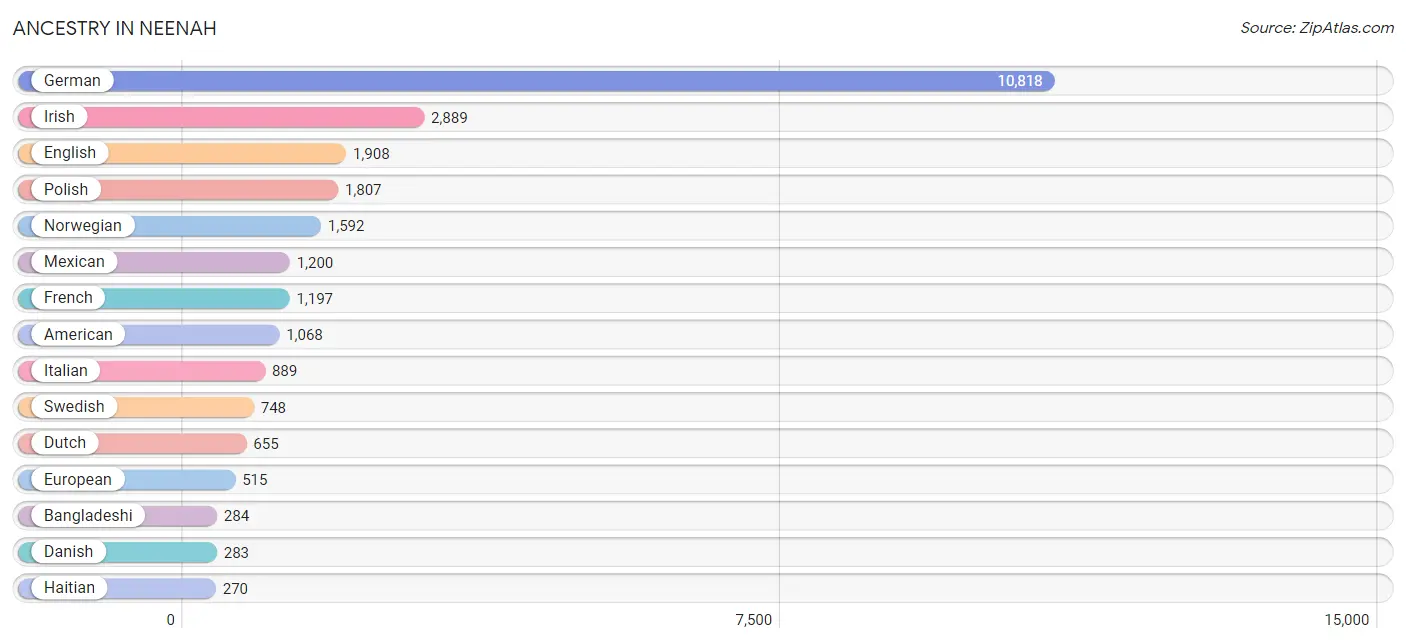
| Ancestry | # Population | % Population |
| American | 1,068 | 3.9% |
| Arab | 67 | 0.3% |
| Austrian | 105 | 0.4% |
| Bangladeshi | 284 | 1.0% |
| Belgian | 258 | 0.9% |
| Blackfeet | 7 | 0.0% |
| Brazilian | 13 | 0.1% |
| British | 130 | 0.5% |
| Burmese | 74 | 0.3% |
| Cajun | 18 | 0.1% |
| Canadian | 44 | 0.2% |
| Central American | 28 | 0.1% |
| Central American Indian | 44 | 0.2% |
| Cherokee | 15 | 0.1% |
| Chippewa | 24 | 0.1% |
| Choctaw | 17 | 0.1% |
| Creek | 5 | 0.0% |
| Croatian | 10 | 0.0% |
| Cuban | 31 | 0.1% |
| Czech | 228 | 0.8% |
| Czechoslovakian | 68 | 0.3% |
| Danish | 283 | 1.0% |
| Dominican | 25 | 0.1% |
| Dutch | 655 | 2.4% |
| Eastern European | 26 | 0.1% |
| English | 1,908 | 7.0% |
| European | 515 | 1.9% |
| Finnish | 197 | 0.7% |
| French | 1,197 | 4.4% |
| French Canadian | 244 | 0.9% |
| German | 10,818 | 39.6% |
| German Russian | 4 | 0.0% |
| Greek | 18 | 0.1% |
| Haitian | 270 | 1.0% |
| Honduran | 28 | 0.1% |
| Hungarian | 59 | 0.2% |
| Indian (Asian) | 184 | 0.7% |
| Iranian | 9 | 0.0% |
| Irish | 2,889 | 10.6% |
| Iroquois | 51 | 0.2% |
| Italian | 889 | 3.3% |
| Korean | 48 | 0.2% |
| Latvian | 23 | 0.1% |
| Lebanese | 40 | 0.2% |
| Lithuanian | 17 | 0.1% |
| Menominee | 38 | 0.1% |
| Mexican | 1,200 | 4.4% |
| Navajo | 12 | 0.0% |
| Nigerian | 4 | 0.0% |
| Northern European | 45 | 0.2% |
| Norwegian | 1,592 | 5.8% |
| Pakistani | 6 | 0.0% |
| Polish | 1,807 | 6.6% |
| Potawatomi | 51 | 0.2% |
| Puerto Rican | 81 | 0.3% |
| Russian | 91 | 0.3% |
| Scandinavian | 127 | 0.5% |
| Scotch-Irish | 83 | 0.3% |
| Scottish | 217 | 0.8% |
| Serbian | 12 | 0.0% |
| Slavic | 54 | 0.2% |
| Slovak | 12 | 0.0% |
| Slovene | 14 | 0.1% |
| Sri Lankan | 13 | 0.1% |
| Subsaharan African | 171 | 0.6% |
| Sudanese | 167 | 0.6% |
| Swedish | 748 | 2.7% |
| Swiss | 166 | 0.6% |
| Syrian | 27 | 0.1% |
| Thai | 75 | 0.3% |
| Ukrainian | 11 | 0.0% |
| Welsh | 144 | 0.5% | View All 72 Rows |
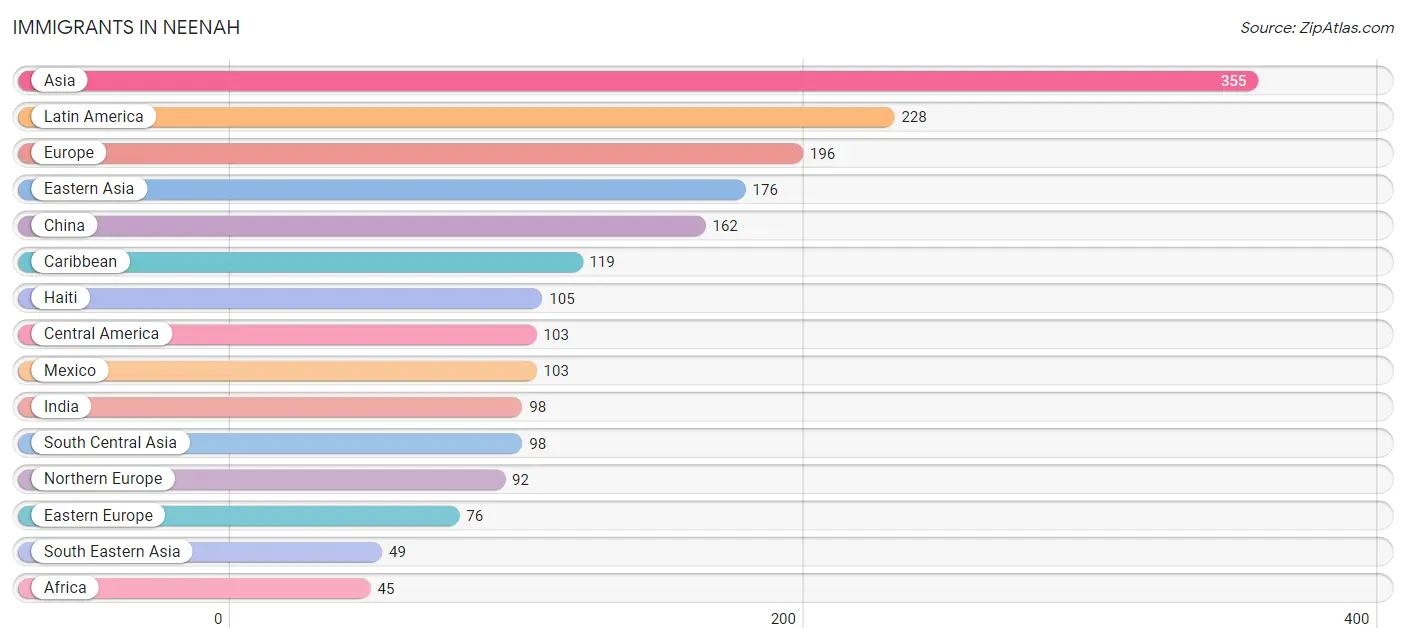
Immigrants in Neenah
The most numerous immigrant groups reported in Neenah came from Asia (355 | 1.3%), Latin America (228 | 0.8%), Europe (196 | 0.7%), Eastern Asia (176 | 0.6%), and China (162 | 0.6%), together accounting for 4.1% of all Neenah residents.
| Immigration Origin | # Population | % Population |
| Africa | 45 | 0.2% |
| Asia | 355 | 1.3% |
| Austria | 12 | 0.0% |
| Belarus | 17 | 0.1% |
| Brazil | 6 | 0.0% |
| Canada | 32 | 0.1% |
| Caribbean | 119 | 0.4% |
| Central America | 103 | 0.4% |
| China | 162 | 0.6% |
| Dominican Republic | 14 | 0.1% |
| Eastern Asia | 176 | 0.6% |
| Eastern Europe | 76 | 0.3% |
| Egypt | 22 | 0.1% |
| England | 22 | 0.1% |
| Europe | 196 | 0.7% |
| Germany | 4 | 0.0% |
| Haiti | 105 | 0.4% |
| India | 98 | 0.4% |
| Ireland | 25 | 0.1% |
| Korea | 14 | 0.1% |
| Laos | 43 | 0.2% |
| Latin America | 228 | 0.8% |
| Latvia | 20 | 0.1% |
| Mexico | 103 | 0.4% |
| Netherlands | 12 | 0.0% |
| Northern Africa | 45 | 0.2% |
| Northern Europe | 92 | 0.3% |
| Poland | 13 | 0.1% |
| Russia | 26 | 0.1% |
| South America | 6 | 0.0% |
| South Central Asia | 98 | 0.4% |
| South Eastern Asia | 49 | 0.2% |
| Sudan | 23 | 0.1% |
| Syria | 23 | 0.1% |
| Vietnam | 6 | 0.0% |
| Western Asia | 32 | 0.1% |
| Western Europe | 28 | 0.1% | View All 37 Rows |
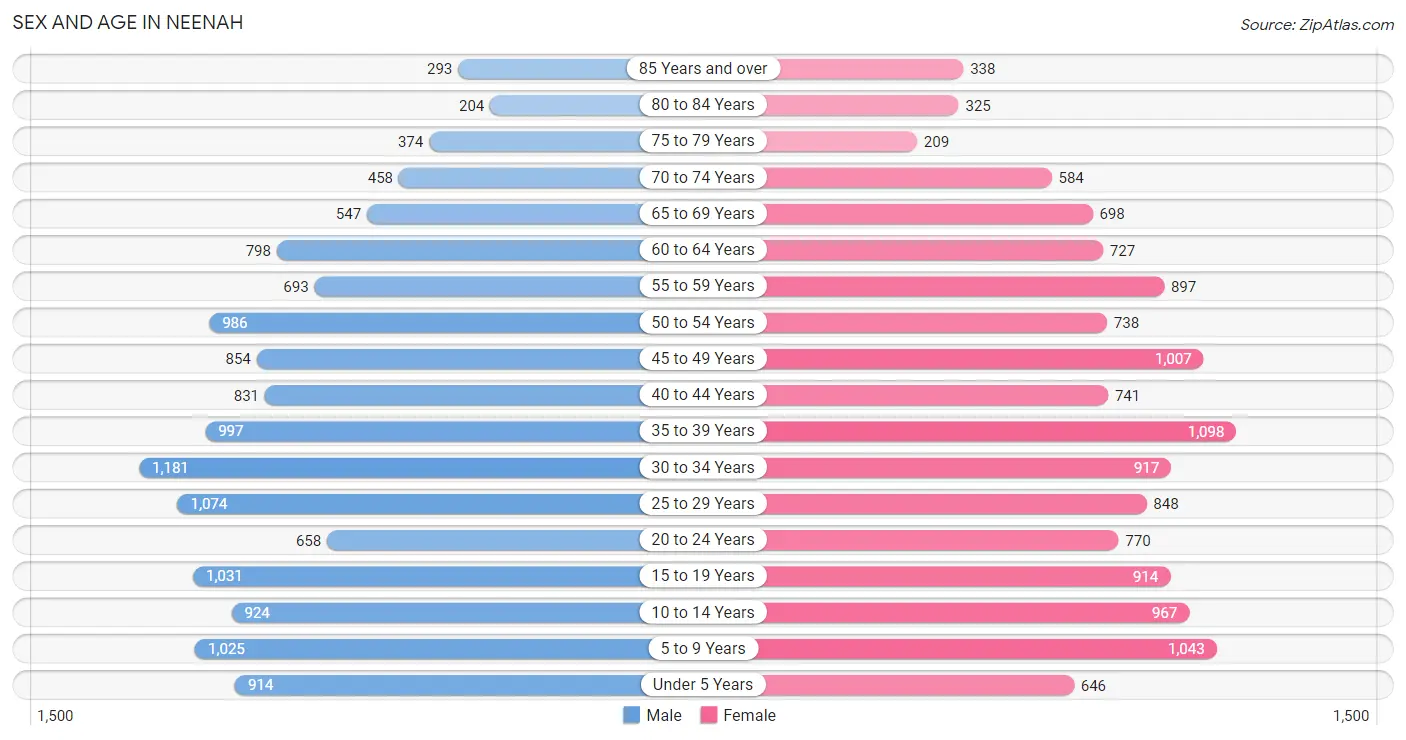
Sex and Age in Neenah
Sex and Age in Neenah
The most populous age groups in Neenah are 30 to 34 Years (1,181 | 8.5%) for men and 35 to 39 Years (1,098 | 8.2%) for women.
| Age Bracket | Male | Female |
| Under 5 Years | 914 (6.6%) | 646 (4.8%) |
| 5 to 9 Years | 1,025 (7.4%) | 1,043 (7.7%) |
| 10 to 14 Years | 924 (6.7%) | 967 (7.2%) |
| 15 to 19 Years | 1,031 (7.4%) | 914 (6.8%) |
| 20 to 24 Years | 658 (4.8%) | 770 (5.7%) |
| 25 to 29 Years | 1,074 (7.8%) | 848 (6.3%) |
| 30 to 34 Years | 1,181 (8.5%) | 917 (6.8%) |
| 35 to 39 Years | 997 (7.2%) | 1,098 (8.2%) |
| 40 to 44 Years | 831 (6.0%) | 741 (5.5%) |
| 45 to 49 Years | 854 (6.2%) | 1,007 (7.5%) |
| 50 to 54 Years | 986 (7.1%) | 738 (5.5%) |
| 55 to 59 Years | 693 (5.0%) | 897 (6.7%) |
| 60 to 64 Years | 798 (5.8%) | 727 (5.4%) |
| 65 to 69 Years | 547 (4.0%) | 698 (5.2%) |
| 70 to 74 Years | 458 (3.3%) | 584 (4.3%) |
| 75 to 79 Years | 374 (2.7%) | 209 (1.5%) |
| 80 to 84 Years | 204 (1.5%) | 325 (2.4%) |
| 85 Years and over | 293 (2.1%) | 338 (2.5%) |
| Total | 13,842 (100.0%) | 13,467 (100.0%) |
Families and Households in Neenah
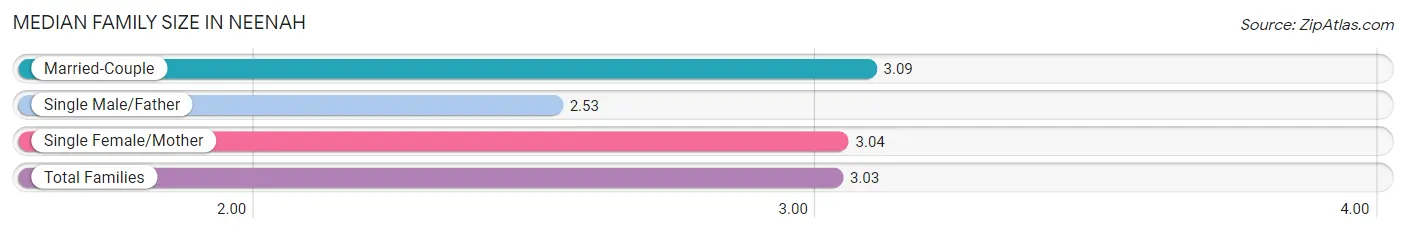
Median Family Size in Neenah
The median family size in Neenah is 3.03 persons per family, with married-couple families (4,974 | 70.4%) accounting for the largest median family size of 3.09 persons per family. On the other hand, single male/father families (608 | 8.6%) represent the smallest median family size with 2.53 persons per family.
| Family Type | # Families | Family Size |
| Married-Couple | 4,974 (70.4%) | 3.09 |
| Single Male/Father | 608 (8.6%) | 2.53 |
| Single Female/Mother | 1,481 (21.0%) | 3.04 |
| Total Families | 7,063 (100.0%) | 3.03 |
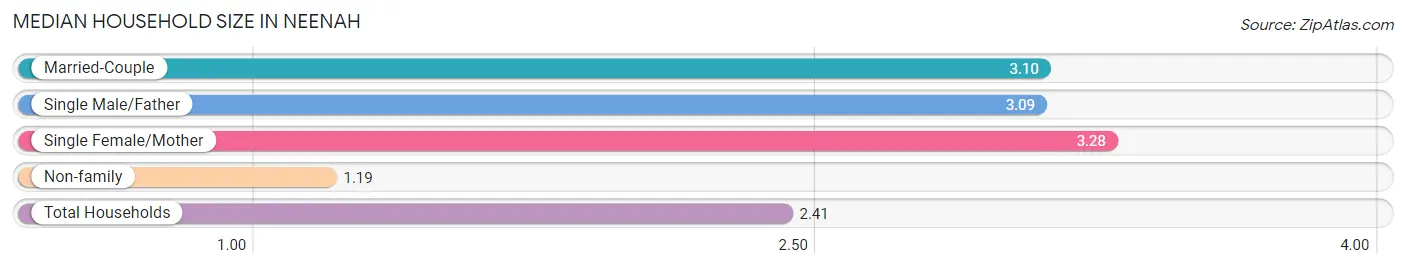
Median Household Size in Neenah
The median household size in Neenah is 2.41 persons per household, with single female/mother households (1,481 | 13.2%) accounting for the largest median household size of 3.28 persons per household. non-family households (4,199 | 37.3%) represent the smallest median household size with 1.19 persons per household.
| Household Type | # Households | Household Size |
| Married-Couple | 4,974 (44.2%) | 3.10 |
| Single Male/Father | 608 (5.4%) | 3.09 |
| Single Female/Mother | 1,481 (13.2%) | 3.28 |
| Non-family | 4,199 (37.3%) | 1.19 |
| Total Households | 11,262 (100.0%) | 2.41 |
Household Size by Marriage Status in Neenah
Out of a total of 11,262 households in Neenah, 7,063 (62.7%) are family households, while 4,199 (37.3%) are nonfamily households. The most numerous type of family households are 2-person households, comprising 3,223, and the most common type of nonfamily households are 1-person households, comprising 3,556.
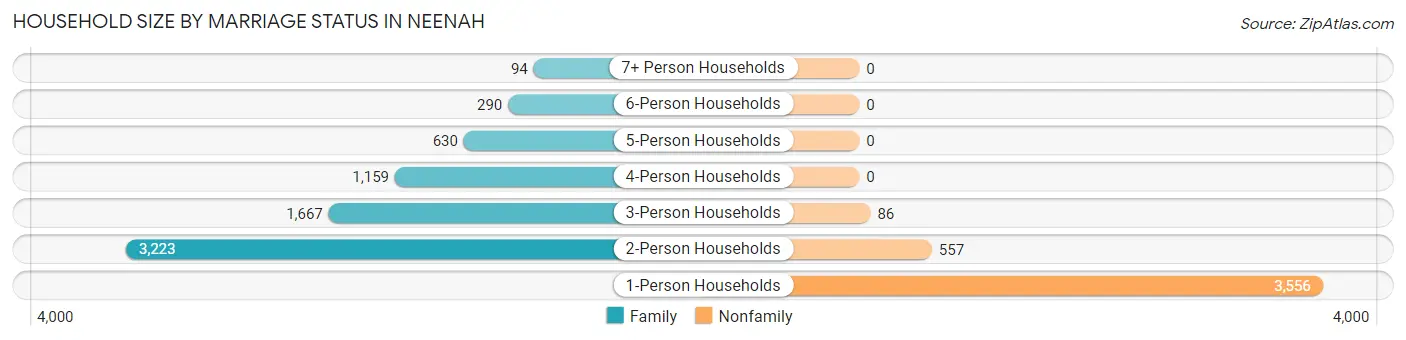
| Household Size | Family Households | Nonfamily Households |
| 1-Person Households | - | 3,556 (31.6%) |
| 2-Person Households | 3,223 (28.6%) | 557 (5.0%) |
| 3-Person Households | 1,667 (14.8%) | 86 (0.8%) |
| 4-Person Households | 1,159 (10.3%) | 0 (0.0%) |
| 5-Person Households | 630 (5.6%) | 0 (0.0%) |
| 6-Person Households | 290 (2.6%) | 0 (0.0%) |
| 7+ Person Households | 94 (0.8%) | 0 (0.0%) |
| Total | 7,063 (62.7%) | 4,199 (37.3%) |
Female Fertility in Neenah
Fertility by Age in Neenah
Average fertility rate in Neenah is 52.0 births per 1,000 women. Women in the age bracket of 20 to 34 years have the highest fertility rate with 105.0 births per 1,000 women. Women in the age bracket of 20 to 34 years acount for 79.2% of all women with births.
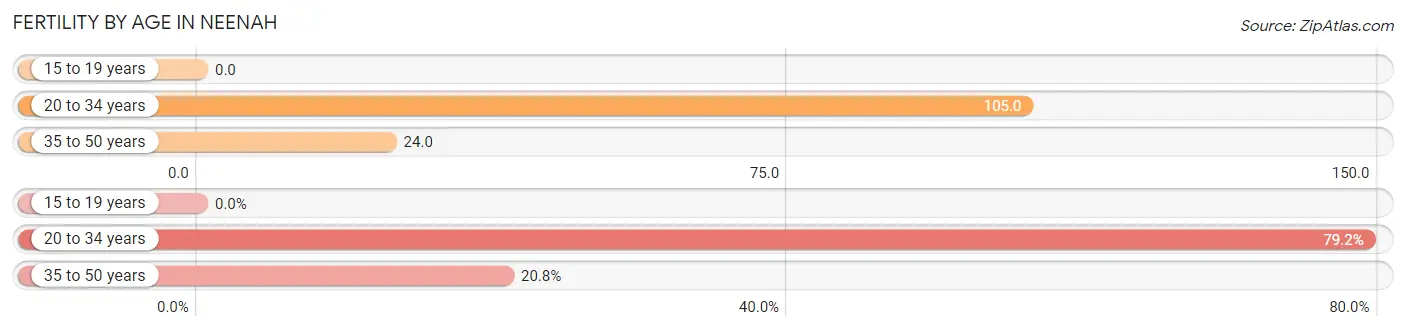
| Age Bracket | Women with Births | Births / 1,000 Women |
| 15 to 19 years | 0 (0.0%) | 0.0 |
| 20 to 34 years | 267 (79.2%) | 105.0 |
| 35 to 50 years | 70 (20.8%) | 24.0 |
| Total | 337 (100.0%) | 52.0 |
Fertility by Age by Marriage Status in Neenah
83.1% of women with births (337) in Neenah are married. The highest percentage of unmarried women with births falls into 20 to 34 years age bracket with 19.9% of them unmarried at the time of birth, while the lowest percentage of unmarried women with births belong to 35 to 50 years age bracket with 5.7% of them unmarried.
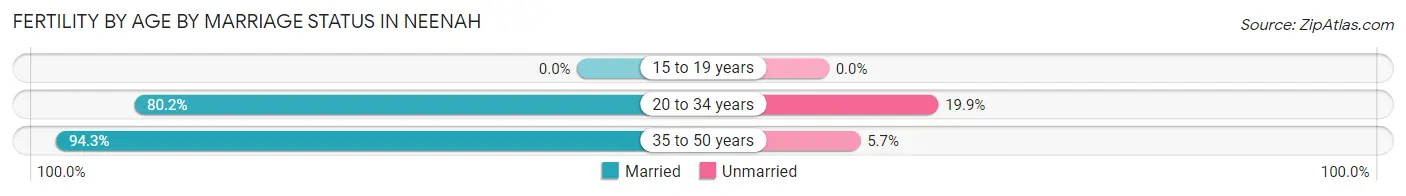
| Age Bracket | Married | Unmarried |
| 15 to 19 years | 0 (0.0%) | 0 (0.0%) |
| 20 to 34 years | 214 (80.1%) | 53 (19.9%) |
| 35 to 50 years | 66 (94.3%) | 4 (5.7%) |
| Total | 280 (83.1%) | 57 (16.9%) |
Fertility by Education in Neenah
Average fertility rate in Neenah is 52.0 births per 1,000 women. Women with the education attainment of bachelor's degree have the highest fertility rate of 78.0 births per 1,000 women, while women with the education attainment of less than high school have the lowest fertility at 5.0 births per 1,000 women. Women with the education attainment of college or associate's degree represent 41.8% of all women with births.
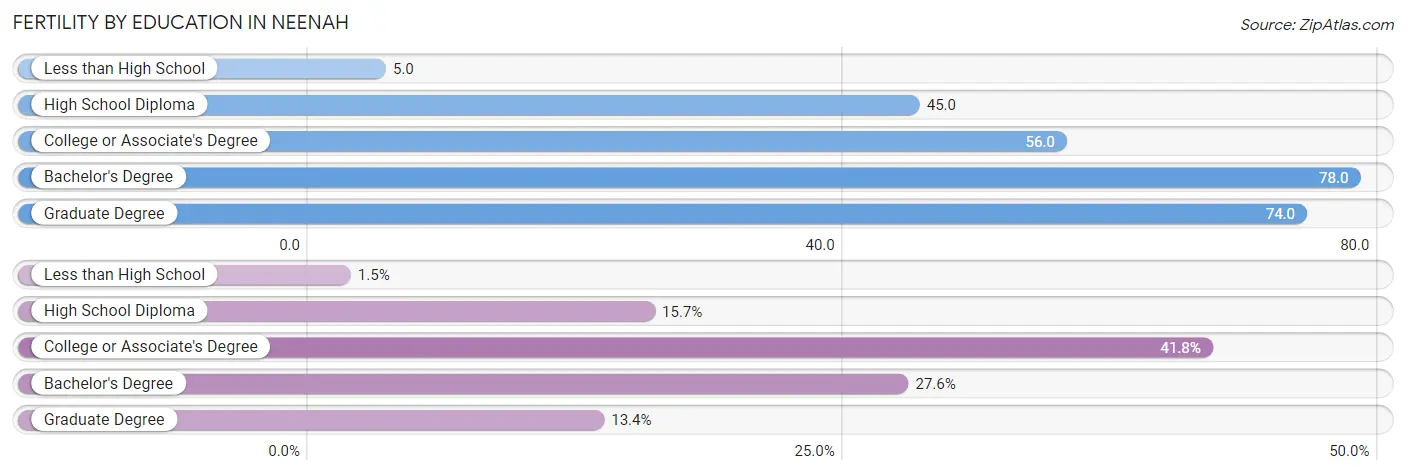
| Educational Attainment | Women with Births | Births / 1,000 Women |
| Less than High School | 5 (1.5%) | 5.0 |
| High School Diploma | 53 (15.7%) | 45.0 |
| College or Associate's Degree | 141 (41.8%) | 56.0 |
| Bachelor's Degree | 93 (27.6%) | 78.0 |
| Graduate Degree | 45 (13.4%) | 74.0 |
| Total | 337 (100.0%) | 52.0 |
Fertility by Education by Marriage Status in Neenah
16.9% of women with births in Neenah are unmarried. Women with the educational attainment of bachelor's degree are most likely to be married with 100.0% of them married at childbirth, while women with the educational attainment of less than high school are least likely to be married with 100.0% of them unmarried at childbirth.
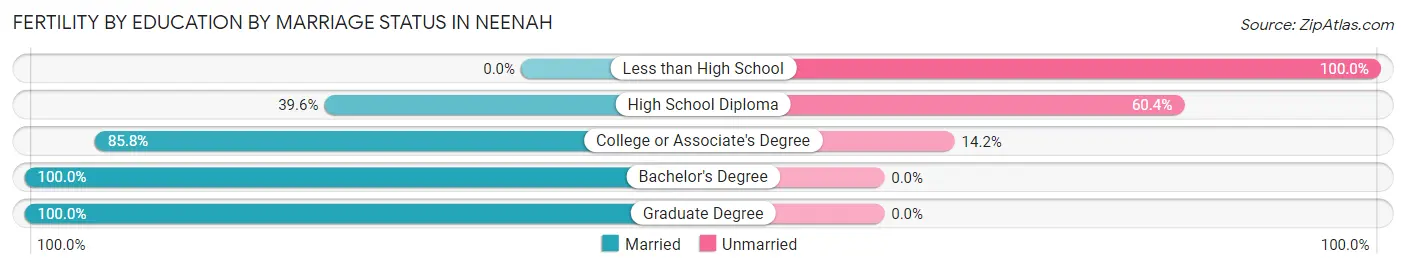
| Educational Attainment | Married | Unmarried |
| Less than High School | 0 (0.0%) | 5 (100.0%) |
| High School Diploma | 21 (39.6%) | 32 (60.4%) |
| College or Associate's Degree | 121 (85.8%) | 20 (14.2%) |
| Bachelor's Degree | 93 (100.0%) | 0 (0.0%) |
| Graduate Degree | 45 (100.0%) | 0 (0.0%) |
| Total | 280 (83.1%) | 57 (16.9%) |
Employment Characteristics in Neenah
Employment by Class of Employer in Neenah
Among the 14,151 employed individuals in Neenah, private company employees (11,032 | 78.0%), not-for-profit organizations (1,086 | 7.7%), and local government employees (891 | 6.3%) make up the most common classes of employment.
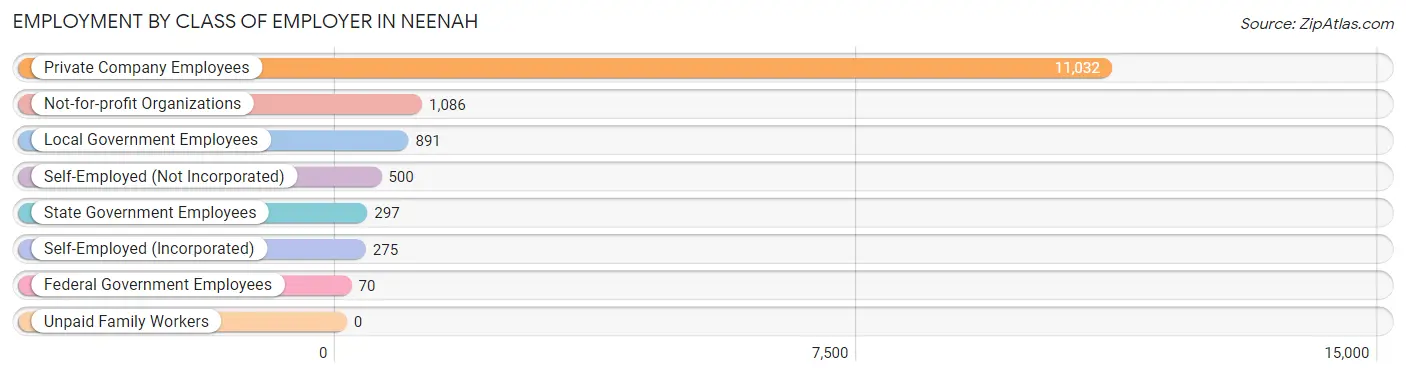
| Employer Class | # Employees | % Employees |
| Private Company Employees | 11,032 | 78.0% |
| Self-Employed (Incorporated) | 275 | 1.9% |
| Self-Employed (Not Incorporated) | 500 | 3.5% |
| Not-for-profit Organizations | 1,086 | 7.7% |
| Local Government Employees | 891 | 6.3% |
| State Government Employees | 297 | 2.1% |
| Federal Government Employees | 70 | 0.5% |
| Unpaid Family Workers | 0 | 0.0% |
| Total | 14,151 | 100.0% |
Employment Status by Age in Neenah
According to the labor force statistics for Neenah, out of the total population over 16 years of age (21,251), 69.5% or 14,769 individuals are in the labor force, with 2.7% or 399 of them unemployed. The age group with the highest labor force participation rate is 30 to 34 years, with 90.9% or 1,907 individuals in the labor force. Within the labor force, the 20 to 24 years age range has the highest percentage of unemployed individuals, with 5.7% or 73 of them being unemployed.
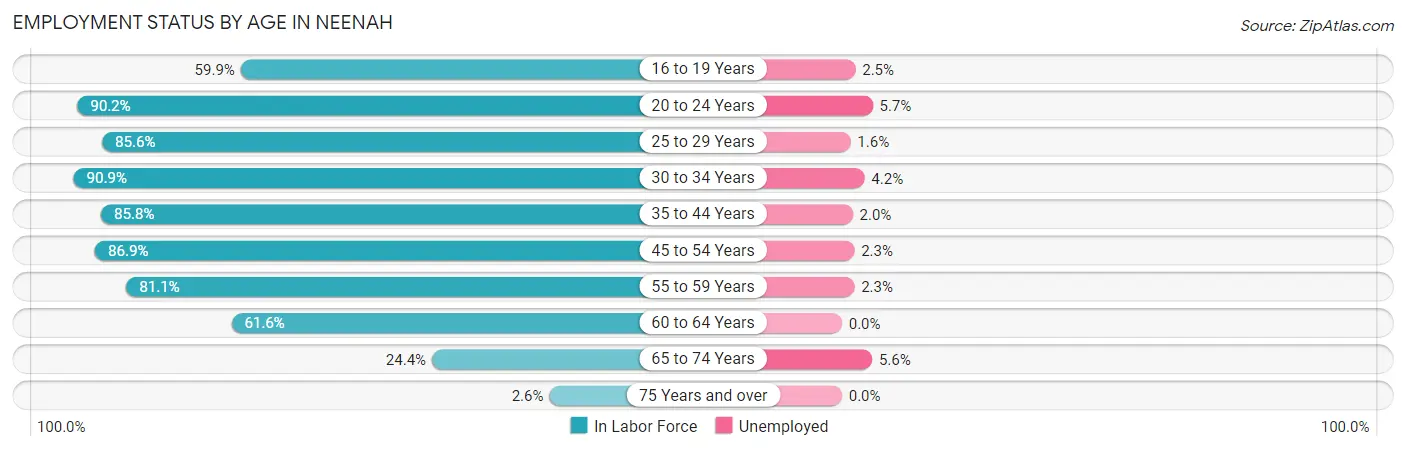
| Age Bracket | In Labor Force | Unemployed |
| 16 to 19 Years | 842 (59.9%) | 21 (2.5%) |
| 20 to 24 Years | 1,288 (90.2%) | 73 (5.7%) |
| 25 to 29 Years | 1,645 (85.6%) | 26 (1.6%) |
| 30 to 34 Years | 1,907 (90.9%) | 80 (4.2%) |
| 35 to 44 Years | 3,146 (85.8%) | 63 (2.0%) |
| 45 to 54 Years | 3,115 (86.9%) | 72 (2.3%) |
| 55 to 59 Years | 1,289 (81.1%) | 30 (2.3%) |
| 60 to 64 Years | 939 (61.6%) | 0 (0.0%) |
| 65 to 74 Years | 558 (24.4%) | 31 (5.6%) |
| 75 Years and over | 45 (2.6%) | 0 (0.0%) |
| Total | 14,769 (69.5%) | 399 (2.7%) |
Employment Status by Educational Attainment in Neenah
According to labor force statistics for Neenah, 83.7% of individuals (12,042) out of the total population between 25 and 64 years of age (14,387) are in the labor force, with 2.3% or 277 of them being unemployed. The group with the highest labor force participation rate are those with the educational attainment of bachelor's degree or higher, with 89.9% or 4,332 individuals in the labor force. Within the labor force, individuals with less than high school education have the highest percentage of unemployment, with 15.7% or 72 of them being unemployed.
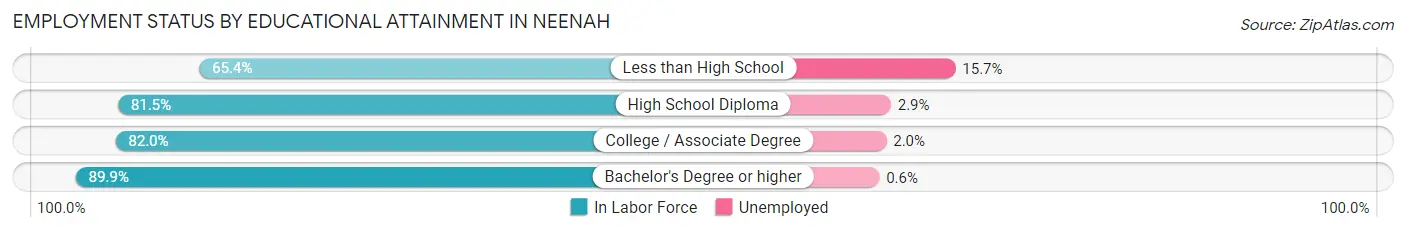
| Educational Attainment | In Labor Force | Unemployed |
| Less than High School | 459 (65.4%) | 110 (15.7%) |
| High School Diploma | 3,077 (81.5%) | 109 (2.9%) |
| College / Associate Degree | 4,175 (82.0%) | 102 (2.0%) |
| Bachelor's Degree or higher | 4,332 (89.9%) | 29 (0.6%) |
| Total | 12,042 (83.7%) | 331 (2.3%) |
Employment Occupations by Sex in Neenah
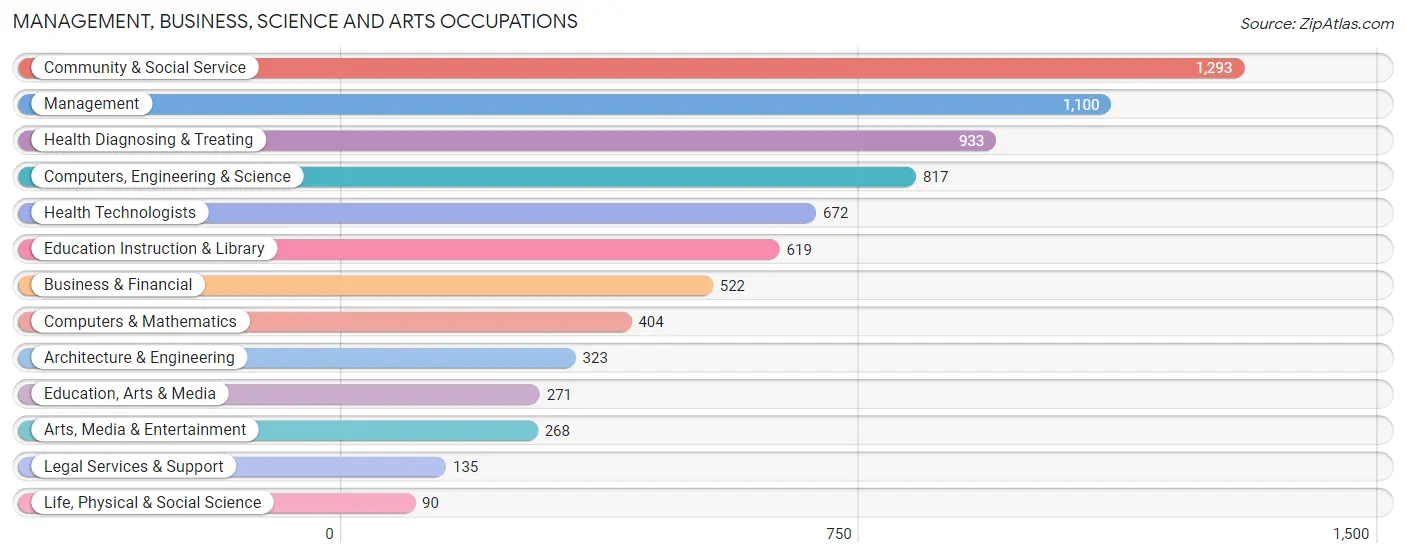
Management, Business, Science and Arts Occupations
The most common Management, Business, Science and Arts occupations in Neenah are Community & Social Service (1,293 | 9.0%), Management (1,100 | 7.6%), Health Diagnosing & Treating (933 | 6.5%), Computers, Engineering & Science (817 | 5.7%), and Health Technologists (672 | 4.7%).
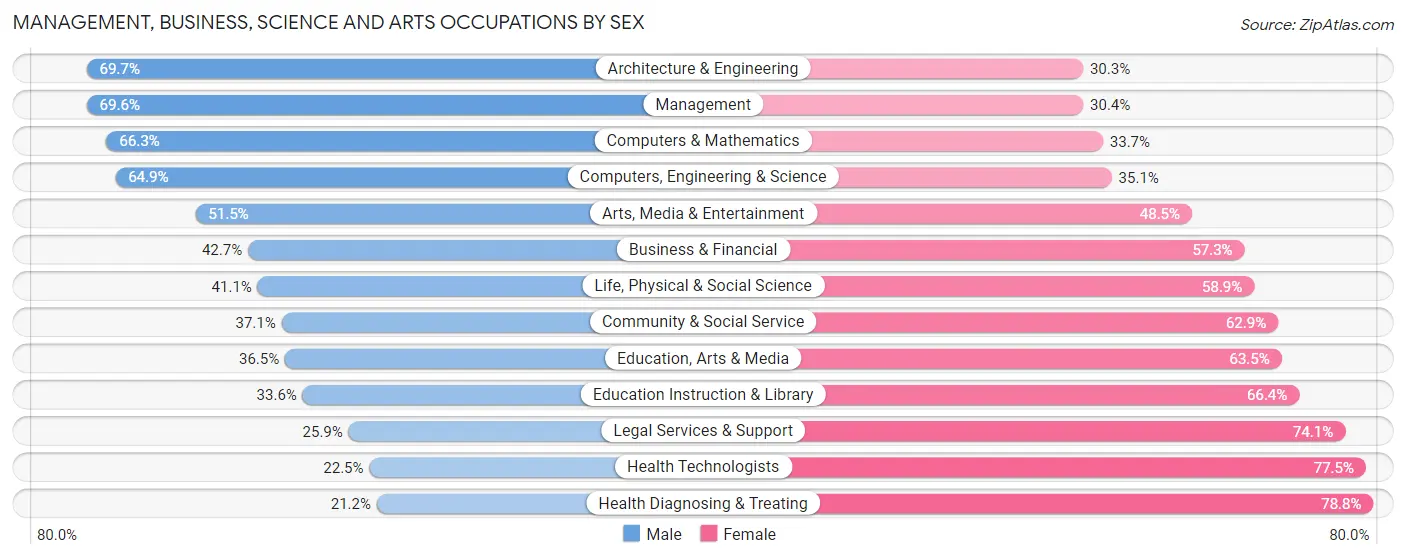
Management, Business, Science and Arts Occupations by Sex
Within the Management, Business, Science and Arts occupations in Neenah, the most male-oriented occupations are Architecture & Engineering (69.7%), Management (69.6%), and Computers & Mathematics (66.3%), while the most female-oriented occupations are Health Diagnosing & Treating (78.8%), Health Technologists (77.5%), and Legal Services & Support (74.1%).
| Occupation | Male | Female |
| Management | 766 (69.6%) | 334 (30.4%) |
| Business & Financial | 223 (42.7%) | 299 (57.3%) |
| Computers, Engineering & Science | 530 (64.9%) | 287 (35.1%) |
| Computers & Mathematics | 268 (66.3%) | 136 (33.7%) |
| Architecture & Engineering | 225 (69.7%) | 98 (30.3%) |
| Life, Physical & Social Science | 37 (41.1%) | 53 (58.9%) |
| Community & Social Service | 480 (37.1%) | 813 (62.9%) |
| Education, Arts & Media | 99 (36.5%) | 172 (63.5%) |
| Legal Services & Support | 35 (25.9%) | 100 (74.1%) |
| Education Instruction & Library | 208 (33.6%) | 411 (66.4%) |
| Arts, Media & Entertainment | 138 (51.5%) | 130 (48.5%) |
| Health Diagnosing & Treating | 198 (21.2%) | 735 (78.8%) |
| Health Technologists | 151 (22.5%) | 521 (77.5%) |
| Total (Category) | 2,197 (47.1%) | 2,468 (52.9%) |
| Total (Overall) | 8,016 (55.7%) | 6,362 (44.3%) |
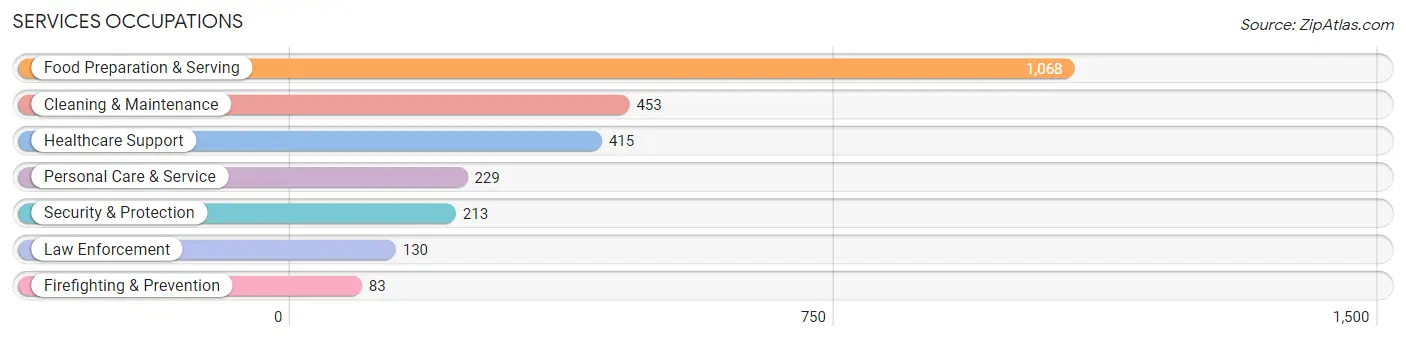
Services Occupations
The most common Services occupations in Neenah are Food Preparation & Serving (1,068 | 7.4%), Cleaning & Maintenance (453 | 3.2%), Healthcare Support (415 | 2.9%), Personal Care & Service (229 | 1.6%), and Security & Protection (213 | 1.5%).
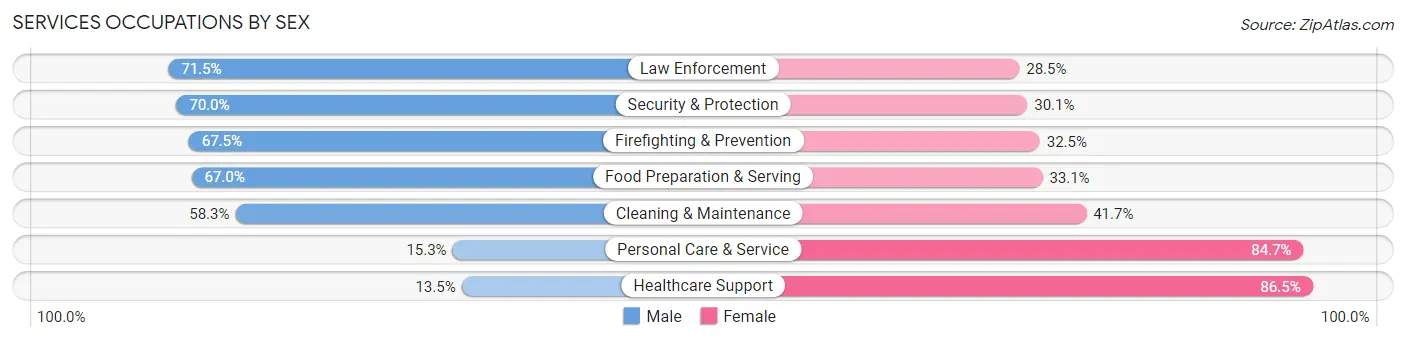
Services Occupations by Sex
Within the Services occupations in Neenah, the most male-oriented occupations are Law Enforcement (71.5%), Security & Protection (70.0%), and Firefighting & Prevention (67.5%), while the most female-oriented occupations are Healthcare Support (86.5%), Personal Care & Service (84.7%), and Cleaning & Maintenance (41.7%).
| Occupation | Male | Female |
| Healthcare Support | 56 (13.5%) | 359 (86.5%) |
| Security & Protection | 149 (70.0%) | 64 (30.0%) |
| Firefighting & Prevention | 56 (67.5%) | 27 (32.5%) |
| Law Enforcement | 93 (71.5%) | 37 (28.5%) |
| Food Preparation & Serving | 715 (66.9%) | 353 (33.1%) |
| Cleaning & Maintenance | 264 (58.3%) | 189 (41.7%) |
| Personal Care & Service | 35 (15.3%) | 194 (84.7%) |
| Total (Category) | 1,219 (51.3%) | 1,159 (48.7%) |
| Total (Overall) | 8,016 (55.7%) | 6,362 (44.3%) |
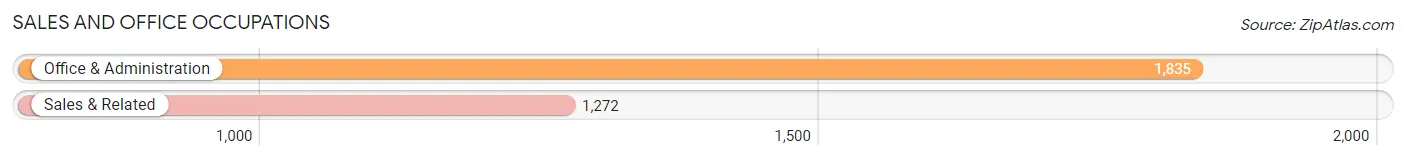
Sales and Office Occupations
The most common Sales and Office occupations in Neenah are Office & Administration (1,835 | 12.8%), and Sales & Related (1,272 | 8.8%).
Sales and Office Occupations by Sex
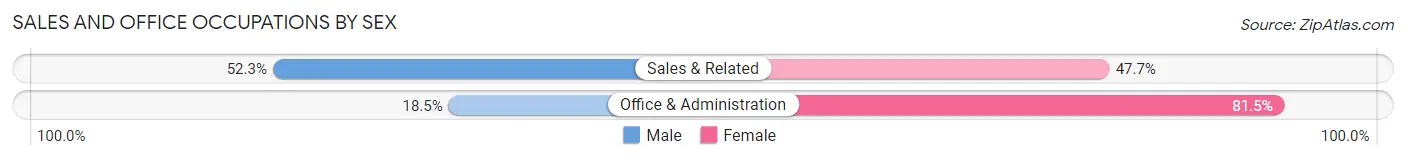
| Occupation | Male | Female |
| Sales & Related | 665 (52.3%) | 607 (47.7%) |
| Office & Administration | 339 (18.5%) | 1,496 (81.5%) |
| Total (Category) | 1,004 (32.3%) | 2,103 (67.7%) |
| Total (Overall) | 8,016 (55.7%) | 6,362 (44.3%) |
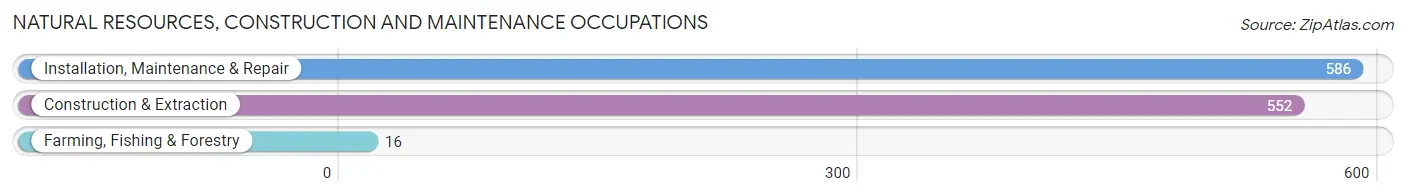
Natural Resources, Construction and Maintenance Occupations
The most common Natural Resources, Construction and Maintenance occupations in Neenah are Installation, Maintenance & Repair (586 | 4.1%), Construction & Extraction (552 | 3.8%), and Farming, Fishing & Forestry (16 | 0.1%).
Natural Resources, Construction and Maintenance Occupations by Sex
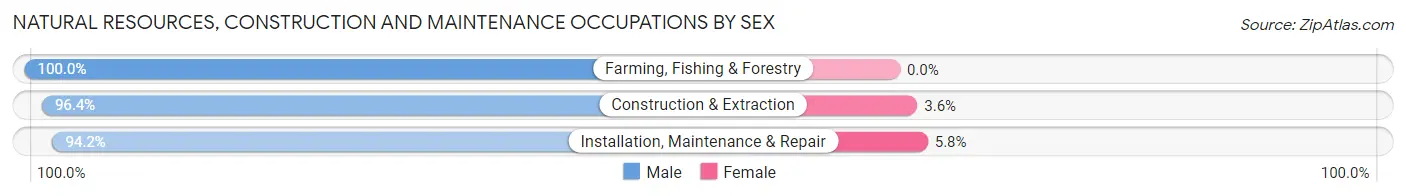
| Occupation | Male | Female |
| Farming, Fishing & Forestry | 16 (100.0%) | 0 (0.0%) |
| Construction & Extraction | 532 (96.4%) | 20 (3.6%) |
| Installation, Maintenance & Repair | 552 (94.2%) | 34 (5.8%) |
| Total (Category) | 1,100 (95.3%) | 54 (4.7%) |
| Total (Overall) | 8,016 (55.7%) | 6,362 (44.3%) |
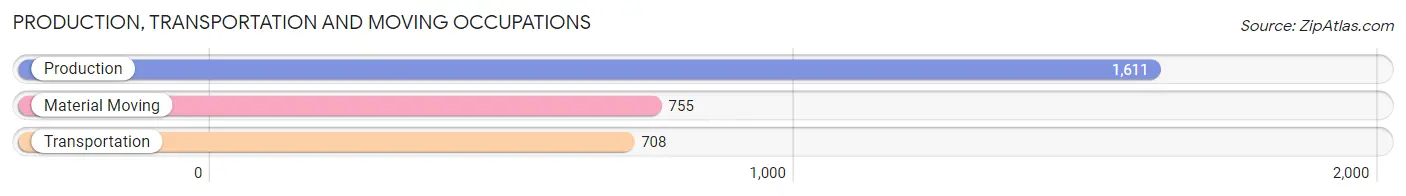
Production, Transportation and Moving Occupations
The most common Production, Transportation and Moving occupations in Neenah are Production (1,611 | 11.2%), Material Moving (755 | 5.2%), and Transportation (708 | 4.9%).
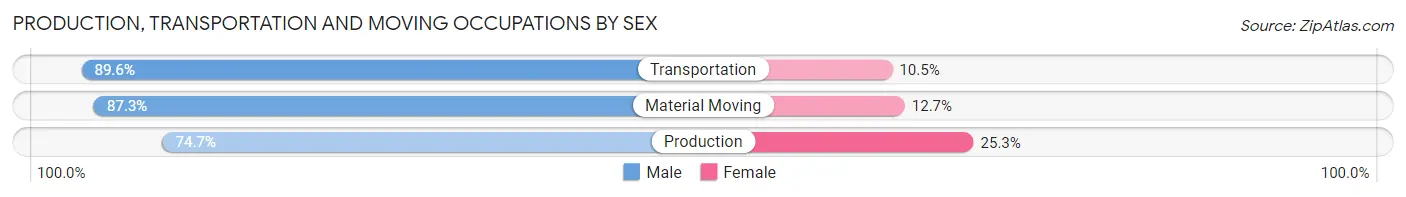
Production, Transportation and Moving Occupations by Sex
| Occupation | Male | Female |
| Production | 1,203 (74.7%) | 408 (25.3%) |
| Transportation | 634 (89.5%) | 74 (10.4%) |
| Material Moving | 659 (87.3%) | 96 (12.7%) |
| Total (Category) | 2,496 (81.2%) | 578 (18.8%) |
| Total (Overall) | 8,016 (55.7%) | 6,362 (44.3%) |
Employment Industries by Sex in Neenah
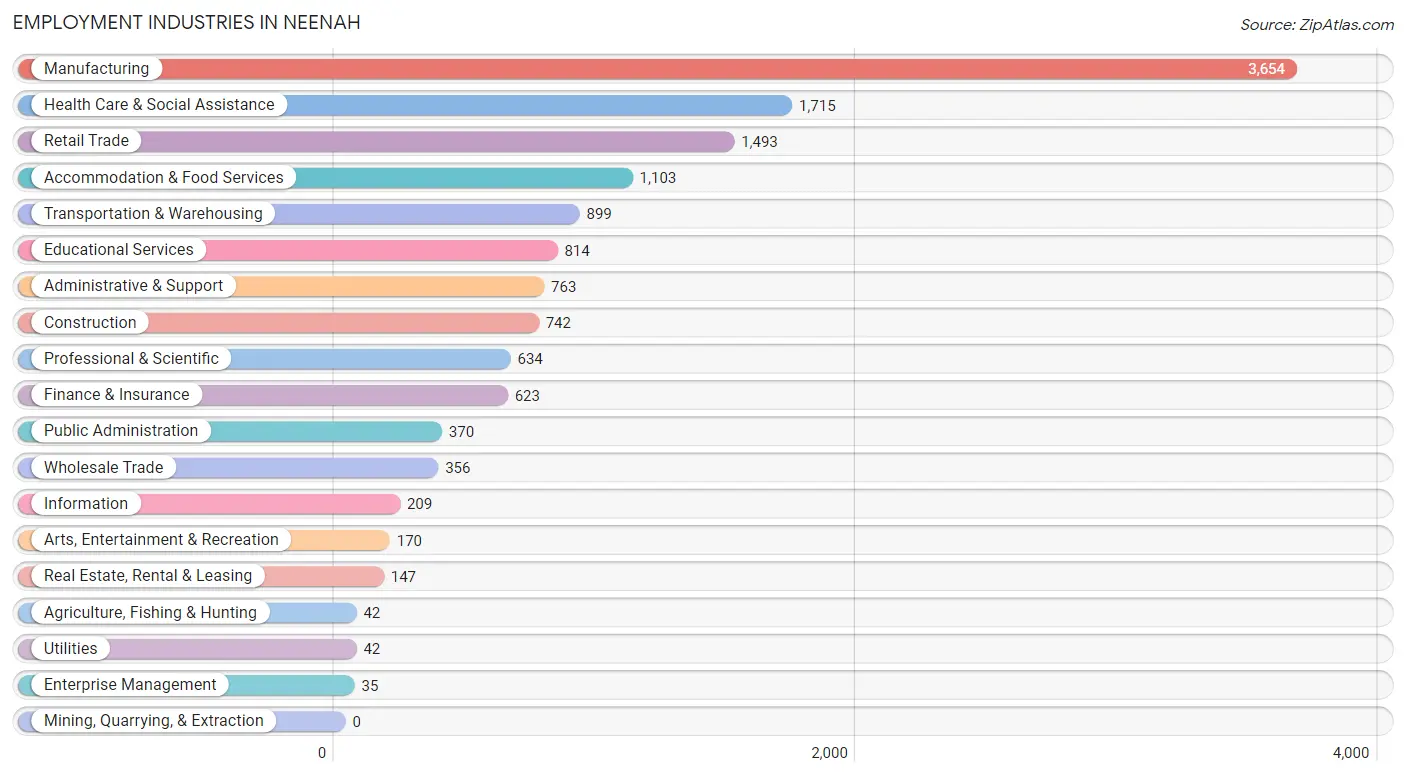
Employment Industries in Neenah
The major employment industries in Neenah include Manufacturing (3,654 | 25.4%), Health Care & Social Assistance (1,715 | 11.9%), Retail Trade (1,493 | 10.4%), Accommodation & Food Services (1,103 | 7.7%), and Transportation & Warehousing (899 | 6.2%).
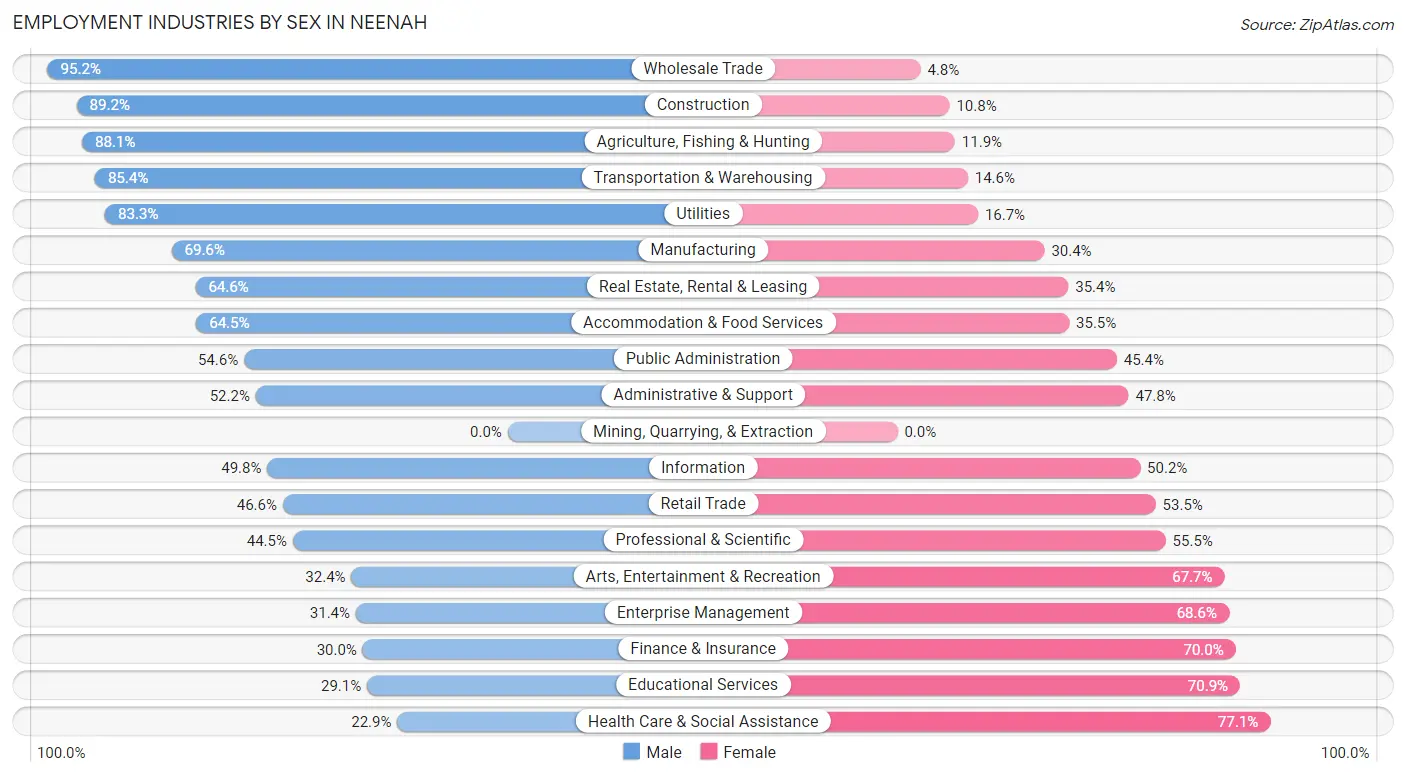
Employment Industries by Sex in Neenah
The Neenah industries that see more men than women are Wholesale Trade (95.2%), Construction (89.2%), and Agriculture, Fishing & Hunting (88.1%), whereas the industries that tend to have a higher number of women are Health Care & Social Assistance (77.1%), Educational Services (70.9%), and Finance & Insurance (70.0%).
| Industry | Male | Female |
| Agriculture, Fishing & Hunting | 37 (88.1%) | 5 (11.9%) |
| Mining, Quarrying, & Extraction | 0 (0.0%) | 0 (0.0%) |
| Construction | 662 (89.2%) | 80 (10.8%) |
| Manufacturing | 2,542 (69.6%) | 1,112 (30.4%) |
| Wholesale Trade | 339 (95.2%) | 17 (4.8%) |
| Retail Trade | 695 (46.6%) | 798 (53.4%) |
| Transportation & Warehousing | 768 (85.4%) | 131 (14.6%) |
| Utilities | 35 (83.3%) | 7 (16.7%) |
| Information | 104 (49.8%) | 105 (50.2%) |
| Finance & Insurance | 187 (30.0%) | 436 (70.0%) |
| Real Estate, Rental & Leasing | 95 (64.6%) | 52 (35.4%) |
| Professional & Scientific | 282 (44.5%) | 352 (55.5%) |
| Enterprise Management | 11 (31.4%) | 24 (68.6%) |
| Administrative & Support | 398 (52.2%) | 365 (47.8%) |
| Educational Services | 237 (29.1%) | 577 (70.9%) |
| Health Care & Social Assistance | 392 (22.9%) | 1,323 (77.1%) |
| Arts, Entertainment & Recreation | 55 (32.4%) | 115 (67.6%) |
| Accommodation & Food Services | 711 (64.5%) | 392 (35.5%) |
| Public Administration | 202 (54.6%) | 168 (45.4%) |
| Total | 8,016 (55.7%) | 6,362 (44.3%) |
Education in Neenah
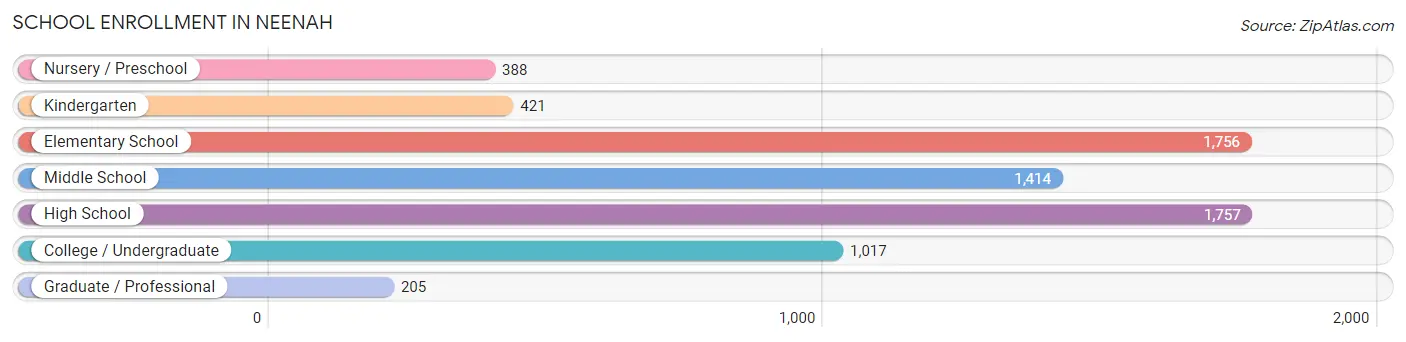
School Enrollment in Neenah
The most common levels of schooling among the 6,958 students in Neenah are high school (1,757 | 25.3%), elementary school (1,756 | 25.2%), and middle school (1,414 | 20.3%).
| School Level | # Students | % Students |
| Nursery / Preschool | 388 | 5.6% |
| Kindergarten | 421 | 6.0% |
| Elementary School | 1,756 | 25.2% |
| Middle School | 1,414 | 20.3% |
| High School | 1,757 | 25.3% |
| College / Undergraduate | 1,017 | 14.6% |
| Graduate / Professional | 205 | 2.9% |
| Total | 6,958 | 100.0% |
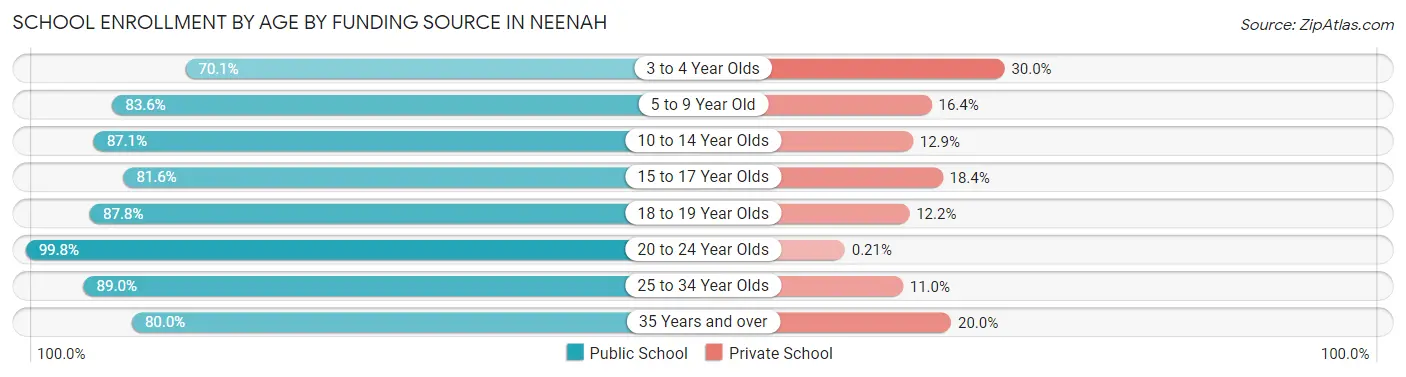
School Enrollment by Age by Funding Source in Neenah
Out of a total of 6,958 students who are enrolled in schools in Neenah, 1,023 (14.7%) attend a private institution, while the remaining 5,935 (85.3%) are enrolled in public schools. The age group of 3 to 4 year olds has the highest likelihood of being enrolled in private schools, with 62 (29.9% in the age bracket) enrolled. Conversely, the age group of 20 to 24 year olds has the lowest likelihood of being enrolled in a private school, with 481 (99.8% in the age bracket) attending a public institution.
| Age Bracket | Public School | Private School |
| 3 to 4 Year Olds | 145 (70.1%) | 62 (29.9%) |
| 5 to 9 Year Old | 1,708 (83.6%) | 334 (16.4%) |
| 10 to 14 Year Olds | 1,616 (87.1%) | 239 (12.9%) |
| 15 to 17 Year Olds | 1,076 (81.6%) | 243 (18.4%) |
| 18 to 19 Year Olds | 410 (87.8%) | 57 (12.2%) |
| 20 to 24 Year Olds | 481 (99.8%) | 1 (0.2%) |
| 25 to 34 Year Olds | 299 (89.0%) | 37 (11.0%) |
| 35 Years and over | 200 (80.0%) | 50 (20.0%) |
| Total | 5,935 (85.3%) | 1,023 (14.7%) |
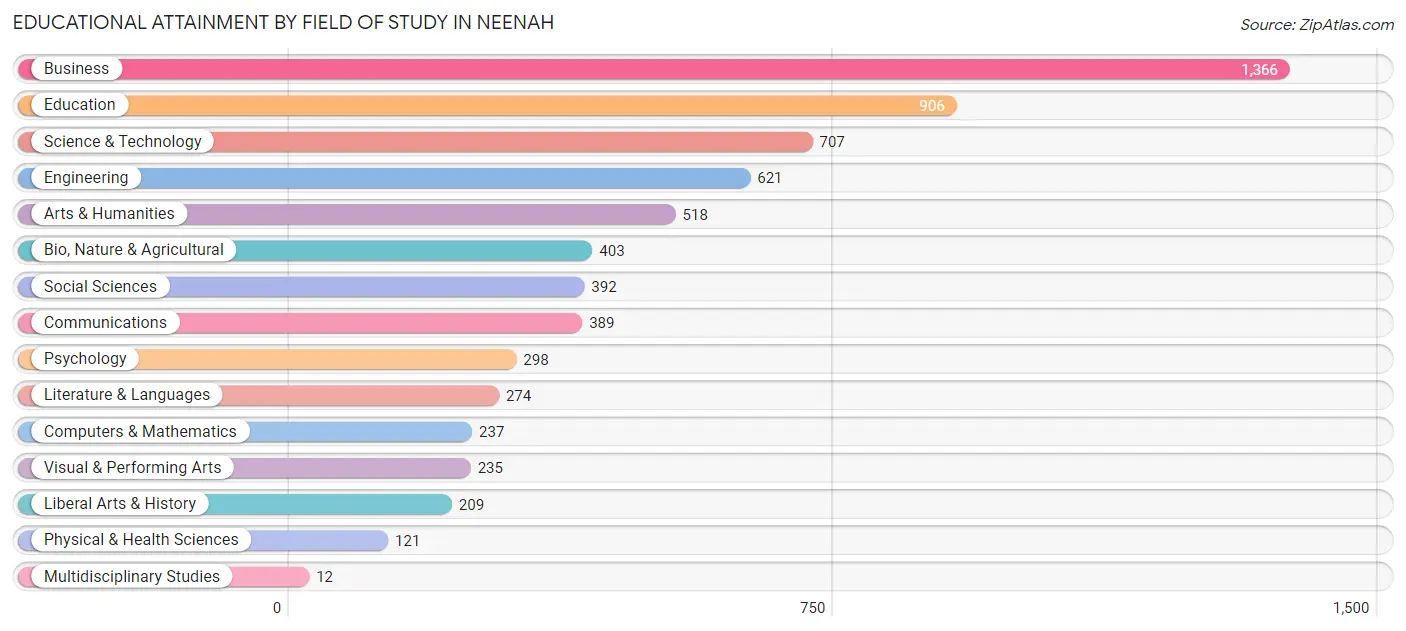
Educational Attainment by Field of Study in Neenah
Business (1,366 | 20.4%), education (906 | 13.6%), science & technology (707 | 10.6%), engineering (621 | 9.3%), and arts & humanities (518 | 7.7%) are the most common fields of study among 6,688 individuals in Neenah who have obtained a bachelor's degree or higher.
| Field of Study | # Graduates | % Graduates |
| Computers & Mathematics | 237 | 3.5% |
| Bio, Nature & Agricultural | 403 | 6.0% |
| Physical & Health Sciences | 121 | 1.8% |
| Psychology | 298 | 4.5% |
| Social Sciences | 392 | 5.9% |
| Engineering | 621 | 9.3% |
| Multidisciplinary Studies | 12 | 0.2% |
| Science & Technology | 707 | 10.6% |
| Business | 1,366 | 20.4% |
| Education | 906 | 13.6% |
| Literature & Languages | 274 | 4.1% |
| Liberal Arts & History | 209 | 3.1% |
| Visual & Performing Arts | 235 | 3.5% |
| Communications | 389 | 5.8% |
| Arts & Humanities | 518 | 7.7% |
| Total | 6,688 | 100.0% |
Transportation & Commute in Neenah
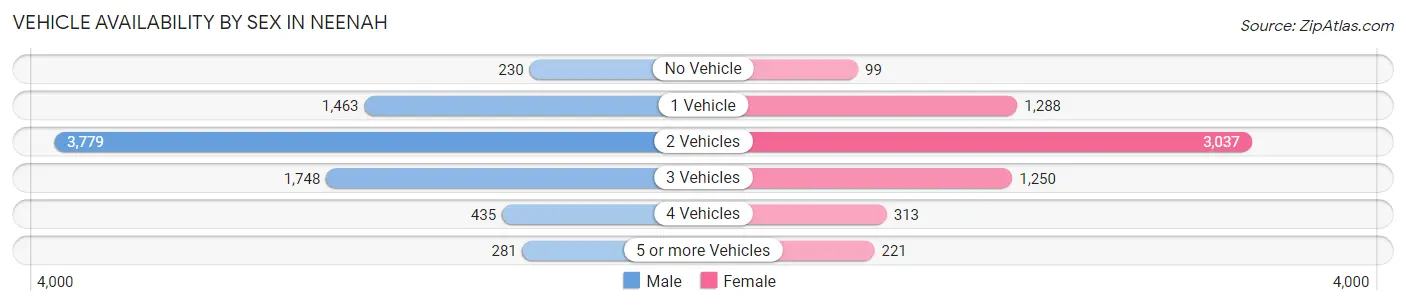
Vehicle Availability by Sex in Neenah
The most prevalent vehicle ownership categories in Neenah are males with 2 vehicles (3,779, accounting for 47.6%) and females with 2 vehicles (3,037, making up 60.9%).
| Vehicles Available | Male | Female |
| No Vehicle | 230 (2.9%) | 99 (1.6%) |
| 1 Vehicle | 1,463 (18.4%) | 1,288 (20.7%) |
| 2 Vehicles | 3,779 (47.6%) | 3,037 (48.9%) |
| 3 Vehicles | 1,748 (22.0%) | 1,250 (20.1%) |
| 4 Vehicles | 435 (5.5%) | 313 (5.0%) |
| 5 or more Vehicles | 281 (3.5%) | 221 (3.6%) |
| Total | 7,936 (100.0%) | 6,208 (100.0%) |
Commute Time in Neenah
The most frequently occuring commute durations in Neenah are 10 to 14 minutes (2,883 commuters, 22.3%), 15 to 19 minutes (2,612 commuters, 20.2%), and 5 to 9 minutes (2,416 commuters, 18.7%).
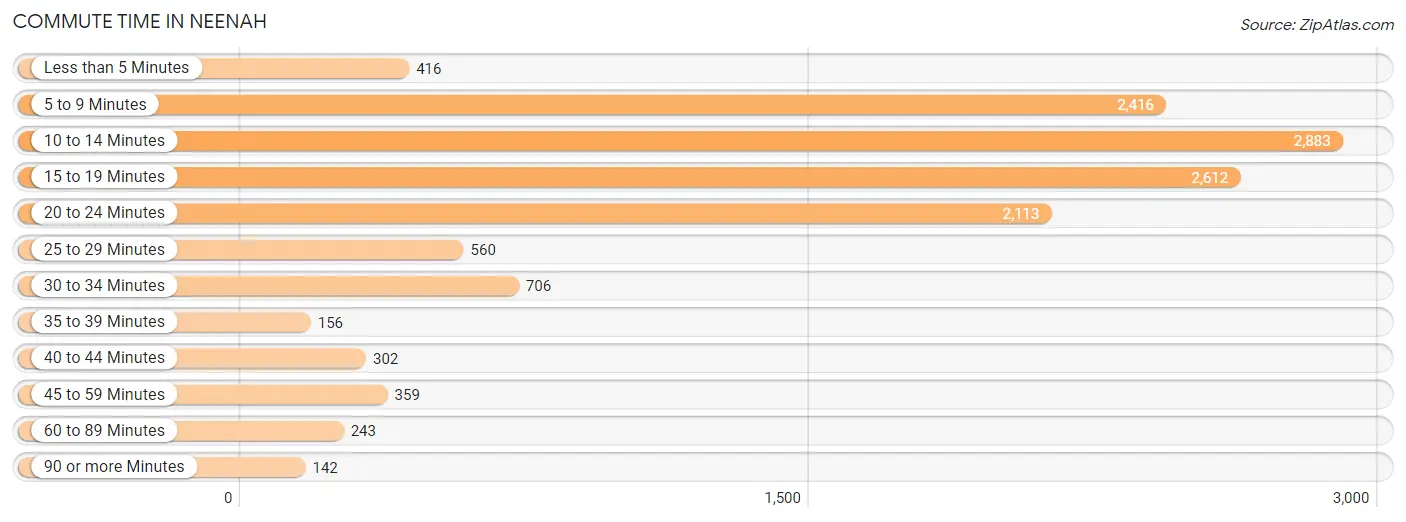
| Commute Time | # Commuters | % Commuters |
| Less than 5 Minutes | 416 | 3.2% |
| 5 to 9 Minutes | 2,416 | 18.7% |
| 10 to 14 Minutes | 2,883 | 22.3% |
| 15 to 19 Minutes | 2,612 | 20.2% |
| 20 to 24 Minutes | 2,113 | 16.4% |
| 25 to 29 Minutes | 560 | 4.3% |
| 30 to 34 Minutes | 706 | 5.5% |
| 35 to 39 Minutes | 156 | 1.2% |
| 40 to 44 Minutes | 302 | 2.3% |
| 45 to 59 Minutes | 359 | 2.8% |
| 60 to 89 Minutes | 243 | 1.9% |
| 90 or more Minutes | 142 | 1.1% |
Commute Time by Sex in Neenah
The most common commute times in Neenah are 10 to 14 minutes (1,795 commuters, 24.6%) for males and 15 to 19 minutes (1,174 commuters, 21.0%) for females.
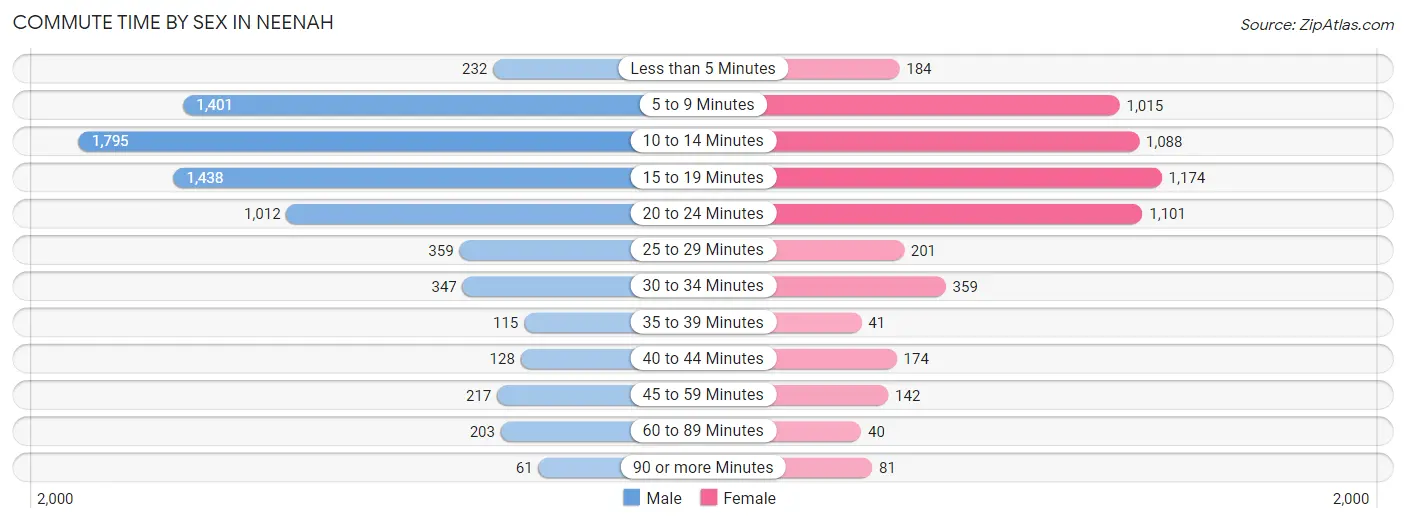
| Commute Time | Male | Female |
| Less than 5 Minutes | 232 (3.2%) | 184 (3.3%) |
| 5 to 9 Minutes | 1,401 (19.2%) | 1,015 (18.1%) |
| 10 to 14 Minutes | 1,795 (24.6%) | 1,088 (19.4%) |
| 15 to 19 Minutes | 1,438 (19.7%) | 1,174 (21.0%) |
| 20 to 24 Minutes | 1,012 (13.9%) | 1,101 (19.7%) |
| 25 to 29 Minutes | 359 (4.9%) | 201 (3.6%) |
| 30 to 34 Minutes | 347 (4.8%) | 359 (6.4%) |
| 35 to 39 Minutes | 115 (1.6%) | 41 (0.7%) |
| 40 to 44 Minutes | 128 (1.8%) | 174 (3.1%) |
| 45 to 59 Minutes | 217 (3.0%) | 142 (2.5%) |
| 60 to 89 Minutes | 203 (2.8%) | 40 (0.7%) |
| 90 or more Minutes | 61 (0.8%) | 81 (1.5%) |
Time of Departure to Work by Sex in Neenah
The most frequent times of departure to work in Neenah are 12:00 PM to 3:59 PM (1,145, 15.7%) for males and 7:00 AM to 7:29 AM (1,055, 18.8%) for females.
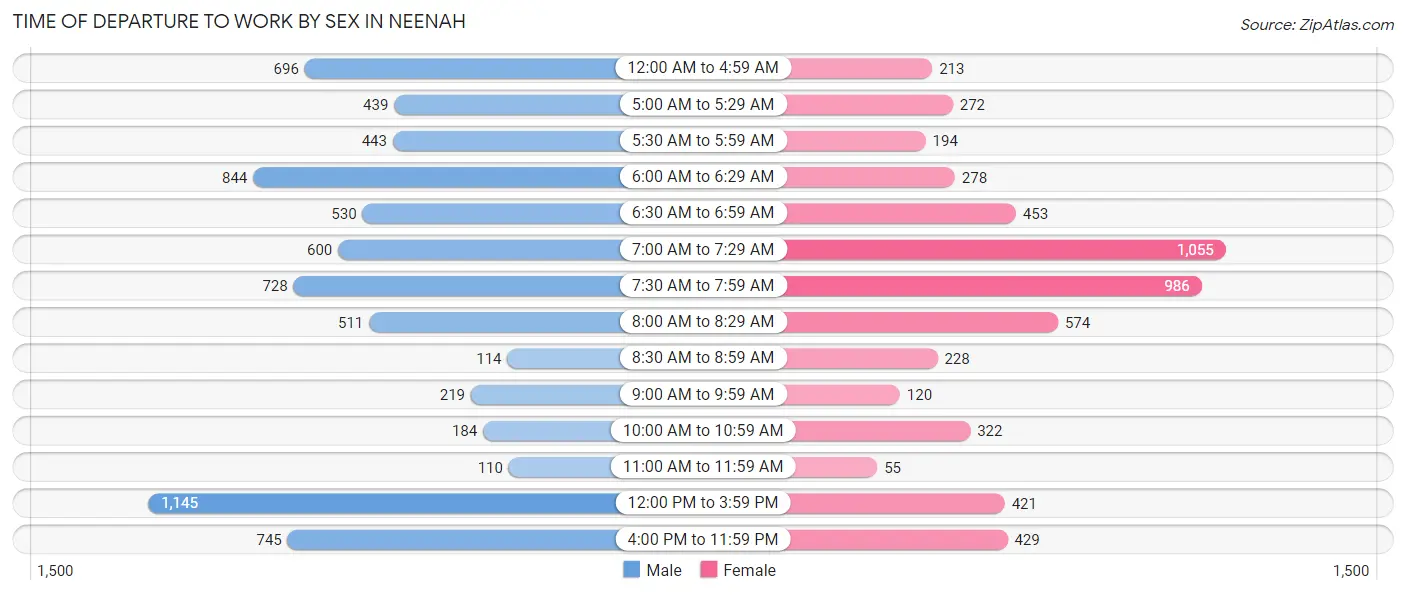
| Time of Departure | Male | Female |
| 12:00 AM to 4:59 AM | 696 (9.5%) | 213 (3.8%) |
| 5:00 AM to 5:29 AM | 439 (6.0%) | 272 (4.9%) |
| 5:30 AM to 5:59 AM | 443 (6.1%) | 194 (3.5%) |
| 6:00 AM to 6:29 AM | 844 (11.6%) | 278 (5.0%) |
| 6:30 AM to 6:59 AM | 530 (7.2%) | 453 (8.1%) |
| 7:00 AM to 7:29 AM | 600 (8.2%) | 1,055 (18.8%) |
| 7:30 AM to 7:59 AM | 728 (10.0%) | 986 (17.6%) |
| 8:00 AM to 8:29 AM | 511 (7.0%) | 574 (10.2%) |
| 8:30 AM to 8:59 AM | 114 (1.6%) | 228 (4.1%) |
| 9:00 AM to 9:59 AM | 219 (3.0%) | 120 (2.1%) |
| 10:00 AM to 10:59 AM | 184 (2.5%) | 322 (5.8%) |
| 11:00 AM to 11:59 AM | 110 (1.5%) | 55 (1.0%) |
| 12:00 PM to 3:59 PM | 1,145 (15.7%) | 421 (7.5%) |
| 4:00 PM to 11:59 PM | 745 (10.2%) | 429 (7.7%) |
| Total | 7,308 (100.0%) | 5,600 (100.0%) |
Housing Occupancy in Neenah
Occupancy by Ownership in Neenah
Of the total 11,262 dwellings in Neenah, owner-occupied units account for 7,306 (64.9%), while renter-occupied units make up 3,956 (35.1%).
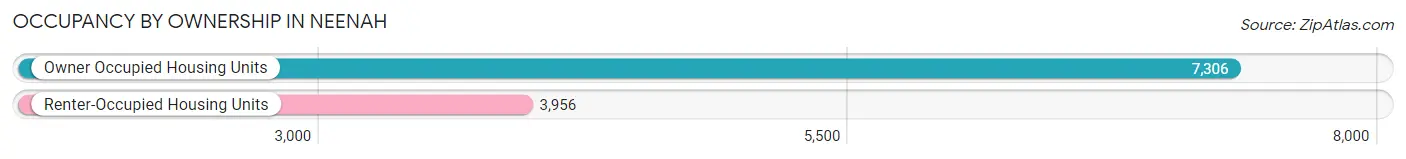
| Occupancy | # Housing Units | % Housing Units |
| Owner Occupied Housing Units | 7,306 | 64.9% |
| Renter-Occupied Housing Units | 3,956 | 35.1% |
| Total Occupied Housing Units | 11,262 | 100.0% |
Occupancy by Household Size in Neenah
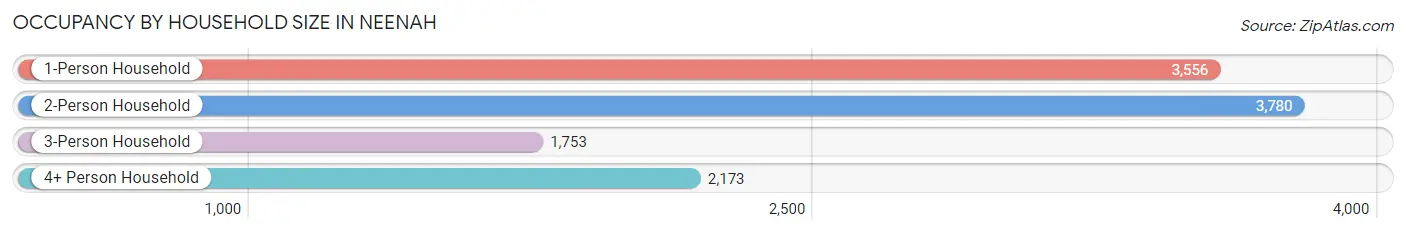
| Household Size | # Housing Units | % Housing Units |
| 1-Person Household | 3,556 | 31.6% |
| 2-Person Household | 3,780 | 33.6% |
| 3-Person Household | 1,753 | 15.6% |
| 4+ Person Household | 2,173 | 19.3% |
| Total Housing Units | 11,262 | 100.0% |
Occupancy by Ownership by Household Size in Neenah
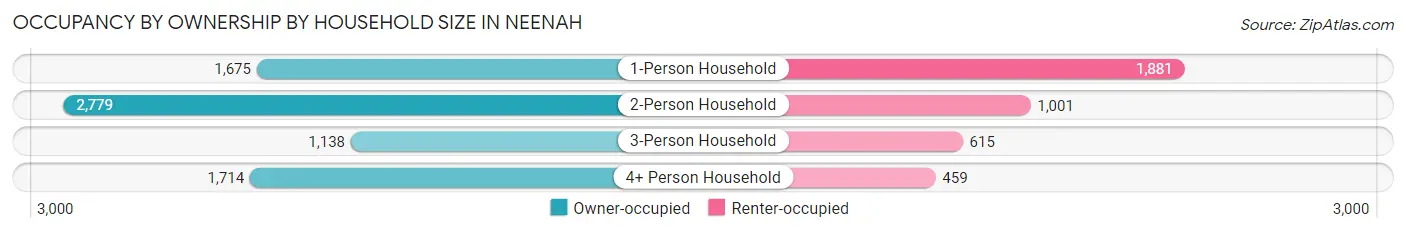
| Household Size | Owner-occupied | Renter-occupied |
| 1-Person Household | 1,675 (47.1%) | 1,881 (52.9%) |
| 2-Person Household | 2,779 (73.5%) | 1,001 (26.5%) |
| 3-Person Household | 1,138 (64.9%) | 615 (35.1%) |
| 4+ Person Household | 1,714 (78.9%) | 459 (21.1%) |
| Total Housing Units | 7,306 (64.9%) | 3,956 (35.1%) |
Occupancy by Educational Attainment in Neenah
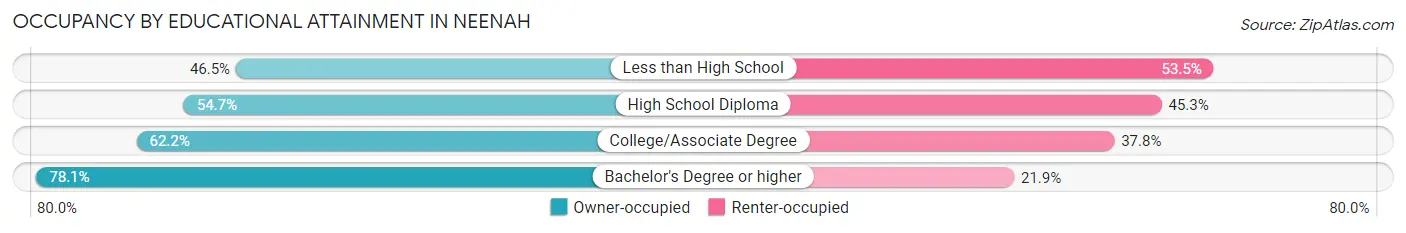
| Household Size | Owner-occupied | Renter-occupied |
| Less than High School | 211 (46.5%) | 243 (53.5%) |
| High School Diploma | 1,640 (54.7%) | 1,356 (45.3%) |
| College/Associate Degree | 2,540 (62.2%) | 1,541 (37.8%) |
| Bachelor's Degree or higher | 2,915 (78.1%) | 816 (21.9%) |
Occupancy by Age of Householder in Neenah
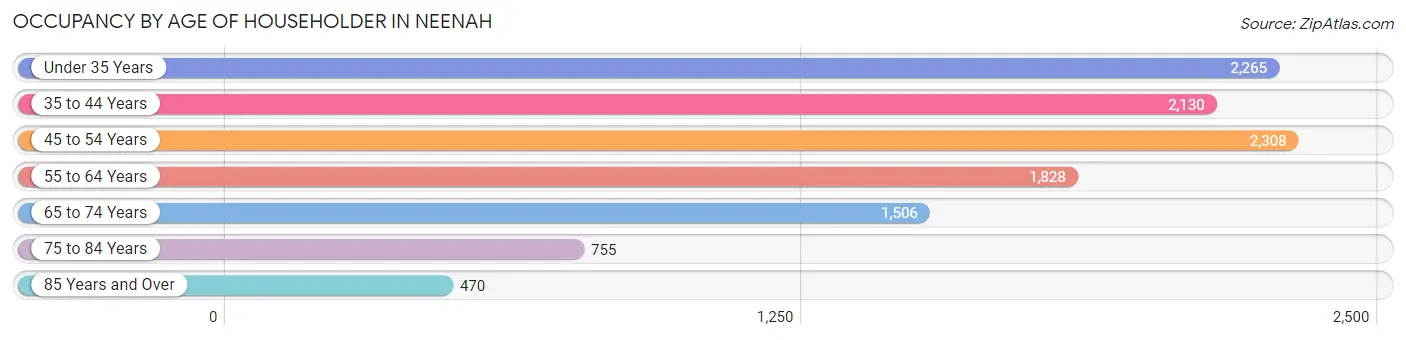
| Age Bracket | # Households | % Households |
| Under 35 Years | 2,265 | 20.1% |
| 35 to 44 Years | 2,130 | 18.9% |
| 45 to 54 Years | 2,308 | 20.5% |
| 55 to 64 Years | 1,828 | 16.2% |
| 65 to 74 Years | 1,506 | 13.4% |
| 75 to 84 Years | 755 | 6.7% |
| 85 Years and Over | 470 | 4.2% |
| Total | 11,262 | 100.0% |
Housing Finances in Neenah
Median Income by Occupancy in Neenah
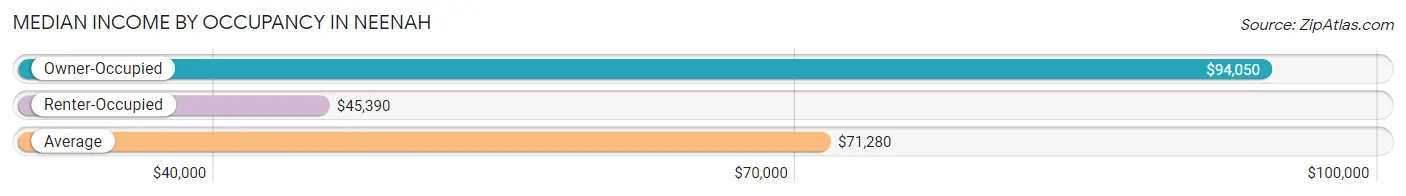
| Occupancy Type | # Households | Median Income |
| Owner-Occupied | 7,306 (64.9%) | $94,050 |
| Renter-Occupied | 3,956 (35.1%) | $45,390 |
| Average | 11,262 (100.0%) | $71,280 |
Occupancy by Householder Income Bracket in Neenah
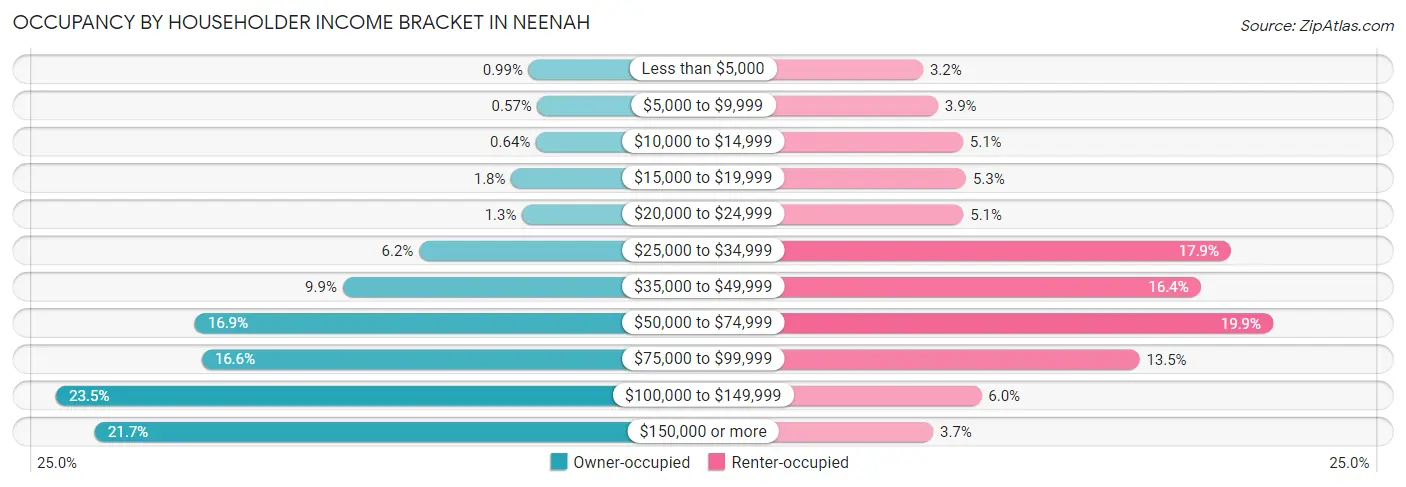
| Income Bracket | Owner-occupied | Renter-occupied |
| Less than $5,000 | 72 (1.0%) | 127 (3.2%) |
| $5,000 to $9,999 | 42 (0.6%) | 155 (3.9%) |
| $10,000 to $14,999 | 47 (0.6%) | 202 (5.1%) |
| $15,000 to $19,999 | 133 (1.8%) | 208 (5.3%) |
| $20,000 to $24,999 | 95 (1.3%) | 203 (5.1%) |
| $25,000 to $34,999 | 454 (6.2%) | 707 (17.9%) |
| $35,000 to $49,999 | 720 (9.9%) | 650 (16.4%) |
| $50,000 to $74,999 | 1,234 (16.9%) | 786 (19.9%) |
| $75,000 to $99,999 | 1,210 (16.6%) | 535 (13.5%) |
| $100,000 to $149,999 | 1,717 (23.5%) | 237 (6.0%) |
| $150,000 or more | 1,582 (21.6%) | 146 (3.7%) |
| Total | 7,306 (100.0%) | 3,956 (100.0%) |
Monthly Housing Cost Tiers in Neenah
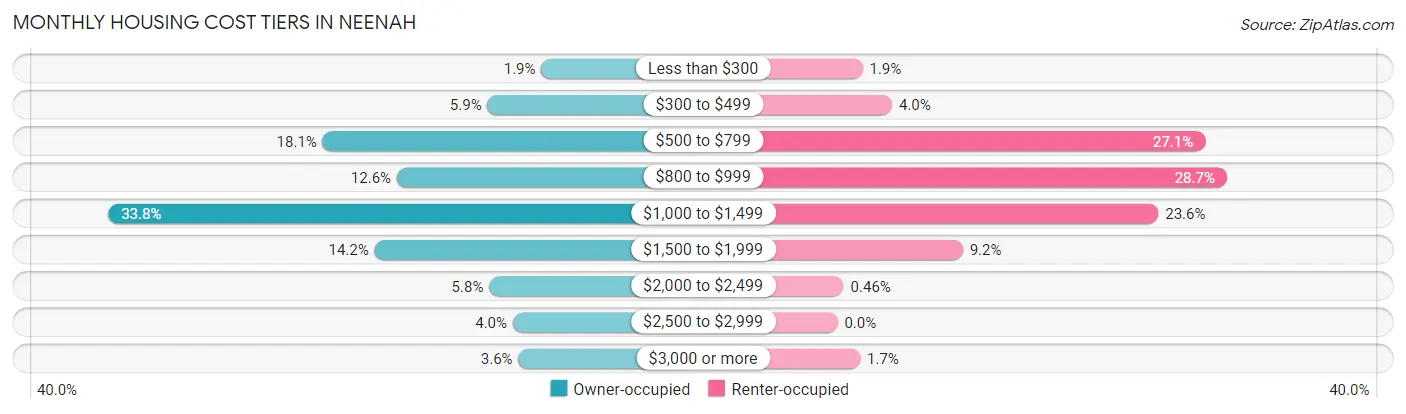
| Monthly Cost | Owner-occupied | Renter-occupied |
| Less than $300 | 142 (1.9%) | 73 (1.8%) |
| $300 to $499 | 432 (5.9%) | 159 (4.0%) |
| $500 to $799 | 1,319 (18.0%) | 1,071 (27.1%) |
| $800 to $999 | 919 (12.6%) | 1,134 (28.7%) |
| $1,000 to $1,499 | 2,472 (33.8%) | 935 (23.6%) |
| $1,500 to $1,999 | 1,040 (14.2%) | 365 (9.2%) |
| $2,000 to $2,499 | 422 (5.8%) | 18 (0.5%) |
| $2,500 to $2,999 | 295 (4.0%) | 0 (0.0%) |
| $3,000 or more | 265 (3.6%) | 66 (1.7%) |
| Total | 7,306 (100.0%) | 3,956 (100.0%) |
Physical Housing Characteristics in Neenah
Housing Structures in Neenah
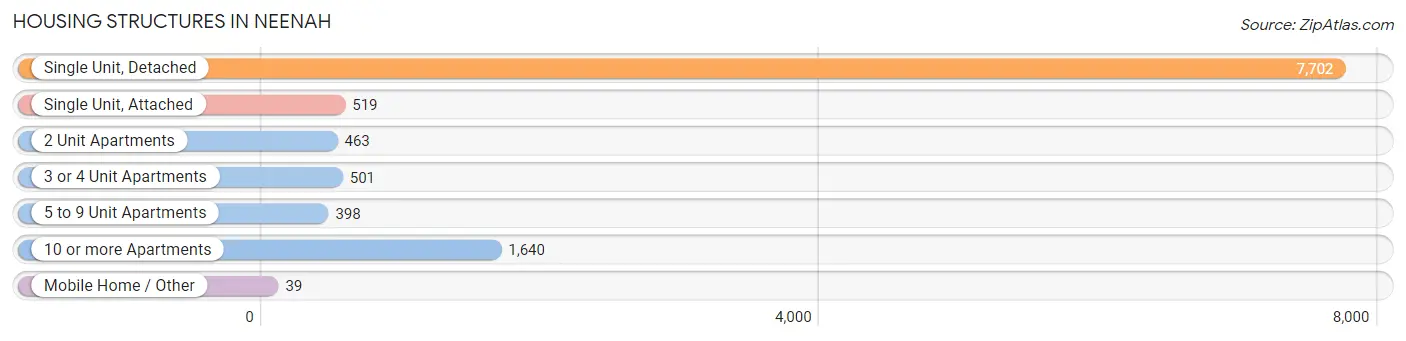
| Structure Type | # Housing Units | % Housing Units |
| Single Unit, Detached | 7,702 | 68.4% |
| Single Unit, Attached | 519 | 4.6% |
| 2 Unit Apartments | 463 | 4.1% |
| 3 or 4 Unit Apartments | 501 | 4.4% |
| 5 to 9 Unit Apartments | 398 | 3.5% |
| 10 or more Apartments | 1,640 | 14.6% |
| Mobile Home / Other | 39 | 0.4% |
| Total | 11,262 | 100.0% |
Housing Structures by Occupancy in Neenah
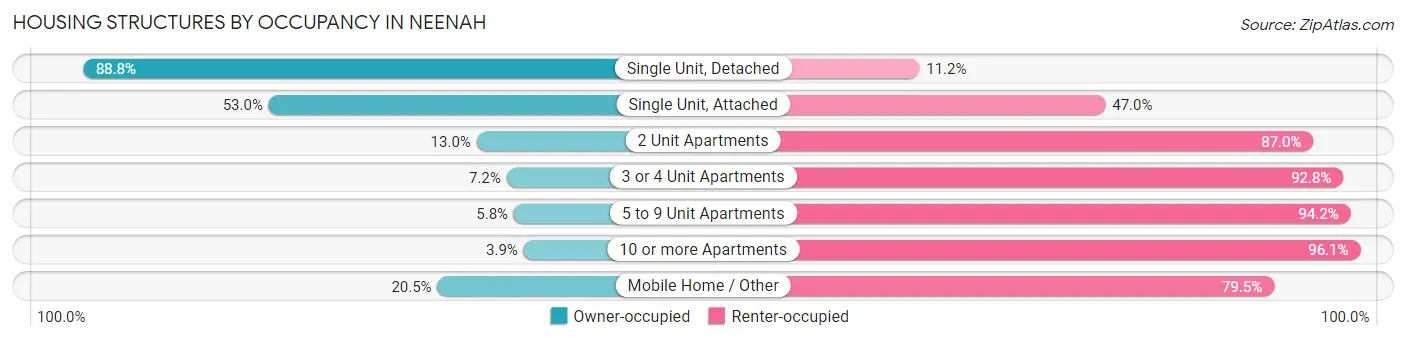
| Structure Type | Owner-occupied | Renter-occupied |
| Single Unit, Detached | 6,840 (88.8%) | 862 (11.2%) |
| Single Unit, Attached | 275 (53.0%) | 244 (47.0%) |
| 2 Unit Apartments | 60 (13.0%) | 403 (87.0%) |
| 3 or 4 Unit Apartments | 36 (7.2%) | 465 (92.8%) |
| 5 to 9 Unit Apartments | 23 (5.8%) | 375 (94.2%) |
| 10 or more Apartments | 64 (3.9%) | 1,576 (96.1%) |
| Mobile Home / Other | 8 (20.5%) | 31 (79.5%) |
| Total | 7,306 (64.9%) | 3,956 (35.1%) |
Housing Structures by Number of Rooms in Neenah
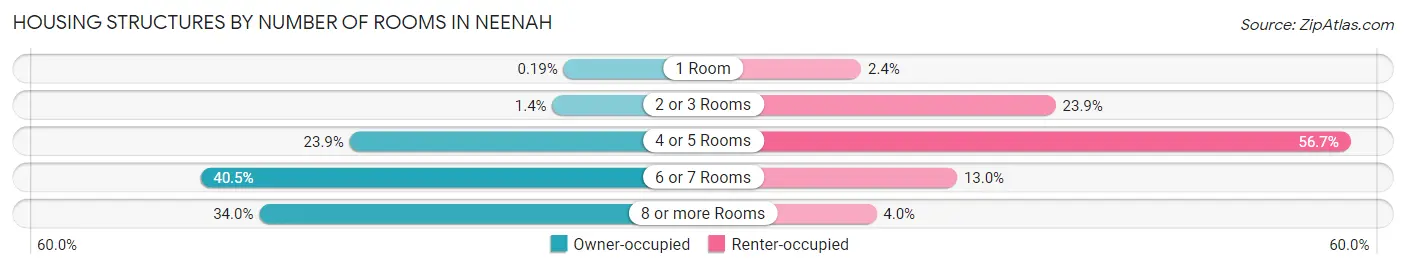
| Number of Rooms | Owner-occupied | Renter-occupied |
| 1 Room | 14 (0.2%) | 93 (2.4%) |
| 2 or 3 Rooms | 104 (1.4%) | 947 (23.9%) |
| 4 or 5 Rooms | 1,748 (23.9%) | 2,242 (56.7%) |
| 6 or 7 Rooms | 2,959 (40.5%) | 514 (13.0%) |
| 8 or more Rooms | 2,481 (34.0%) | 160 (4.0%) |
| Total | 7,306 (100.0%) | 3,956 (100.0%) |
Housing Structure by Heating Type in Neenah
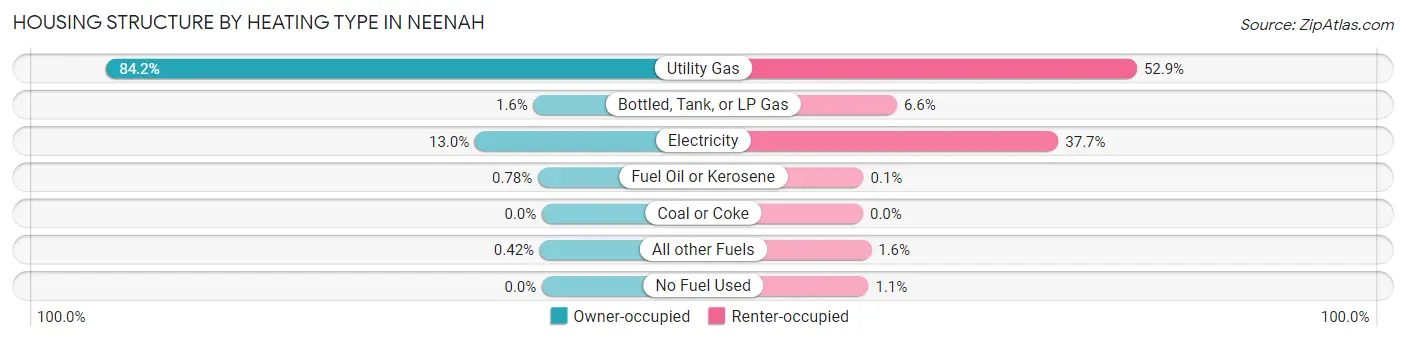
| Heating Type | Owner-occupied | Renter-occupied |
| Utility Gas | 6,152 (84.2%) | 2,094 (52.9%) |
| Bottled, Tank, or LP Gas | 120 (1.6%) | 260 (6.6%) |
| Electricity | 946 (13.0%) | 1,493 (37.7%) |
| Fuel Oil or Kerosene | 57 (0.8%) | 4 (0.1%) |
| Coal or Coke | 0 (0.0%) | 0 (0.0%) |
| All other Fuels | 31 (0.4%) | 63 (1.6%) |
| No Fuel Used | 0 (0.0%) | 42 (1.1%) |
| Total | 7,306 (100.0%) | 3,956 (100.0%) |
Household Vehicle Usage in Neenah
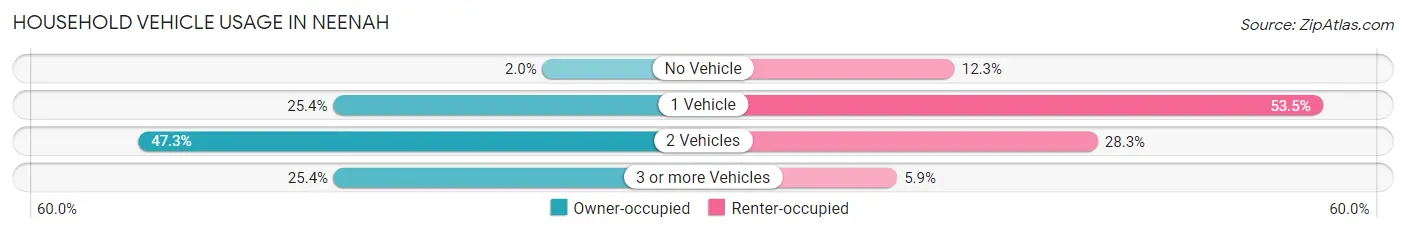
| Vehicles per Household | Owner-occupied | Renter-occupied |
| No Vehicle | 144 (2.0%) | 487 (12.3%) |
| 1 Vehicle | 1,857 (25.4%) | 2,116 (53.5%) |
| 2 Vehicles | 3,453 (47.3%) | 1,121 (28.3%) |
| 3 or more Vehicles | 1,852 (25.4%) | 232 (5.9%) |
| Total | 7,306 (100.0%) | 3,956 (100.0%) |
Real Estate & Mortgages in Neenah
Real Estate and Mortgage Overview in Neenah
| Characteristic | Without Mortgage | With Mortgage |
| Housing Units | 2,334 | 4,972 |
| Median Property Value | $195,200 | $171,900 |
| Median Household Income | $73,167 | $1,134 |
| Monthly Housing Costs | $641 | $245 |
| Real Estate Taxes | $3,580 | $70 |
Property Value by Mortgage Status in Neenah
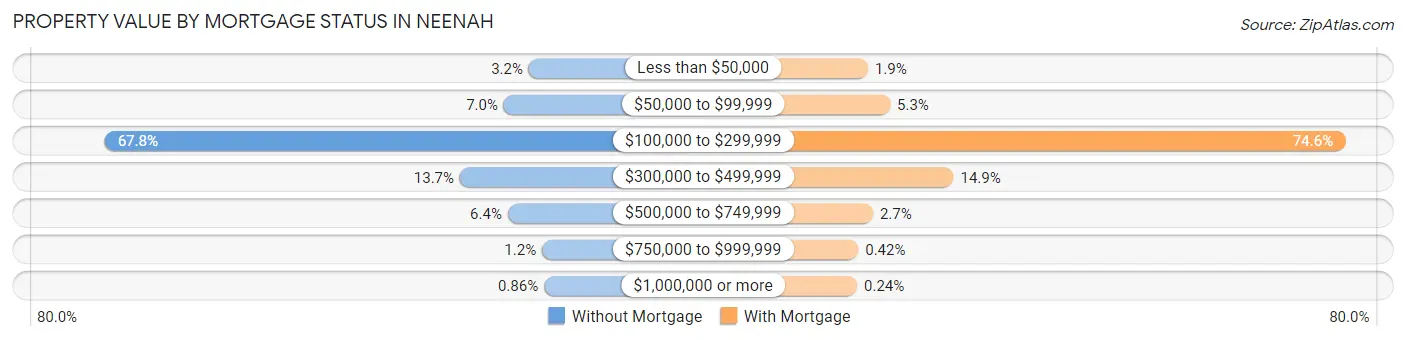
| Property Value | Without Mortgage | With Mortgage |
| Less than $50,000 | 74 (3.2%) | 94 (1.9%) |
| $50,000 to $99,999 | 163 (7.0%) | 262 (5.3%) |
| $100,000 to $299,999 | 1,582 (67.8%) | 3,708 (74.6%) |
| $300,000 to $499,999 | 319 (13.7%) | 743 (14.9%) |
| $500,000 to $749,999 | 149 (6.4%) | 132 (2.6%) |
| $750,000 to $999,999 | 27 (1.2%) | 21 (0.4%) |
| $1,000,000 or more | 20 (0.9%) | 12 (0.2%) |
| Total | 2,334 (100.0%) | 4,972 (100.0%) |
Household Income by Mortgage Status in Neenah
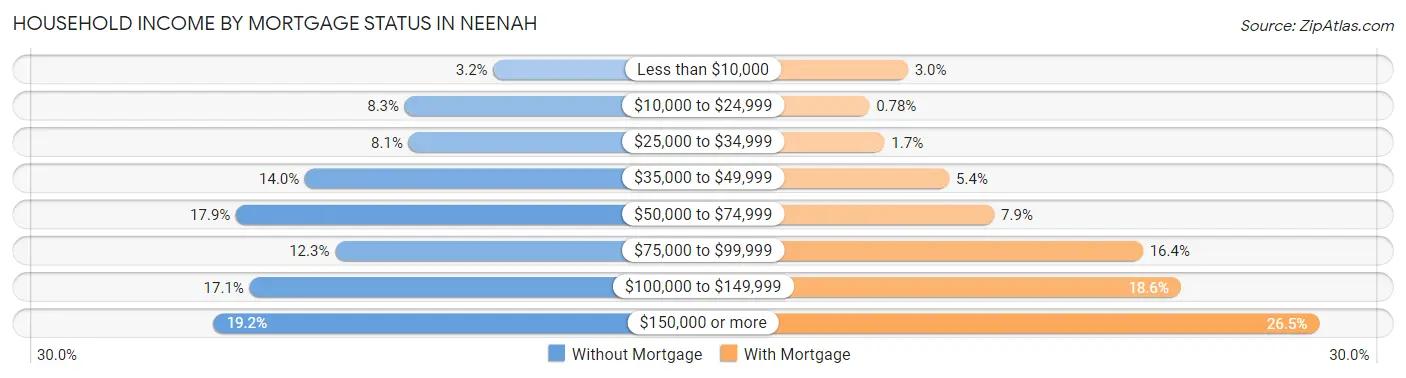
| Household Income | Without Mortgage | With Mortgage |
| Less than $10,000 | 75 (3.2%) | 148 (3.0%) |
| $10,000 to $24,999 | 193 (8.3%) | 39 (0.8%) |
| $25,000 to $34,999 | 188 (8.1%) | 82 (1.7%) |
| $35,000 to $49,999 | 326 (14.0%) | 266 (5.3%) |
| $50,000 to $74,999 | 418 (17.9%) | 394 (7.9%) |
| $75,000 to $99,999 | 286 (12.2%) | 816 (16.4%) |
| $100,000 to $149,999 | 400 (17.1%) | 924 (18.6%) |
| $150,000 or more | 448 (19.2%) | 1,317 (26.5%) |
| Total | 2,334 (100.0%) | 4,972 (100.0%) |
Property Value to Household Income Ratio in Neenah
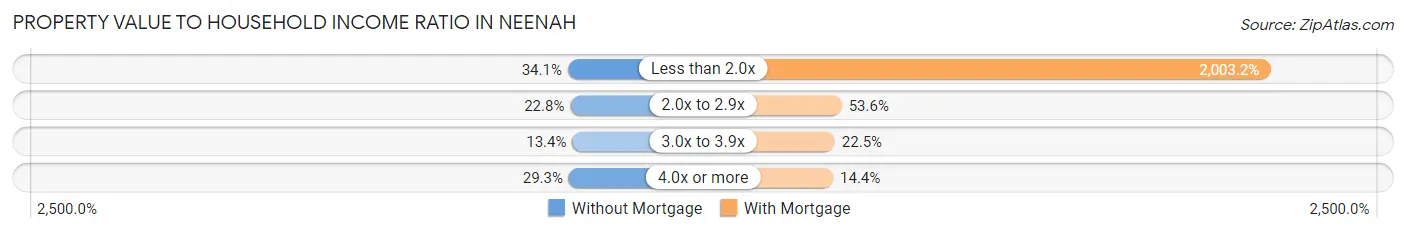
| Value-to-Income Ratio | Without Mortgage | With Mortgage |
| Less than 2.0x | 796 (34.1%) | 99,599 (2,003.2%) |
| 2.0x to 2.9x | 531 (22.8%) | 2,665 (53.6%) |
| 3.0x to 3.9x | 313 (13.4%) | 1,120 (22.5%) |
| 4.0x or more | 684 (29.3%) | 718 (14.4%) |
| Total | 2,334 (100.0%) | 4,972 (100.0%) |
Real Estate Taxes by Mortgage Status in Neenah
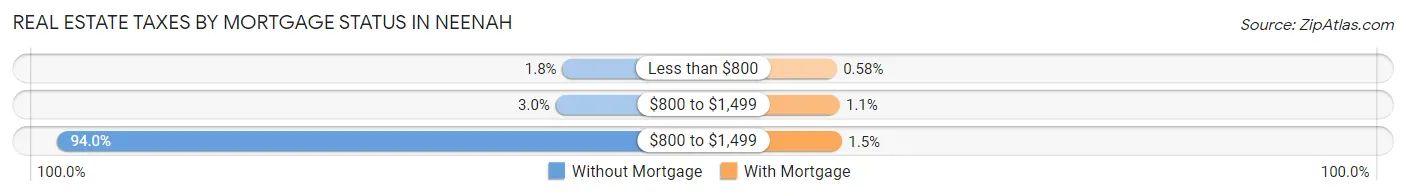
| Property Taxes | Without Mortgage | With Mortgage |
| Less than $800 | 41 (1.8%) | 29 (0.6%) |
| $800 to $1,499 | 70 (3.0%) | 54 (1.1%) |
| $800 to $1,499 | 2,193 (94.0%) | 75 (1.5%) |
| Total | 2,334 (100.0%) | 4,972 (100.0%) |
Health & Disability in Neenah
Health Insurance Coverage by Age in Neenah
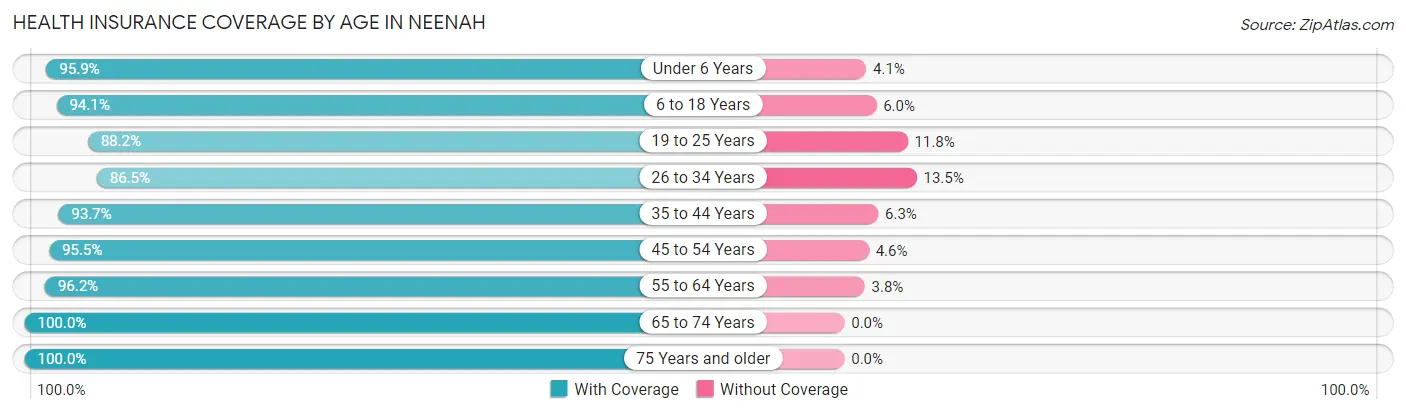
| Age Bracket | With Coverage | Without Coverage |
| Under 6 Years | 1,979 (95.9%) | 84 (4.1%) |
| 6 to 18 Years | 4,884 (94.1%) | 309 (5.9%) |
| 19 to 25 Years | 1,940 (88.2%) | 259 (11.8%) |
| 26 to 34 Years | 2,987 (86.5%) | 465 (13.5%) |
| 35 to 44 Years | 3,436 (93.7%) | 231 (6.3%) |
| 45 to 54 Years | 3,422 (95.5%) | 163 (4.5%) |
| 55 to 64 Years | 2,997 (96.2%) | 118 (3.8%) |
| 65 to 74 Years | 2,264 (100.0%) | 0 (0.0%) |
| 75 Years and older | 1,664 (100.0%) | 0 (0.0%) |
| Total | 25,573 (94.0%) | 1,629 (6.0%) |
Health Insurance Coverage by Citizenship Status in Neenah
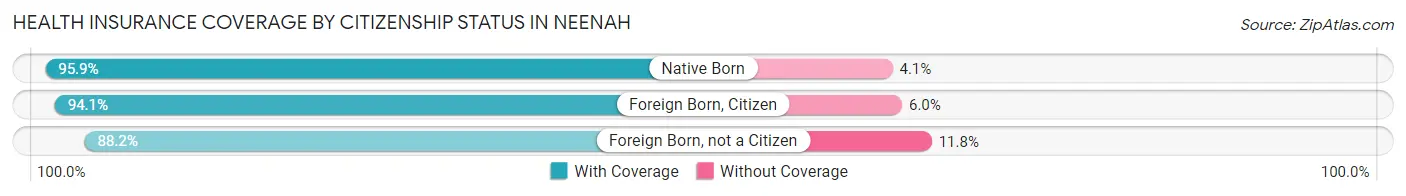
| Citizenship Status | With Coverage | Without Coverage |
| Native Born | 1,979 (95.9%) | 84 (4.1%) |
| Foreign Born, Citizen | 4,884 (94.1%) | 309 (5.9%) |
| Foreign Born, not a Citizen | 1,940 (88.2%) | 259 (11.8%) |
Health Insurance Coverage by Household Income in Neenah
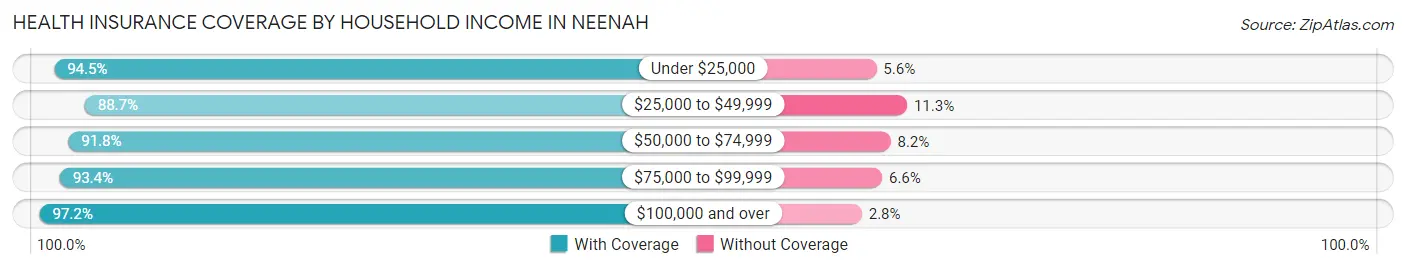
| Household Income | With Coverage | Without Coverage |
| Under $25,000 | 1,788 (94.5%) | 105 (5.6%) |
| $25,000 to $49,999 | 4,247 (88.7%) | 540 (11.3%) |
| $50,000 to $74,999 | 4,097 (91.8%) | 366 (8.2%) |
| $75,000 to $99,999 | 4,073 (93.4%) | 288 (6.6%) |
| $100,000 and over | 11,309 (97.2%) | 327 (2.8%) |
Public vs Private Health Insurance Coverage by Age in Neenah
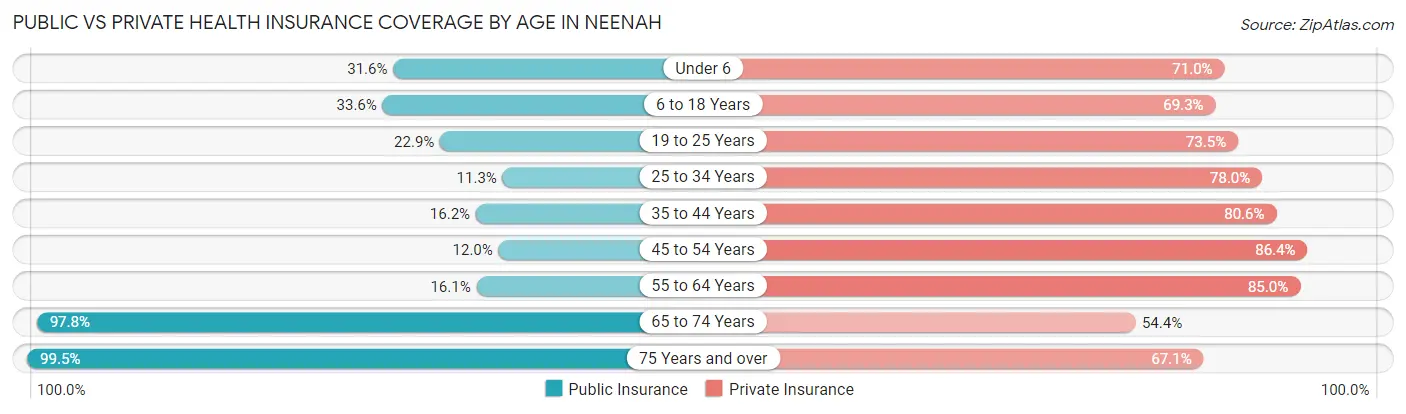
| Age Bracket | Public Insurance | Private Insurance |
| Under 6 | 651 (31.6%) | 1,465 (71.0%) |
| 6 to 18 Years | 1,742 (33.6%) | 3,601 (69.3%) |
| 19 to 25 Years | 503 (22.9%) | 1,617 (73.5%) |
| 25 to 34 Years | 389 (11.3%) | 2,693 (78.0%) |
| 35 to 44 Years | 595 (16.2%) | 2,957 (80.6%) |
| 45 to 54 Years | 431 (12.0%) | 3,098 (86.4%) |
| 55 to 64 Years | 502 (16.1%) | 2,649 (85.0%) |
| 65 to 74 Years | 2,213 (97.8%) | 1,232 (54.4%) |
| 75 Years and over | 1,656 (99.5%) | 1,117 (67.1%) |
| Total | 8,682 (31.9%) | 20,429 (75.1%) |
Disability Status by Sex by Age in Neenah
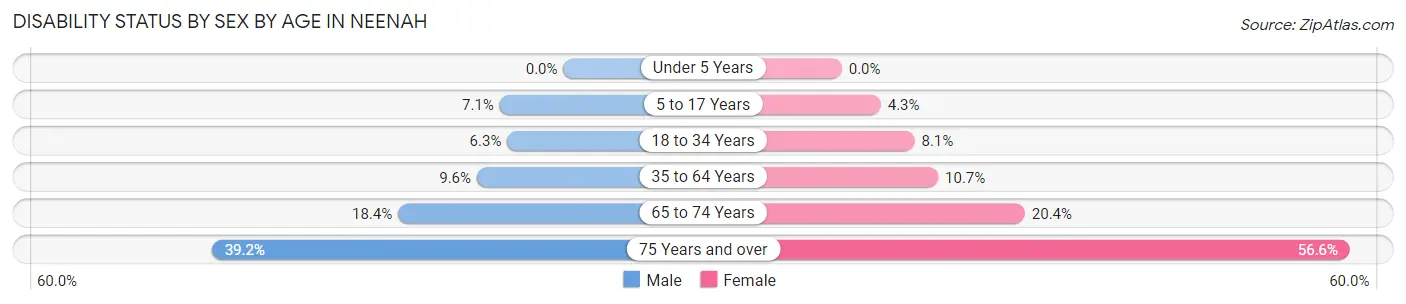
| Age Bracket | Male | Female |
| Under 5 Years | 0 (0.0%) | 0 (0.0%) |
| 5 to 17 Years | 187 (7.1%) | 117 (4.3%) |
| 18 to 34 Years | 203 (6.2%) | 224 (8.1%) |
| 35 to 64 Years | 497 (9.6%) | 559 (10.7%) |
| 65 to 74 Years | 183 (18.4%) | 259 (20.4%) |
| 75 Years and over | 336 (39.2%) | 456 (56.6%) |
Disability Class by Sex by Age in Neenah
Disability Class: Hearing Difficulty
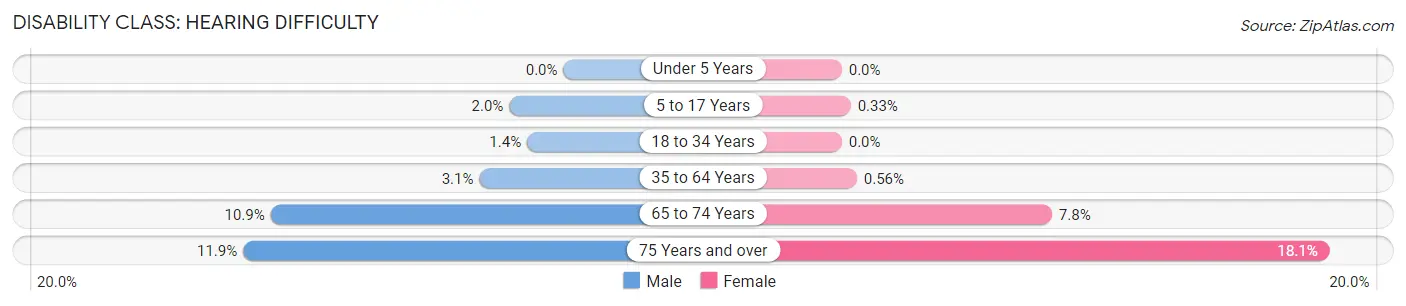
| Age Bracket | Male | Female |
| Under 5 Years | 0 (0.0%) | 0 (0.0%) |
| 5 to 17 Years | 53 (2.0%) | 9 (0.3%) |
| 18 to 34 Years | 44 (1.3%) | 0 (0.0%) |
| 35 to 64 Years | 161 (3.1%) | 29 (0.6%) |
| 65 to 74 Years | 108 (10.9%) | 99 (7.8%) |
| 75 Years and over | 102 (11.9%) | 146 (18.1%) |
Disability Class: Vision Difficulty
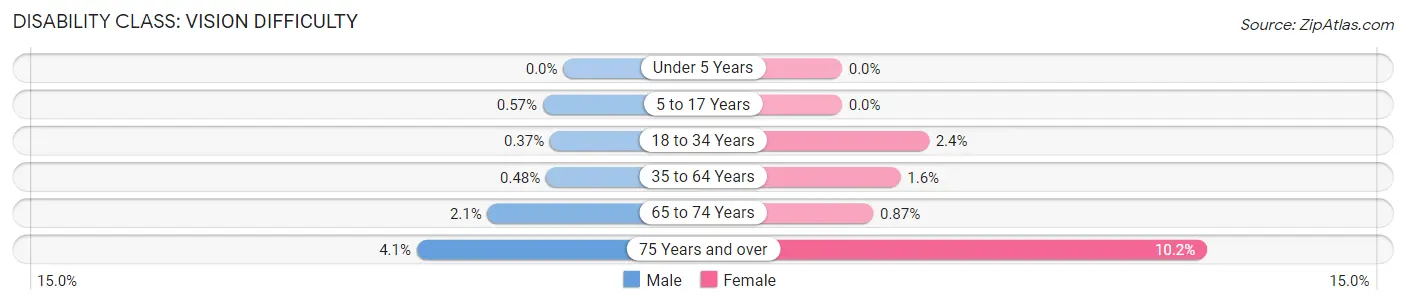
| Age Bracket | Male | Female |
| Under 5 Years | 0 (0.0%) | 0 (0.0%) |
| 5 to 17 Years | 15 (0.6%) | 0 (0.0%) |
| 18 to 34 Years | 12 (0.4%) | 67 (2.4%) |
| 35 to 64 Years | 25 (0.5%) | 85 (1.6%) |
| 65 to 74 Years | 21 (2.1%) | 11 (0.9%) |
| 75 Years and over | 35 (4.1%) | 82 (10.2%) |
Disability Class: Cognitive Difficulty
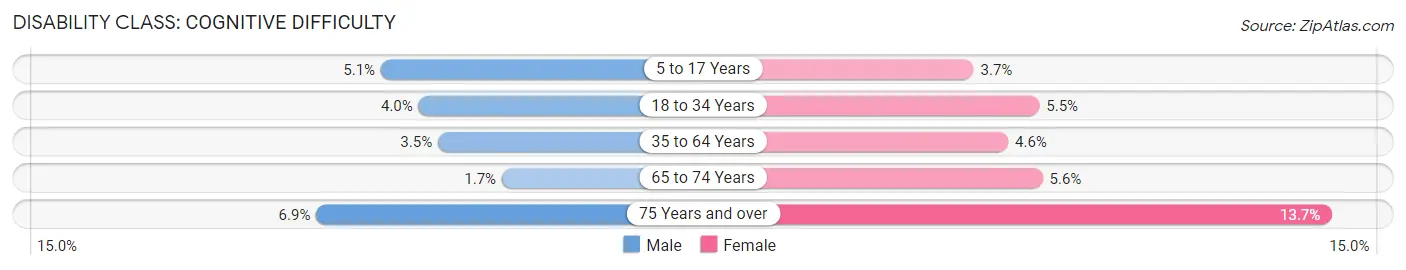
| Age Bracket | Male | Female |
| 5 to 17 Years | 134 (5.1%) | 99 (3.7%) |
| 18 to 34 Years | 131 (4.0%) | 152 (5.5%) |
| 35 to 64 Years | 180 (3.5%) | 241 (4.6%) |
| 65 to 74 Years | 17 (1.7%) | 71 (5.6%) |
| 75 Years and over | 59 (6.9%) | 110 (13.7%) |
Disability Class: Ambulatory Difficulty
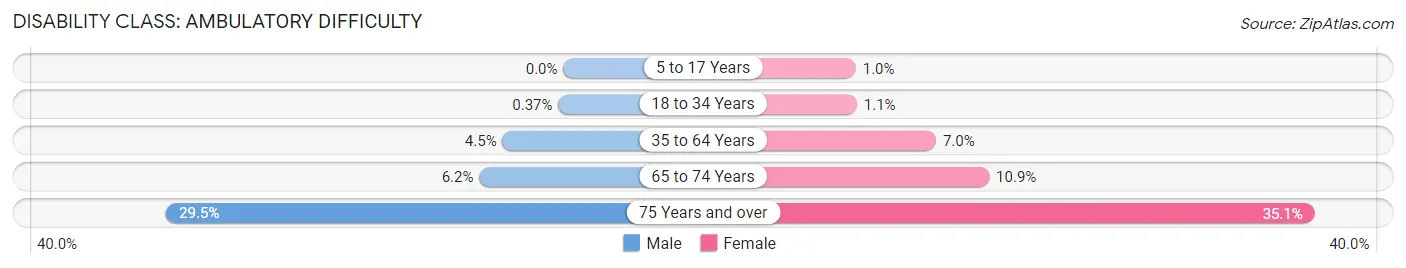
| Age Bracket | Male | Female |
| 5 to 17 Years | 0 (0.0%) | 28 (1.0%) |
| 18 to 34 Years | 12 (0.4%) | 31 (1.1%) |
| 35 to 64 Years | 233 (4.5%) | 364 (7.0%) |
| 65 to 74 Years | 62 (6.2%) | 139 (10.9%) |
| 75 Years and over | 253 (29.5%) | 283 (35.1%) |
Disability Class: Self-Care Difficulty
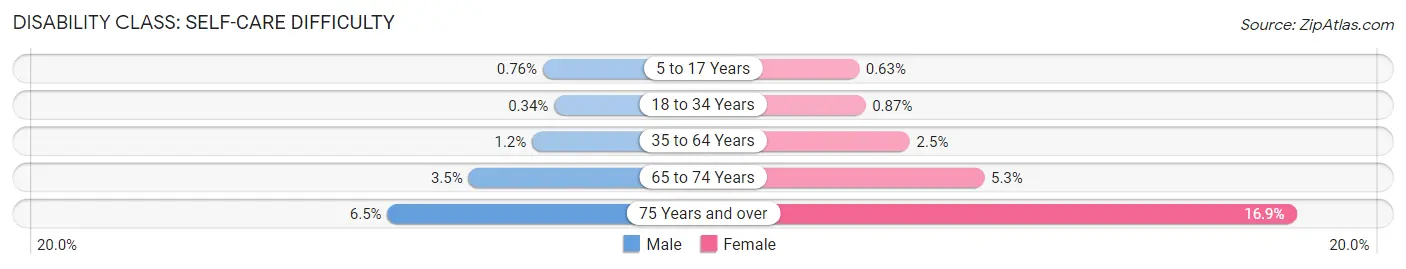
| Age Bracket | Male | Female |
| 5 to 17 Years | 20 (0.8%) | 17 (0.6%) |
| 18 to 34 Years | 11 (0.3%) | 24 (0.9%) |
| 35 to 64 Years | 60 (1.2%) | 131 (2.5%) |
| 65 to 74 Years | 35 (3.5%) | 67 (5.3%) |
| 75 Years and over | 56 (6.5%) | 136 (16.9%) |
Technology Access in Neenah
Computing Device Access in Neenah
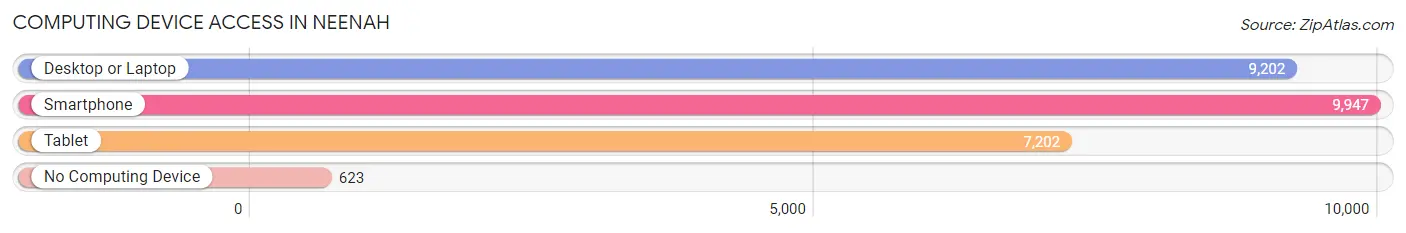
| Device Type | # Households | % Households |
| Desktop or Laptop | 9,202 | 81.7% |
| Smartphone | 9,947 | 88.3% |
| Tablet | 7,202 | 63.9% |
| No Computing Device | 623 | 5.5% |
| Total | 11,262 | 100.0% |
Internet Access in Neenah
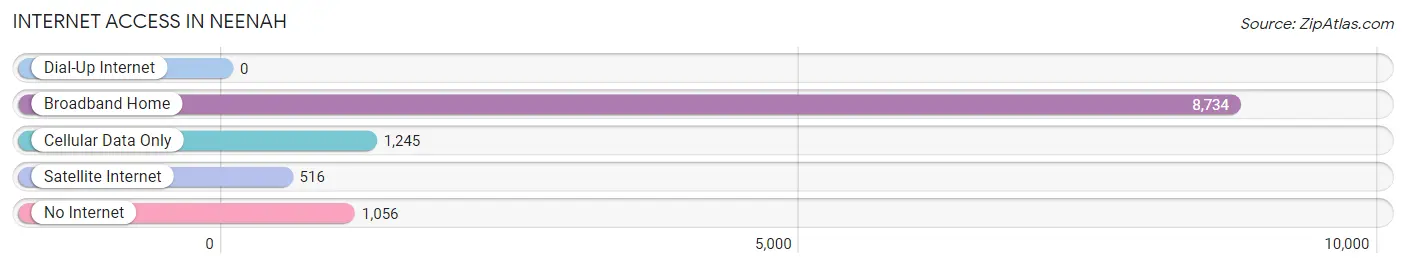
| Internet Type | # Households | % Households |
| Dial-Up Internet | 0 | 0.0% |
| Broadband Home | 8,734 | 77.5% |
| Cellular Data Only | 1,245 | 11.1% |
| Satellite Internet | 516 | 4.6% |
| No Internet | 1,056 | 9.4% |
| Total | 11,262 | 100.0% |
Neenah Summary
Neenah, Wisconsin is a city located in Winnebago County, Wisconsin, United States. It is situated on the Fox River, approximately 25 miles (40 km) southwest of Green Bay and 100 miles (160 km) north of Milwaukee. As of the 2010 census, the city had a population of 25,501.
History
The area that is now Neenah was originally inhabited by the Menominee and Winnebago Native American tribes. The first European settlers arrived in the area in the 1830s, and the city was officially incorporated in 1873. The city was named after the Menominee word for “running water”.
In the late 19th century, Neenah became an important industrial center, with several paper mills and other factories located in the city. The city’s economy was further bolstered by the arrival of the railroad in 1882.
Geography
Neenah is located at 44°10′N 88°27′W (44.17, -88.45). According to the United States Census Bureau, the city has a total area of 11.2 square miles (29.0 km2), of which 10.9 square miles (28.2 km2) is land and 0.3 square miles (0.8 km2) is water.
Economy
Neenah’s economy is largely based on manufacturing and services. The city is home to several paper mills, including Kimberly-Clark, which is the largest employer in the city. Other major employers include Bemis Company, Plexus Corporation, and Menasha Corporation.
The city also has a vibrant retail sector, with several shopping centers and malls located in the city. The city is also home to several restaurants, bars, and other entertainment venues.
Demographics
As of the 2010 census, there were 25,501 people, 10,717 households, and 6,845 families residing in the city. The population density was 2,335.2 people per square mile (902.2/km2). There were 11,541 housing units at an average density of 1,062.2 per square mile (410.2/km2). The racial makeup of the city was 94.2% White, 1.2% African American, 0.4% Native American, 1.7% Asian, 0.7% from other races, and 1.8% from two or more races. Hispanic or Latino of any race were 2.7% of the population.
There were 10,717 households, out of which 30.2% had children under the age of 18 living with them, 50.2% were married couples living together, 10.2% had a female householder with no husband present, and 35.3% were non-families. 29.2% of all households were made up of individuals, and 11.7% had someone living alone who was 65 years of age or older. The average household size was 2.37 and the average family size was 2.94.
In the city, the population was spread out, with 24.2% under the age of 18, 7.7% from 18 to 24, 28.2% from 25 to 44, 24.2% from 45 to 64, and 15.7% who were 65 years of age or older. The median age was 38 years. For every 100 females, there were 93.2 males. For every 100 females age 18 and over, there were 90.2 males.
The median income for a household in the city was $48,945, and the median income for a family was $60,945. Males had a median income of $41,945 versus $30,945 for females. The per capita income for the city was $25,945. About 4.2% of families and 6.2% of the population were below the poverty line, including 8.2% of those under age 18 and 5.2% of those age 65 or over.
Common Questions
What is Per Capita Income in Neenah?
Per Capita income in Neenah is $38,823.
What is the Median Family Income in Neenah?
Median Family Income in Neenah is $92,679.
What is the Median Household income in Neenah?
Median Household Income in Neenah is $71,280.
What is Income or Wage Gap in Neenah?
Income or Wage Gap in Neenah is 28.3%.
Women in Neenah earn 71.7 cents for every dollar earned by a man.
What is Family Income Deficit in Neenah?
Family Income Deficit in Neenah is $9,474.
Families that are below poverty line in Neenah earn $9,474 less on average than the poverty threshold level.
What is Inequality or Gini Index in Neenah?
Inequality or Gini Index in Neenah is 0.43.
What is the Total Population of Neenah?
Total Population of Neenah is 27,309.
What is the Total Male Population of Neenah?
Total Male Population of Neenah is 13,842.
What is the Total Female Population of Neenah?
Total Female Population of Neenah is 13,467.
What is the Ratio of Males per 100 Females in Neenah?
There are 102.78 Males per 100 Females in Neenah.
What is the Ratio of Females per 100 Males in Neenah?
There are 97.29 Females per 100 Males in Neenah.
What is the Median Population Age in Neenah?
Median Population Age in Neenah is 36.9 Years.
What is the Average Family Size in Neenah
Average Family Size in Neenah is 3.0 People.
What is the Average Household Size in Neenah
Average Household Size in Neenah is 2.4 People.
How Large is the Labor Force in Neenah?
There are 14,769 People in the Labor Forcein in Neenah.
What is the Percentage of People in the Labor Force in Neenah?
69.5% of People are in the Labor Force in Neenah.
What is the Unemployment Rate in Neenah?
Unemployment Rate in Neenah is 2.7%.