Sheboygan, WI Map & Demographics
Sheboygan Map
Sheboygan Overview
$31,290
PER CAPITA INCOME
$72,962
AVG FAMILY INCOME
$59,861
AVG HOUSEHOLD INCOME
27.4%
WAGE / INCOME GAP [ % ]
72.6¢/ $1
WAGE / INCOME GAP [ $ ]
$11,150
FAMILY INCOME DEFICIT
0.39
INEQUALITY / GINI INDEX
49,805
TOTAL POPULATION
25,498
MALE POPULATION
24,307
FEMALE POPULATION
104.90
MALES / 100 FEMALES
95.33
FEMALES / 100 MALES
37.0
MEDIAN AGE
3.2
AVG FAMILY SIZE
2.3
AVG HOUSEHOLD SIZE
26,542
LABOR FORCE [ PEOPLE ]
68.2%
PERCENT IN LABOR FORCE
3.4%
UNEMPLOYMENT RATE
Sheboygan Area Codes
Income in Sheboygan
Income Overview in Sheboygan
Per Capita Income in Sheboygan is $31,290, while median incomes of families and households are $72,962 and $59,861 respectively.
| Characteristic | Number | Measure |
| Per Capita Income | 49,805 | $31,290 |
| Median Family Income | 11,502 | $72,962 |
| Mean Family Income | 11,502 | $88,007 |
| Median Household Income | 21,046 | $59,861 |
| Mean Household Income | 21,046 | $71,962 |
| Income Deficit | 11,502 | $11,150 |
| Wage / Income Gap (%) | 49,805 | 27.38% |
| Wage / Income Gap ($) | 49,805 | 72.62¢ per $1 |
| Gini / Inequality Index | 49,805 | 0.39 |
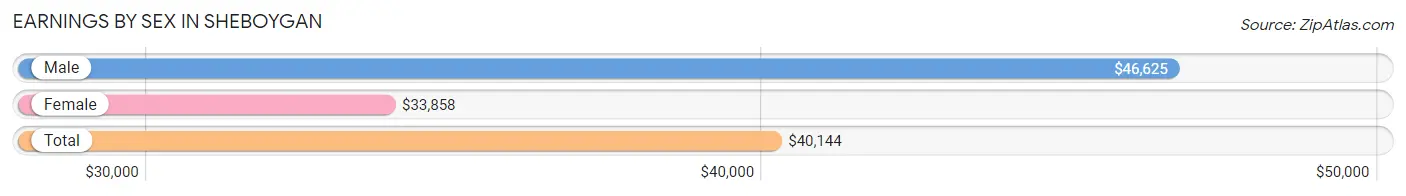
Earnings by Sex in Sheboygan
Average Earnings in Sheboygan are $40,144, $46,625 for men and $33,858 for women, a difference of 27.4%.
| Sex | Number | Average Earnings |
| Male | 14,824 (53.4%) | $46,625 |
| Female | 12,945 (46.6%) | $33,858 |
| Total | 27,769 (100.0%) | $40,144 |
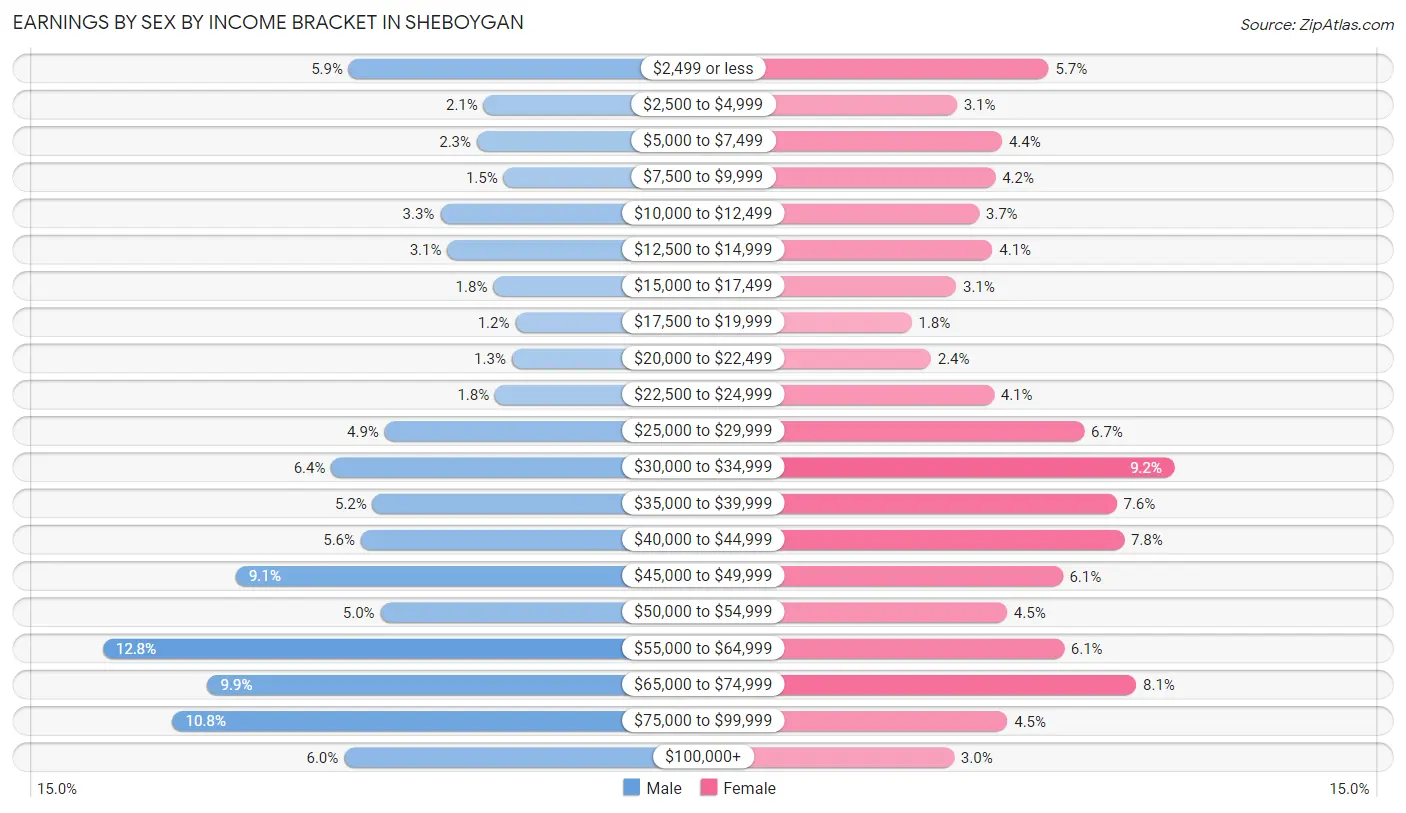
Earnings by Sex by Income Bracket in Sheboygan
The most common earnings brackets in Sheboygan are $55,000 to $64,999 for men (1,898 | 12.8%) and $30,000 to $34,999 for women (1,189 | 9.2%).
| Income | Male | Female |
| $2,499 or less | 873 (5.9%) | 734 (5.7%) |
| $2,500 to $4,999 | 311 (2.1%) | 400 (3.1%) |
| $5,000 to $7,499 | 339 (2.3%) | 565 (4.4%) |
| $7,500 to $9,999 | 229 (1.5%) | 540 (4.2%) |
| $10,000 to $12,499 | 492 (3.3%) | 480 (3.7%) |
| $12,500 to $14,999 | 462 (3.1%) | 530 (4.1%) |
| $15,000 to $17,499 | 272 (1.8%) | 398 (3.1%) |
| $17,500 to $19,999 | 180 (1.2%) | 236 (1.8%) |
| $20,000 to $22,499 | 194 (1.3%) | 306 (2.4%) |
| $22,500 to $24,999 | 264 (1.8%) | 534 (4.1%) |
| $25,000 to $29,999 | 723 (4.9%) | 863 (6.7%) |
| $30,000 to $34,999 | 946 (6.4%) | 1,189 (9.2%) |
| $35,000 to $39,999 | 774 (5.2%) | 981 (7.6%) |
| $40,000 to $44,999 | 822 (5.6%) | 1,008 (7.8%) |
| $45,000 to $49,999 | 1,343 (9.1%) | 784 (6.1%) |
| $50,000 to $54,999 | 741 (5.0%) | 582 (4.5%) |
| $55,000 to $64,999 | 1,898 (12.8%) | 790 (6.1%) |
| $65,000 to $74,999 | 1,462 (9.9%) | 1,052 (8.1%) |
| $75,000 to $99,999 | 1,607 (10.8%) | 584 (4.5%) |
| $100,000+ | 892 (6.0%) | 389 (3.0%) |
| Total | 14,824 (100.0%) | 12,945 (100.0%) |
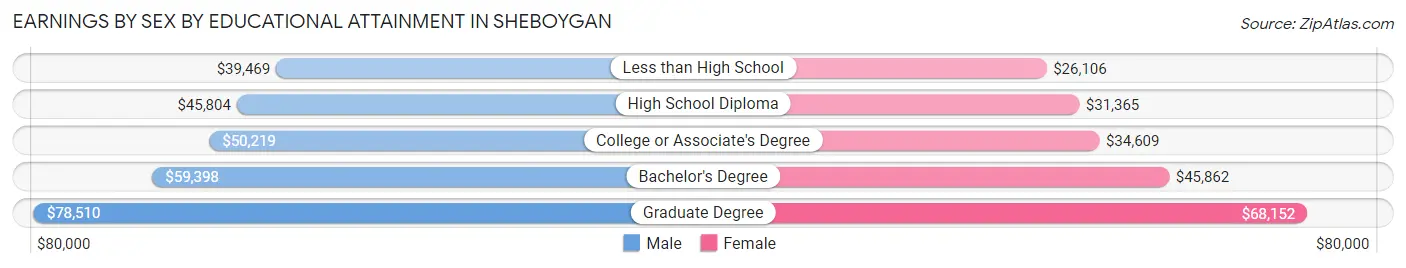
Earnings by Sex by Educational Attainment in Sheboygan
Average earnings in Sheboygan are $50,556 for men and $35,923 for women, a difference of 28.9%. Men with an educational attainment of graduate degree enjoy the highest average annual earnings of $78,510, while those with less than high school education earn the least with $39,469. Women with an educational attainment of graduate degree earn the most with the average annual earnings of $68,152, while those with less than high school education have the smallest earnings of $26,106.
| Educational Attainment | Male Income | Female Income |
| Less than High School | $39,469 | $26,106 |
| High School Diploma | $45,804 | $31,365 |
| College or Associate's Degree | $50,219 | $34,609 |
| Bachelor's Degree | $59,398 | $45,862 |
| Graduate Degree | $78,510 | $68,152 |
| Total | $50,556 | $35,923 |
Family Income in Sheboygan
Family Income Brackets in Sheboygan
According to the Sheboygan family income data, there are 3,037 families falling into the $50,000 to $74,999 income range, which is the most common income bracket and makes up 26.4% of all families. Conversely, the $10,000 to $14,999 income bracket is the least frequent group with only 104 families (0.9%) belonging to this category.
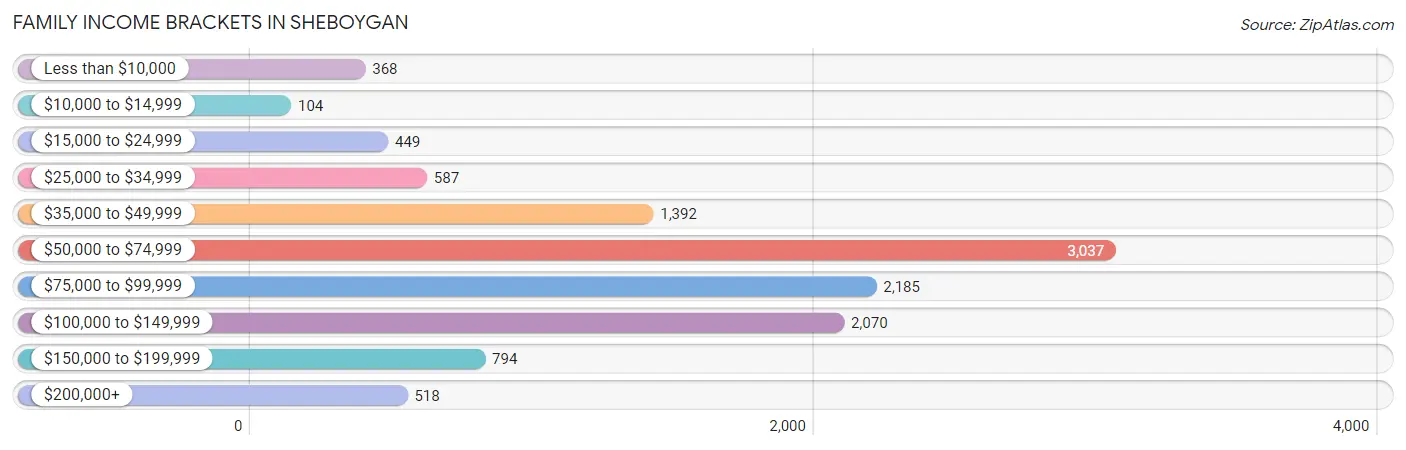
| Income Bracket | # Families | % Families |
| Less than $10,000 | 368 | 3.2% |
| $10,000 to $14,999 | 104 | 0.9% |
| $15,000 to $24,999 | 449 | 3.9% |
| $25,000 to $34,999 | 587 | 5.1% |
| $35,000 to $49,999 | 1,392 | 12.1% |
| $50,000 to $74,999 | 3,037 | 26.4% |
| $75,000 to $99,999 | 2,185 | 19.0% |
| $100,000 to $149,999 | 2,070 | 18.0% |
| $150,000 to $199,999 | 794 | 6.9% |
| $200,000+ | 518 | 4.5% |
Family Income by Famaliy Size in Sheboygan
6-person families (528 | 4.6%) account for the highest median family income in Sheboygan with $108,894 per family, while 2-person families (5,666 | 49.3%) have the highest median income of $34,441 per family member.
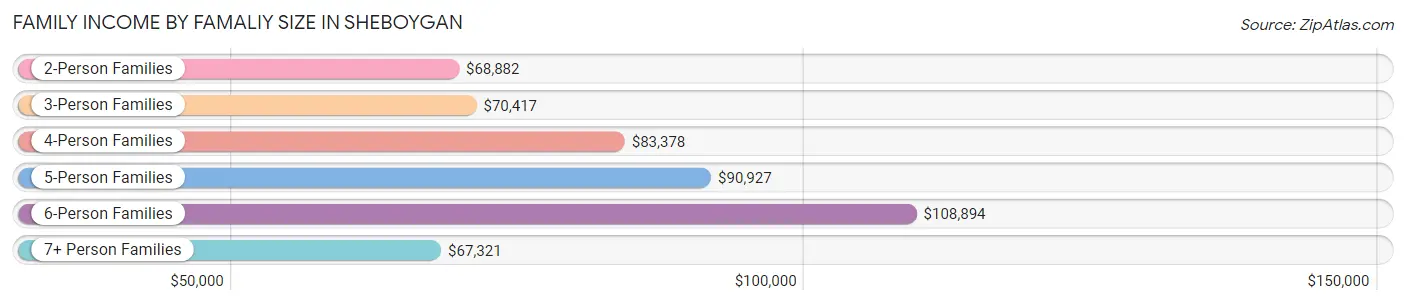
| Income Bracket | # Families | Median Income |
| 2-Person Families | 5,666 (49.3%) | $68,882 |
| 3-Person Families | 2,322 (20.2%) | $70,417 |
| 4-Person Families | 1,630 (14.2%) | $83,378 |
| 5-Person Families | 915 (8.0%) | $90,927 |
| 6-Person Families | 528 (4.6%) | $108,894 |
| 7+ Person Families | 441 (3.8%) | $67,321 |
| Total | 11,502 (100.0%) | $72,962 |
Family Income by Number of Earners in Sheboygan
The median family income in Sheboygan is $72,962, with families comprising 3+ earners (1,511) having the highest median family income of $109,821, while families with no earners (1,515) have the lowest median family income of $50,216, accounting for 13.1% and 13.2% of families, respectively.
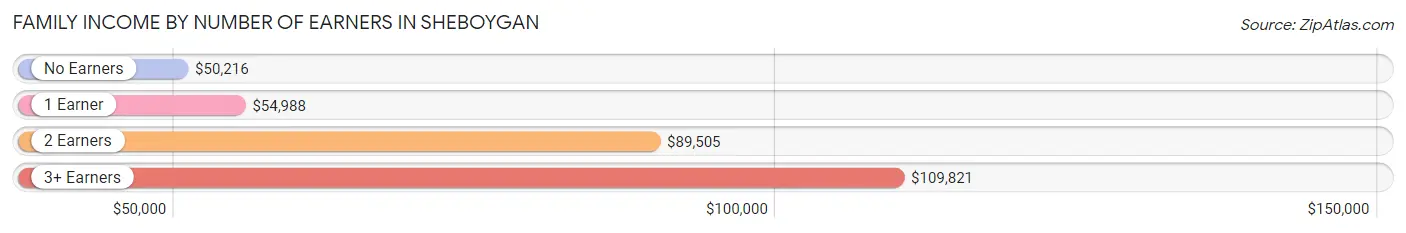
| Number of Earners | # Families | Median Income |
| No Earners | 1,515 (13.2%) | $50,216 |
| 1 Earner | 3,450 (30.0%) | $54,988 |
| 2 Earners | 5,026 (43.7%) | $89,505 |
| 3+ Earners | 1,511 (13.1%) | $109,821 |
| Total | 11,502 (100.0%) | $72,962 |
Household Income in Sheboygan
Household Income Brackets in Sheboygan
With 5,367 households falling in the category, the $50,000 to $74,999 income range is the most frequent in Sheboygan, accounting for 25.5% of all households. In contrast, only 547 households (2.6%) fall into the $200,000+ income bracket, making it the least populous group.
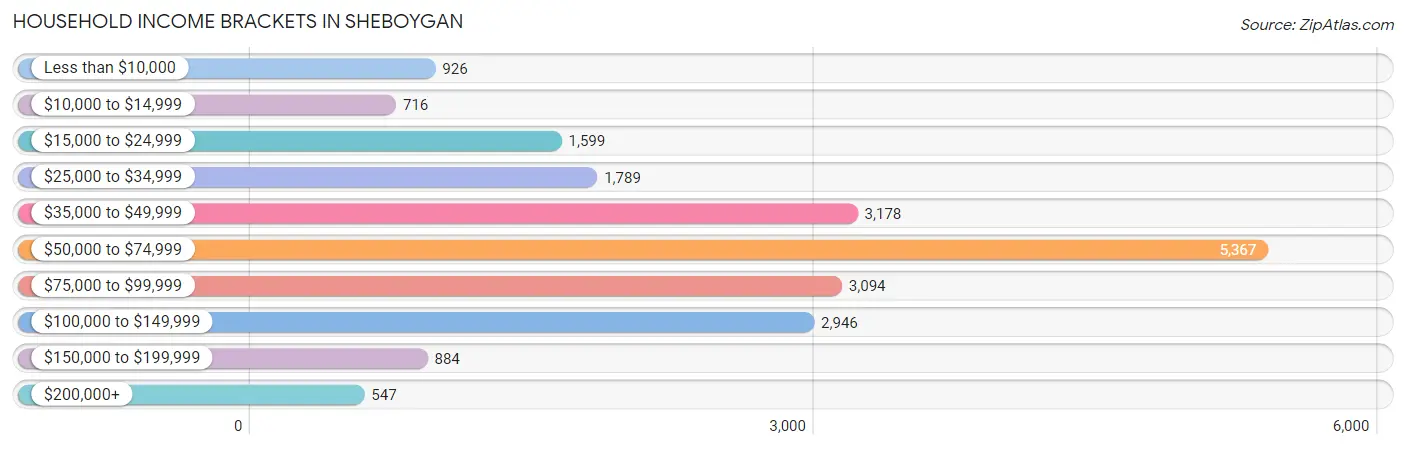
| Income Bracket | # Households | % Households |
| Less than $10,000 | 926 | 4.4% |
| $10,000 to $14,999 | 716 | 3.4% |
| $15,000 to $24,999 | 1,599 | 7.6% |
| $25,000 to $34,999 | 1,789 | 8.5% |
| $35,000 to $49,999 | 3,178 | 15.1% |
| $50,000 to $74,999 | 5,367 | 25.5% |
| $75,000 to $99,999 | 3,094 | 14.7% |
| $100,000 to $149,999 | 2,946 | 14.0% |
| $150,000 to $199,999 | 884 | 4.2% |
| $200,000+ | 547 | 2.6% |
Household Income by Householder Age in Sheboygan
The median household income in Sheboygan is $59,861, with the highest median household income of $67,307 found in the 45 to 64 years age bracket for the primary householder. A total of 7,380 households (35.1%) fall into this category. Meanwhile, the 65+ years age bracket for the primary householder has the lowest median household income of $43,766, with 5,360 households (25.5%) in this group.
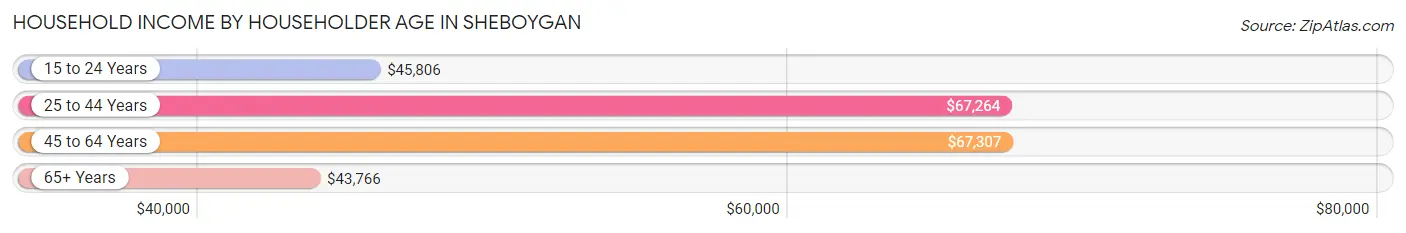
| Income Bracket | # Households | Median Income |
| 15 to 24 Years | 1,126 (5.3%) | $45,806 |
| 25 to 44 Years | 7,180 (34.1%) | $67,264 |
| 45 to 64 Years | 7,380 (35.1%) | $67,307 |
| 65+ Years | 5,360 (25.5%) | $43,766 |
| Total | 21,046 (100.0%) | $59,861 |
Poverty in Sheboygan
Income Below Poverty by Sex and Age in Sheboygan
With 11.1% poverty level for males and 11.7% for females among the residents of Sheboygan, 12 to 14 year old males and 55 to 64 year old females are the most vulnerable to poverty, with 257 males (23.0%) and 421 females (16.0%) in their respective age groups living below the poverty level.
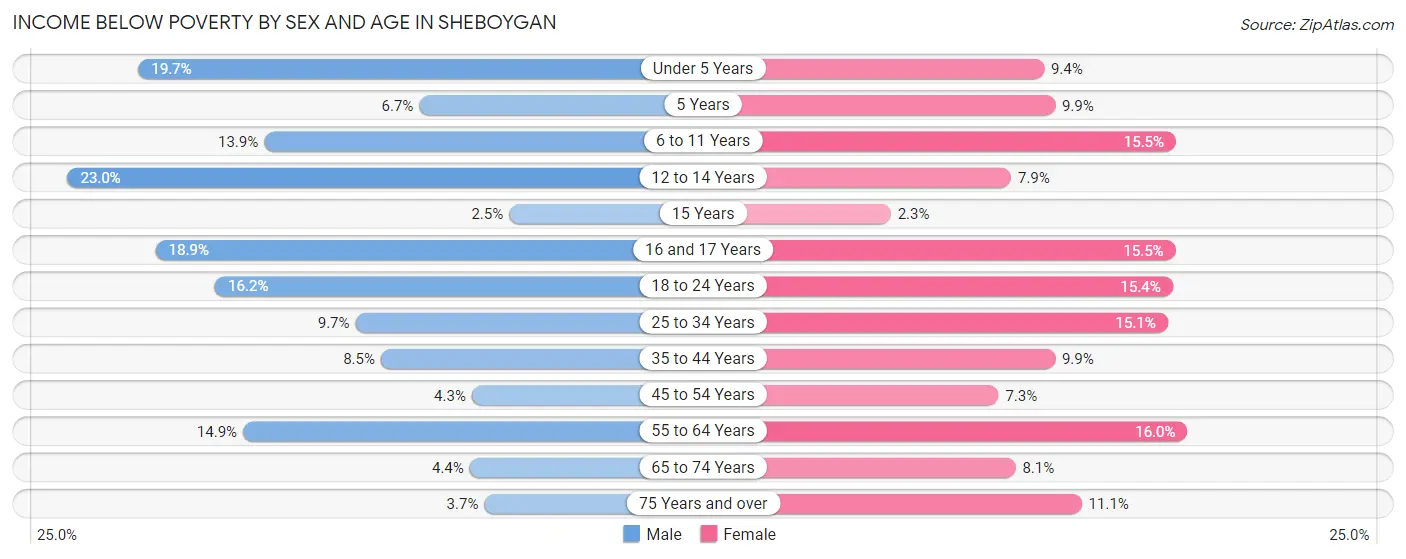
| Age Bracket | Male | Female |
| Under 5 Years | 336 (19.7%) | 160 (9.4%) |
| 5 Years | 22 (6.7%) | 45 (9.9%) |
| 6 to 11 Years | 282 (13.9%) | 240 (15.5%) |
| 12 to 14 Years | 257 (23.0%) | 79 (7.9%) |
| 15 Years | 11 (2.5%) | 9 (2.3%) |
| 16 and 17 Years | 140 (18.9%) | 78 (15.5%) |
| 18 to 24 Years | 369 (16.2%) | 325 (15.3%) |
| 25 to 34 Years | 306 (9.7%) | 521 (15.1%) |
| 35 to 44 Years | 301 (8.5%) | 338 (9.9%) |
| 45 to 54 Years | 126 (4.3%) | 208 (7.3%) |
| 55 to 64 Years | 488 (14.9%) | 421 (16.0%) |
| 65 to 74 Years | 97 (4.3%) | 169 (8.1%) |
| 75 Years and over | 44 (3.7%) | 197 (11.1%) |
| Total | 2,779 (11.1%) | 2,790 (11.7%) |
Income Above Poverty by Sex and Age in Sheboygan
According to the poverty statistics in Sheboygan, males aged 15 years and females aged 15 years are the age groups that are most secure financially, with 97.5% of males and 97.7% of females in these age groups living above the poverty line.
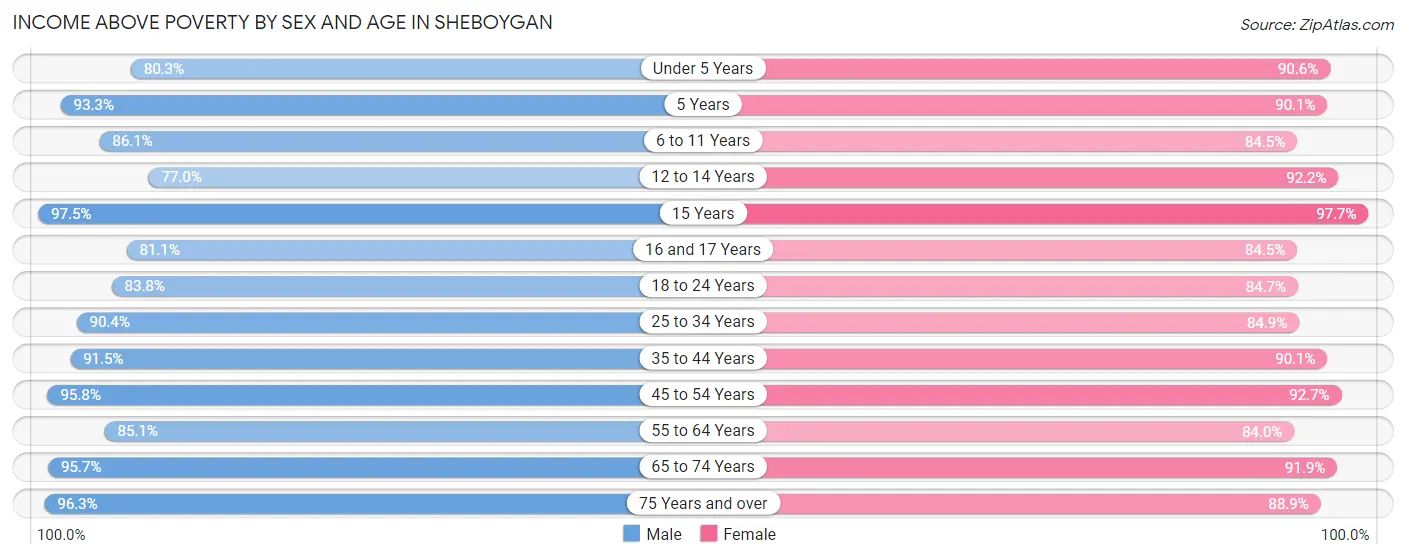
| Age Bracket | Male | Female |
| Under 5 Years | 1,368 (80.3%) | 1,545 (90.6%) |
| 5 Years | 307 (93.3%) | 410 (90.1%) |
| 6 to 11 Years | 1,748 (86.1%) | 1,308 (84.5%) |
| 12 to 14 Years | 860 (77.0%) | 928 (92.1%) |
| 15 Years | 426 (97.5%) | 387 (97.7%) |
| 16 and 17 Years | 600 (81.1%) | 426 (84.5%) |
| 18 to 24 Years | 1,915 (83.8%) | 1,792 (84.7%) |
| 25 to 34 Years | 2,864 (90.3%) | 2,924 (84.9%) |
| 35 to 44 Years | 3,254 (91.5%) | 3,078 (90.1%) |
| 45 to 54 Years | 2,837 (95.8%) | 2,654 (92.7%) |
| 55 to 64 Years | 2,793 (85.1%) | 2,206 (84.0%) |
| 65 to 74 Years | 2,135 (95.7%) | 1,927 (91.9%) |
| 75 Years and over | 1,155 (96.3%) | 1,573 (88.9%) |
| Total | 22,262 (88.9%) | 21,158 (88.3%) |
Income Below Poverty Among Married-Couple Families in Sheboygan
The poverty statistics for married-couple families in Sheboygan show that 3.8% or 312 of the total 8,174 families live below the poverty line. Families with 5 or more children have the highest poverty rate of 28.2%, comprising of 76 families. On the other hand, families with no children have the lowest poverty rate of 2.3%, which includes 110 families.
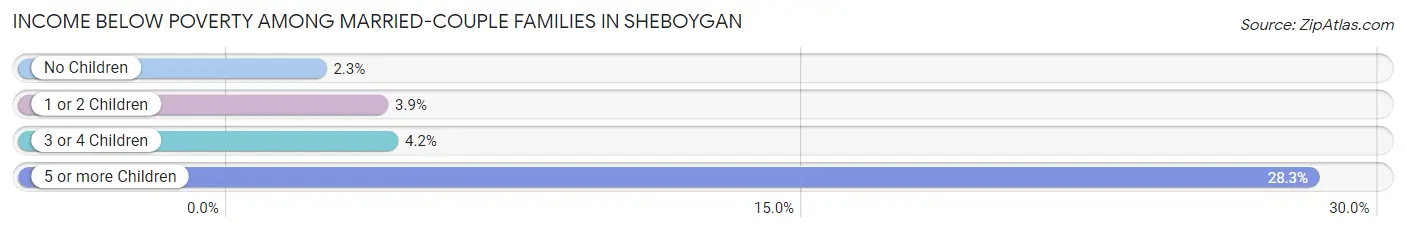
| Children | Above Poverty | Below Poverty |
| No Children | 4,649 (97.7%) | 110 (2.3%) |
| 1 or 2 Children | 2,012 (96.1%) | 82 (3.9%) |
| 3 or 4 Children | 1,008 (95.8%) | 44 (4.2%) |
| 5 or more Children | 193 (71.8%) | 76 (28.2%) |
| Total | 7,862 (96.2%) | 312 (3.8%) |
Income Below Poverty Among Single-Parent Households in Sheboygan
According to the poverty data in Sheboygan, 9.3% or 87 single-father households and 22.4% or 534 single-mother households are living below the poverty line. Among single-father households, those with 1 or 2 children have the highest poverty rate, with 63 households (10.3%) experiencing poverty. Likewise, among single-mother households, those with 3 or 4 children have the highest poverty rate, with 119 households (34.5%) falling below the poverty line.
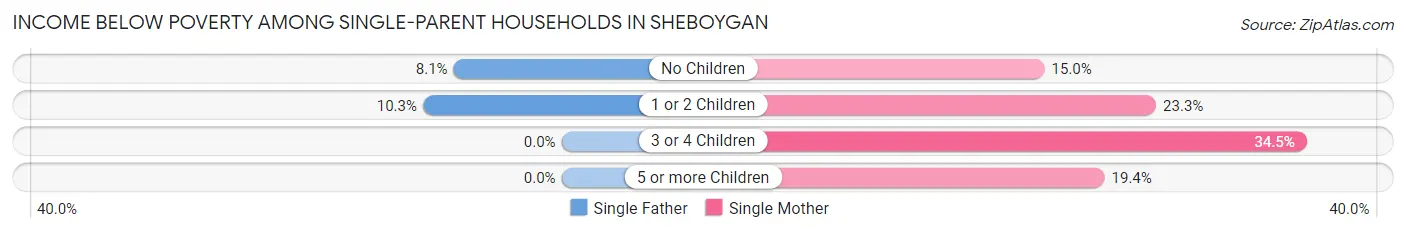
| Children | Single Father | Single Mother |
| No Children | 24 (8.1%) | 107 (15.0%) |
| 1 or 2 Children | 63 (10.3%) | 301 (23.3%) |
| 3 or 4 Children | 0 (0.0%) | 119 (34.5%) |
| 5 or more Children | 0 (0.0%) | 7 (19.4%) |
| Total | 87 (9.3%) | 534 (22.4%) |
Income Below Poverty Among Married-Couple vs Single-Parent Households in Sheboygan
The poverty data for Sheboygan shows that 312 of the married-couple family households (3.8%) and 621 of the single-parent households (18.7%) are living below the poverty level. Within the married-couple family households, those with 5 or more children have the highest poverty rate, with 76 households (28.2%) falling below the poverty line. Among the single-parent households, those with 3 or 4 children have the highest poverty rate, with 119 household (33.7%) living below poverty.
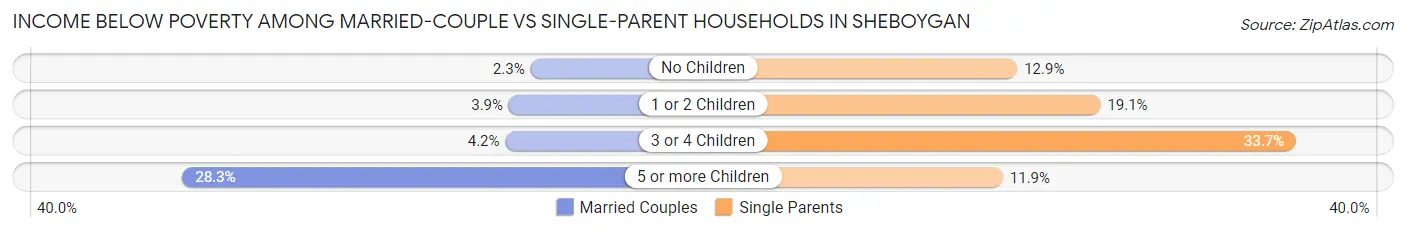
| Children | Married-Couple Families | Single-Parent Households |
| No Children | 110 (2.3%) | 131 (12.9%) |
| 1 or 2 Children | 82 (3.9%) | 364 (19.1%) |
| 3 or 4 Children | 44 (4.2%) | 119 (33.7%) |
| 5 or more Children | 76 (28.2%) | 7 (11.9%) |
| Total | 312 (3.8%) | 621 (18.7%) |
Race in Sheboygan
The most populous races in Sheboygan are White / Caucasian (37,399 | 75.1%), Asian (6,057 | 12.2%), and Hispanic or Latino (5,922 | 11.9%).
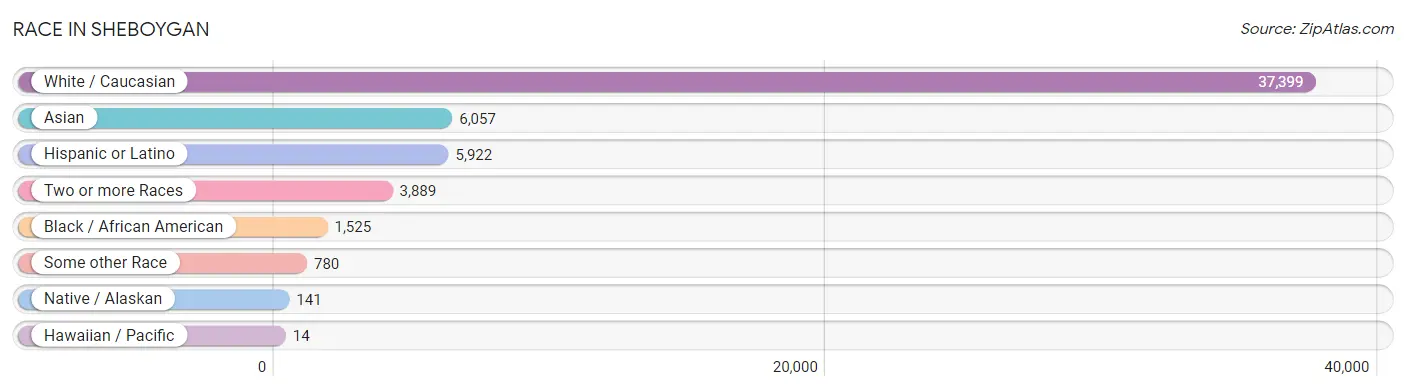
| Race | # Population | % Population |
| Asian | 6,057 | 12.2% |
| Black / African American | 1,525 | 3.1% |
| Hawaiian / Pacific | 14 | 0.0% |
| Hispanic or Latino | 5,922 | 11.9% |
| Native / Alaskan | 141 | 0.3% |
| White / Caucasian | 37,399 | 75.1% |
| Two or more Races | 3,889 | 7.8% |
| Some other Race | 780 | 1.6% |
| Total | 49,805 | 100.0% |
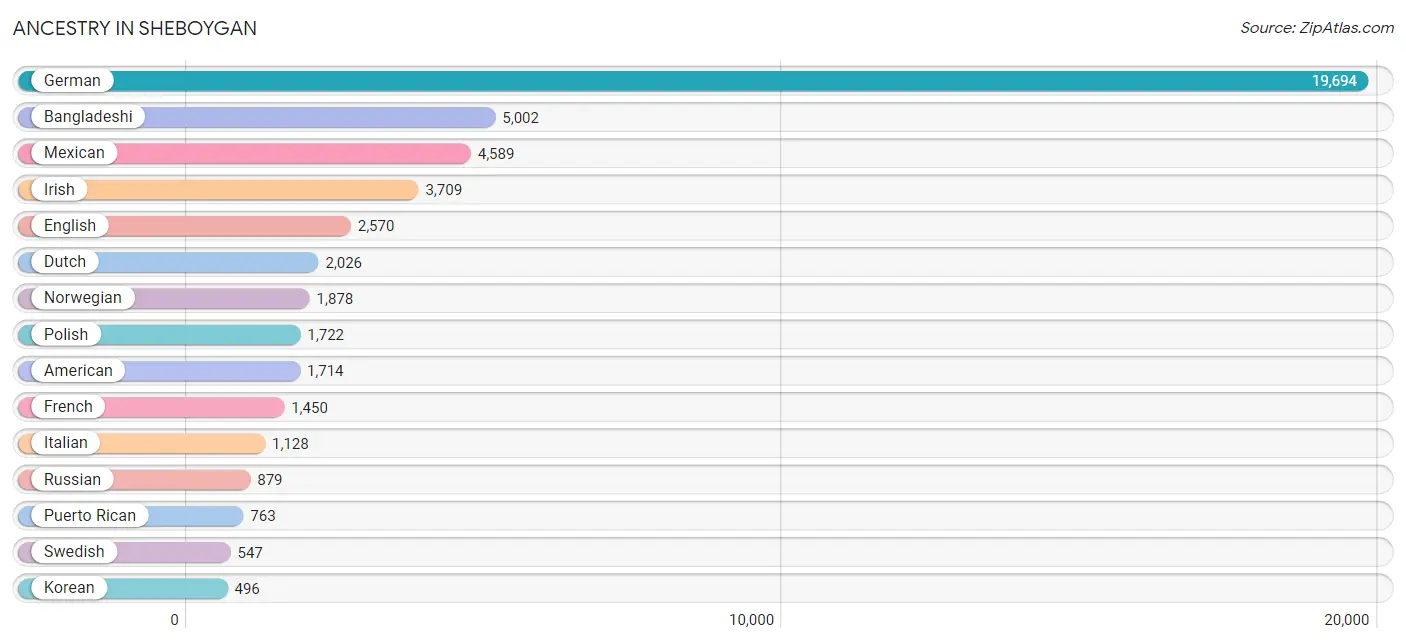
Ancestry in Sheboygan
The most populous ancestries reported in Sheboygan are German (19,694 | 39.5%), Bangladeshi (5,002 | 10.0%), Mexican (4,589 | 9.2%), Irish (3,709 | 7.4%), and English (2,570 | 5.2%), together accounting for 71.4% of all Sheboygan residents.
| Ancestry | # Population | % Population |
| African | 129 | 0.3% |
| Alaska Native | 8 | 0.0% |
| Albanian | 323 | 0.6% |
| American | 1,714 | 3.4% |
| Arab | 58 | 0.1% |
| Australian | 24 | 0.1% |
| Austrian | 188 | 0.4% |
| Bangladeshi | 5,002 | 10.0% |
| Belgian | 194 | 0.4% |
| Belizean | 6 | 0.0% |
| Bhutanese | 107 | 0.2% |
| Blackfeet | 58 | 0.1% |
| British | 199 | 0.4% |
| Bulgarian | 8 | 0.0% |
| Burmese | 93 | 0.2% |
| Canadian | 27 | 0.1% |
| Central American | 187 | 0.4% |
| Cherokee | 39 | 0.1% |
| Chilean | 35 | 0.1% |
| Chippewa | 97 | 0.2% |
| Choctaw | 13 | 0.0% |
| Colombian | 44 | 0.1% |
| Costa Rican | 48 | 0.1% |
| Cree | 30 | 0.1% |
| Creek | 5 | 0.0% |
| Croatian | 304 | 0.6% |
| Cuban | 9 | 0.0% |
| Czech | 225 | 0.4% |
| Danish | 113 | 0.2% |
| Dominican | 14 | 0.0% |
| Dutch | 2,026 | 4.1% |
| Eastern European | 41 | 0.1% |
| English | 2,570 | 5.2% |
| European | 450 | 0.9% |
| Finnish | 213 | 0.4% |
| French | 1,450 | 2.9% |
| French Canadian | 119 | 0.2% |
| German | 19,694 | 39.5% |
| Greek | 180 | 0.4% |
| Guatemalan | 57 | 0.1% |
| Hungarian | 160 | 0.3% |
| Icelander | 66 | 0.1% |
| Indian (Asian) | 288 | 0.6% |
| Irish | 3,709 | 7.4% |
| Iroquois | 56 | 0.1% |
| Italian | 1,128 | 2.3% |
| Jamaican | 112 | 0.2% |
| Japanese | 62 | 0.1% |
| Jordanian | 42 | 0.1% |
| Kenyan | 13 | 0.0% |
| Korean | 496 | 1.0% |
| Laotian | 11 | 0.0% |
| Lebanese | 16 | 0.0% |
| Lithuanian | 219 | 0.4% |
| Luxembourger | 26 | 0.1% |
| Malaysian | 62 | 0.1% |
| Menominee | 38 | 0.1% |
| Mexican | 4,589 | 9.2% |
| Native Hawaiian | 14 | 0.0% |
| Nicaraguan | 48 | 0.1% |
| Northern European | 31 | 0.1% |
| Norwegian | 1,878 | 3.8% |
| Pakistani | 32 | 0.1% |
| Panamanian | 22 | 0.0% |
| Pennsylvania German | 85 | 0.2% |
| Peruvian | 11 | 0.0% |
| Polish | 1,722 | 3.5% |
| Portuguese | 109 | 0.2% |
| Potawatomi | 38 | 0.1% |
| Puerto Rican | 763 | 1.5% |
| Romanian | 69 | 0.1% |
| Russian | 879 | 1.8% |
| Salvadoran | 12 | 0.0% |
| Scandinavian | 175 | 0.4% |
| Scotch-Irish | 229 | 0.5% |
| Scottish | 405 | 0.8% |
| Serbian | 42 | 0.1% |
| Sioux | 15 | 0.0% |
| Slavic | 7 | 0.0% |
| Slovak | 84 | 0.2% |
| Slovene | 404 | 0.8% |
| South American | 129 | 0.3% |
| Spaniard | 16 | 0.0% |
| Spanish | 78 | 0.2% |
| Sri Lankan | 21 | 0.0% |
| Subsaharan African | 142 | 0.3% |
| Swedish | 547 | 1.1% |
| Swiss | 190 | 0.4% |
| Thai | 143 | 0.3% |
| Ukrainian | 10 | 0.0% |
| Venezuelan | 39 | 0.1% |
| Welsh | 84 | 0.2% |
| Yugoslavian | 185 | 0.4% | View All 93 Rows |
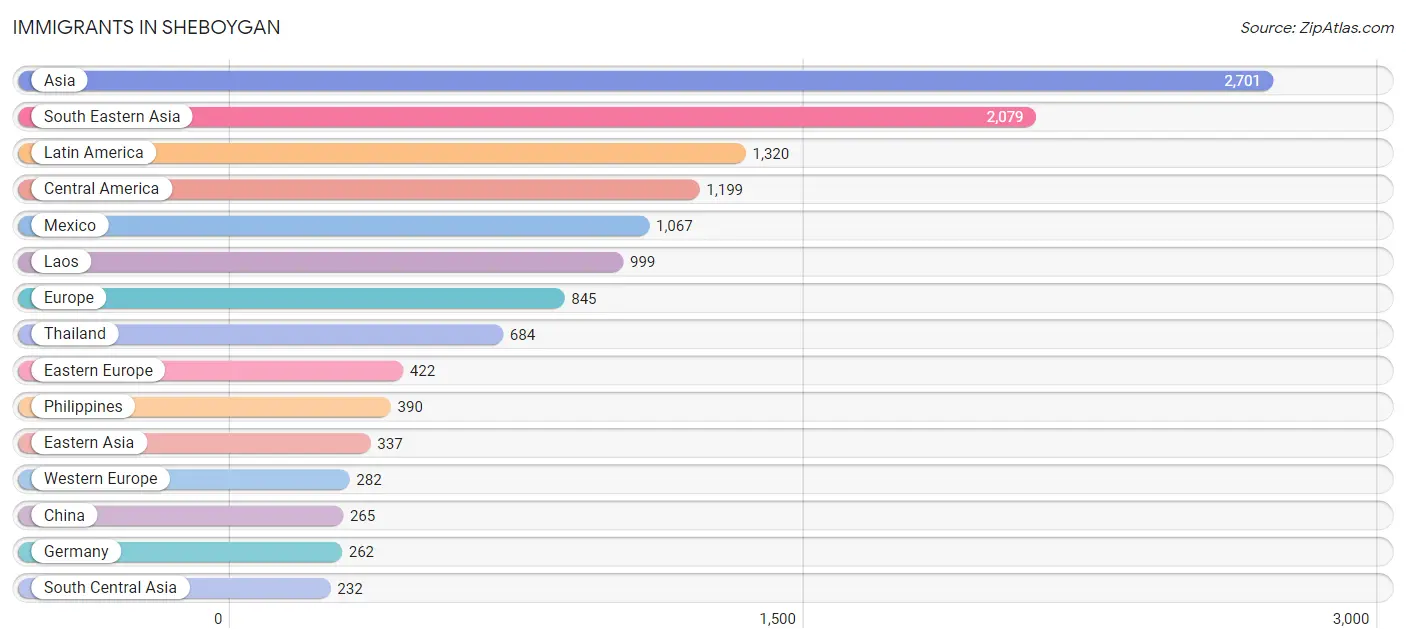
Immigrants in Sheboygan
The most numerous immigrant groups reported in Sheboygan came from Asia (2,701 | 5.4%), South Eastern Asia (2,079 | 4.2%), Latin America (1,320 | 2.6%), Central America (1,199 | 2.4%), and Mexico (1,067 | 2.1%), together accounting for 16.8% of all Sheboygan residents.
| Immigration Origin | # Population | % Population |
| Africa | 38 | 0.1% |
| Albania | 34 | 0.1% |
| Asia | 2,701 | 5.4% |
| Australia | 74 | 0.2% |
| Austria | 13 | 0.0% |
| Bosnia and Herzegovina | 37 | 0.1% |
| Canada | 35 | 0.1% |
| Caribbean | 46 | 0.1% |
| Central America | 1,199 | 2.4% |
| China | 265 | 0.5% |
| Colombia | 17 | 0.0% |
| Eastern Africa | 13 | 0.0% |
| Eastern Asia | 337 | 0.7% |
| Eastern Europe | 422 | 0.9% |
| England | 36 | 0.1% |
| Europe | 845 | 1.7% |
| Germany | 262 | 0.5% |
| Greece | 47 | 0.1% |
| Guatemala | 48 | 0.1% |
| Hong Kong | 12 | 0.0% |
| India | 199 | 0.4% |
| Iraq | 11 | 0.0% |
| Ireland | 8 | 0.0% |
| Jamaica | 46 | 0.1% |
| Japan | 16 | 0.0% |
| Jordan | 42 | 0.1% |
| Kenya | 13 | 0.0% |
| Korea | 56 | 0.1% |
| Laos | 999 | 2.0% |
| Latin America | 1,320 | 2.6% |
| Mexico | 1,067 | 2.1% |
| Moldova | 17 | 0.0% |
| Morocco | 24 | 0.1% |
| Netherlands | 7 | 0.0% |
| Nicaragua | 48 | 0.1% |
| North Macedonia | 124 | 0.3% |
| Northern Africa | 24 | 0.1% |
| Northern Europe | 94 | 0.2% |
| Oceania | 74 | 0.2% |
| Pakistan | 33 | 0.1% |
| Panama | 36 | 0.1% |
| Peru | 11 | 0.0% |
| Philippines | 390 | 0.8% |
| Russia | 30 | 0.1% |
| South Africa | 1 | 0.0% |
| South America | 75 | 0.2% |
| South Central Asia | 232 | 0.5% |
| South Eastern Asia | 2,079 | 4.2% |
| Southern Europe | 47 | 0.1% |
| Thailand | 684 | 1.4% |
| Venezuela | 47 | 0.1% |
| Vietnam | 6 | 0.0% |
| Western Asia | 53 | 0.1% |
| Western Europe | 282 | 0.6% | View All 54 Rows |
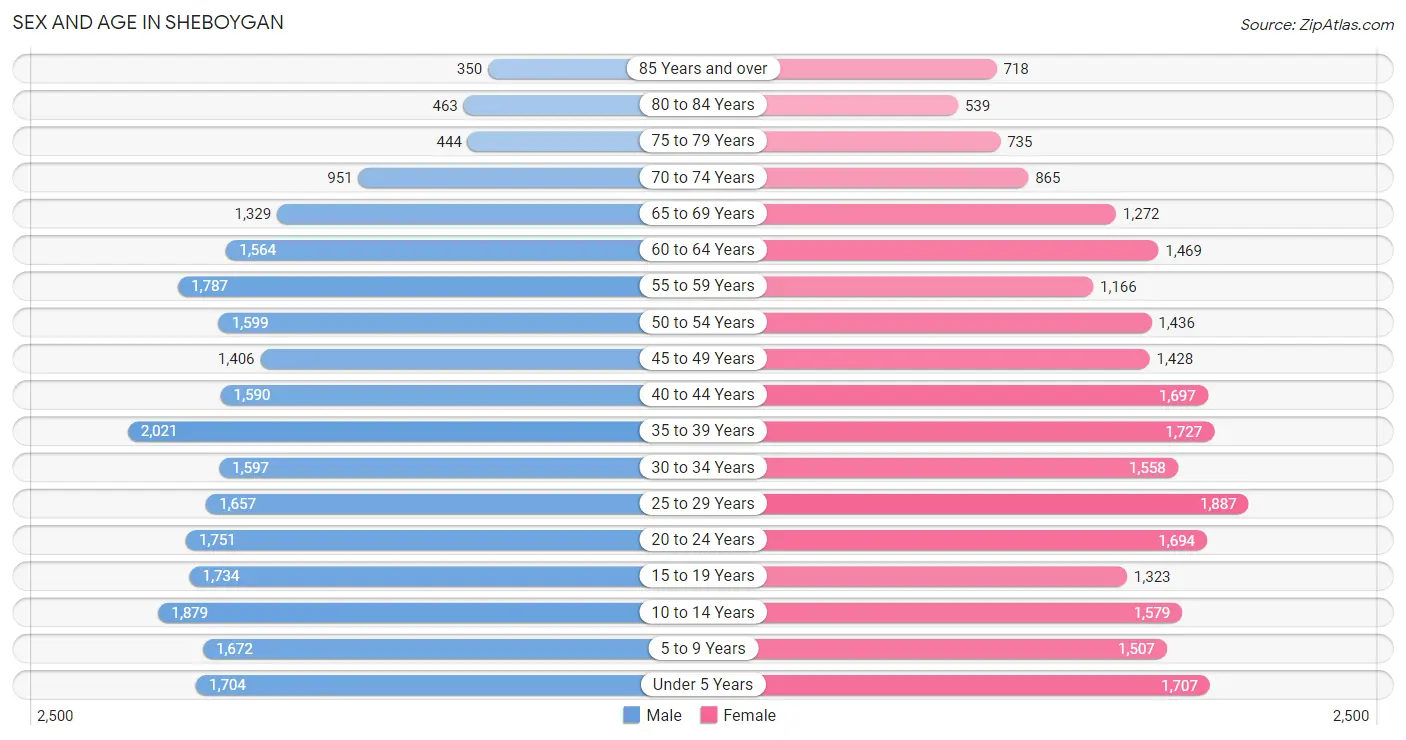
Sex and Age in Sheboygan
Sex and Age in Sheboygan
The most populous age groups in Sheboygan are 35 to 39 Years (2,021 | 7.9%) for men and 25 to 29 Years (1,887 | 7.8%) for women.
| Age Bracket | Male | Female |
| Under 5 Years | 1,704 (6.7%) | 1,707 (7.0%) |
| 5 to 9 Years | 1,672 (6.6%) | 1,507 (6.2%) |
| 10 to 14 Years | 1,879 (7.4%) | 1,579 (6.5%) |
| 15 to 19 Years | 1,734 (6.8%) | 1,323 (5.4%) |
| 20 to 24 Years | 1,751 (6.9%) | 1,694 (7.0%) |
| 25 to 29 Years | 1,657 (6.5%) | 1,887 (7.8%) |
| 30 to 34 Years | 1,597 (6.3%) | 1,558 (6.4%) |
| 35 to 39 Years | 2,021 (7.9%) | 1,727 (7.1%) |
| 40 to 44 Years | 1,590 (6.2%) | 1,697 (7.0%) |
| 45 to 49 Years | 1,406 (5.5%) | 1,428 (5.9%) |
| 50 to 54 Years | 1,599 (6.3%) | 1,436 (5.9%) |
| 55 to 59 Years | 1,787 (7.0%) | 1,166 (4.8%) |
| 60 to 64 Years | 1,564 (6.1%) | 1,469 (6.0%) |
| 65 to 69 Years | 1,329 (5.2%) | 1,272 (5.2%) |
| 70 to 74 Years | 951 (3.7%) | 865 (3.6%) |
| 75 to 79 Years | 444 (1.7%) | 735 (3.0%) |
| 80 to 84 Years | 463 (1.8%) | 539 (2.2%) |
| 85 Years and over | 350 (1.4%) | 718 (2.9%) |
| Total | 25,498 (100.0%) | 24,307 (100.0%) |
Families and Households in Sheboygan
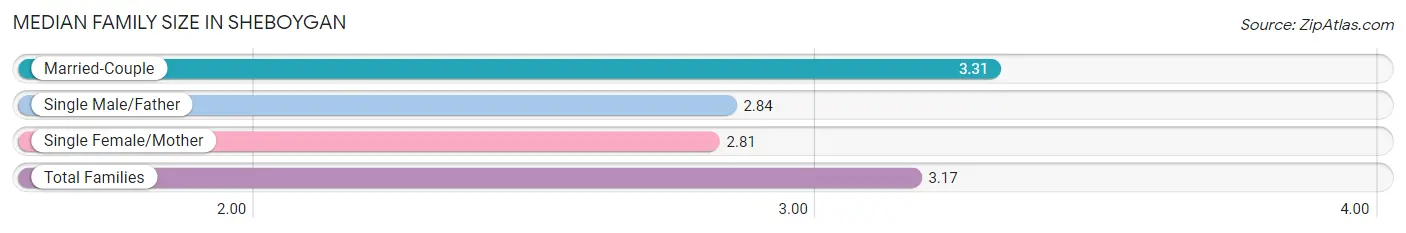
Median Family Size in Sheboygan
The median family size in Sheboygan is 3.17 persons per family, with married-couple families (8,174 | 71.1%) accounting for the largest median family size of 3.31 persons per family. On the other hand, single female/mother families (2,389 | 20.8%) represent the smallest median family size with 2.81 persons per family.
| Family Type | # Families | Family Size |
| Married-Couple | 8,174 (71.1%) | 3.31 |
| Single Male/Father | 939 (8.2%) | 2.84 |
| Single Female/Mother | 2,389 (20.8%) | 2.81 |
| Total Families | 11,502 (100.0%) | 3.17 |
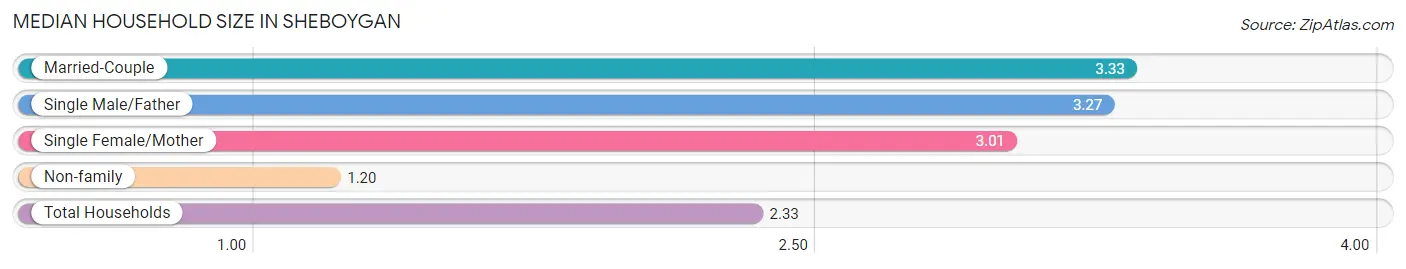
Median Household Size in Sheboygan
The median household size in Sheboygan is 2.33 persons per household, with married-couple households (8,174 | 38.8%) accounting for the largest median household size of 3.33 persons per household. non-family households (9,544 | 45.4%) represent the smallest median household size with 1.20 persons per household.
| Household Type | # Households | Household Size |
| Married-Couple | 8,174 (38.8%) | 3.33 |
| Single Male/Father | 939 (4.5%) | 3.27 |
| Single Female/Mother | 2,389 (11.4%) | 3.01 |
| Non-family | 9,544 (45.4%) | 1.20 |
| Total Households | 21,046 (100.0%) | 2.33 |
Household Size by Marriage Status in Sheboygan
Out of a total of 21,046 households in Sheboygan, 11,502 (54.6%) are family households, while 9,544 (45.4%) are nonfamily households. The most numerous type of family households are 2-person households, comprising 5,253, and the most common type of nonfamily households are 1-person households, comprising 7,760.
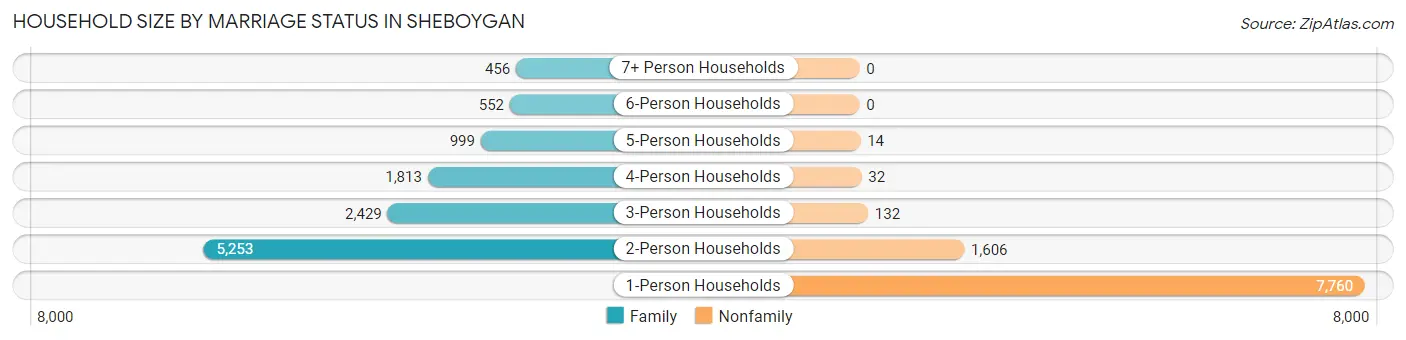
| Household Size | Family Households | Nonfamily Households |
| 1-Person Households | - | 7,760 (36.9%) |
| 2-Person Households | 5,253 (25.0%) | 1,606 (7.6%) |
| 3-Person Households | 2,429 (11.5%) | 132 (0.6%) |
| 4-Person Households | 1,813 (8.6%) | 32 (0.2%) |
| 5-Person Households | 999 (4.8%) | 14 (0.1%) |
| 6-Person Households | 552 (2.6%) | 0 (0.0%) |
| 7+ Person Households | 456 (2.2%) | 0 (0.0%) |
| Total | 11,502 (54.6%) | 9,544 (45.4%) |
Female Fertility in Sheboygan
Fertility by Age in Sheboygan
Average fertility rate in Sheboygan is 66.0 births per 1,000 women. Women in the age bracket of 20 to 34 years have the highest fertility rate with 100.0 births per 1,000 women. Women in the age bracket of 20 to 34 years acount for 66.9% of all women with births.
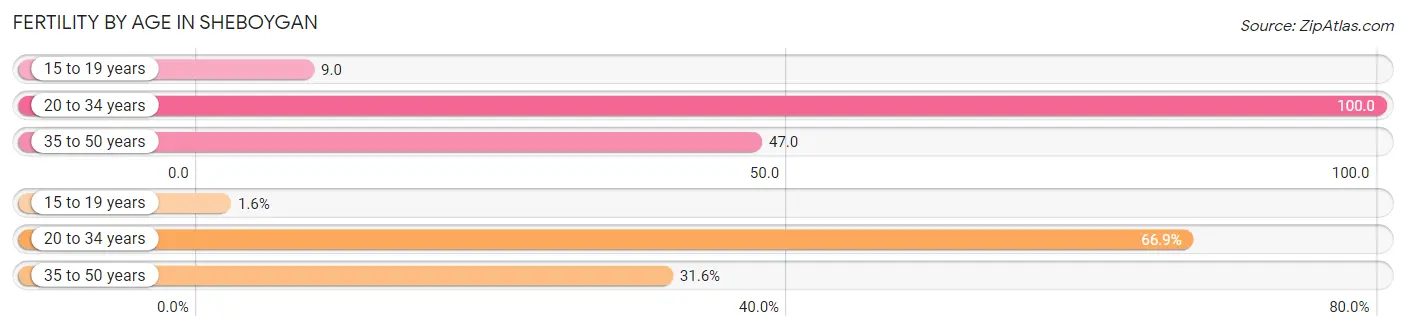
| Age Bracket | Women with Births | Births / 1,000 Women |
| 15 to 19 years | 12 (1.6%) | 9.0 |
| 20 to 34 years | 513 (66.9%) | 100.0 |
| 35 to 50 years | 242 (31.6%) | 47.0 |
| Total | 767 (100.0%) | 66.0 |
Fertility by Age by Marriage Status in Sheboygan
76.7% of women with births (767) in Sheboygan are married. The highest percentage of unmarried women with births falls into 15 to 19 years age bracket with 100.0% of them unmarried at the time of birth, while the lowest percentage of unmarried women with births belong to 35 to 50 years age bracket with 7.4% of them unmarried.
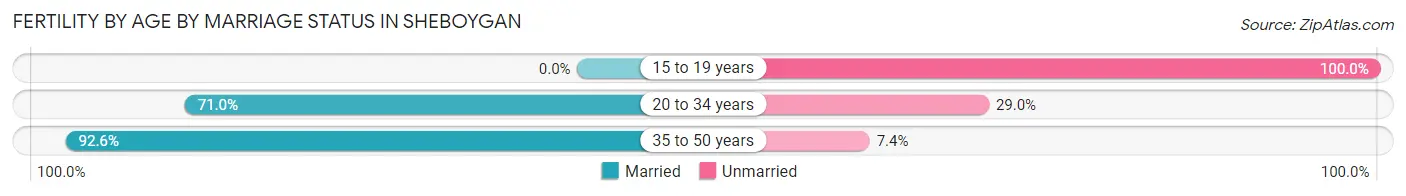
| Age Bracket | Married | Unmarried |
| 15 to 19 years | 0 (0.0%) | 12 (100.0%) |
| 20 to 34 years | 364 (71.0%) | 149 (29.0%) |
| 35 to 50 years | 224 (92.6%) | 18 (7.4%) |
| Total | 588 (76.7%) | 179 (23.3%) |
Fertility by Education in Sheboygan
Average fertility rate in Sheboygan is 66.0 births per 1,000 women. Women with the education attainment of bachelor's degree have the highest fertility rate of 85.0 births per 1,000 women, while women with the education attainment of graduate degree have the lowest fertility at 23.0 births per 1,000 women. Women with the education attainment of college or associate's degree represent 41.7% of all women with births.
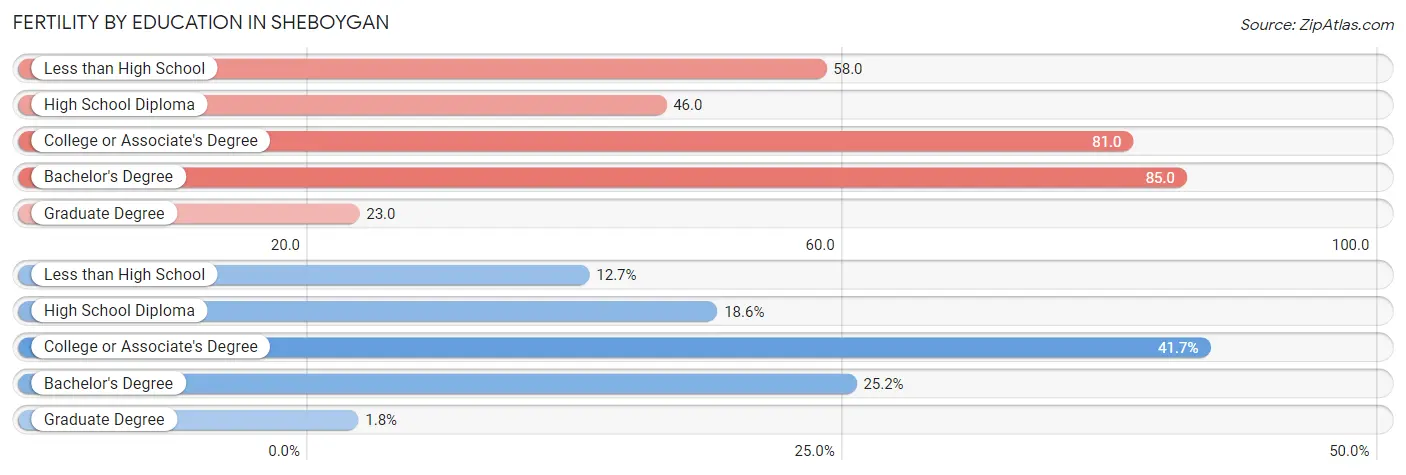
| Educational Attainment | Women with Births | Births / 1,000 Women |
| Less than High School | 97 (12.7%) | 58.0 |
| High School Diploma | 143 (18.6%) | 46.0 |
| College or Associate's Degree | 320 (41.7%) | 81.0 |
| Bachelor's Degree | 193 (25.2%) | 85.0 |
| Graduate Degree | 14 (1.8%) | 23.0 |
| Total | 767 (100.0%) | 66.0 |
Fertility by Education by Marriage Status in Sheboygan
23.3% of women with births in Sheboygan are unmarried. Women with the educational attainment of graduate degree are most likely to be married with 100.0% of them married at childbirth, while women with the educational attainment of less than high school are least likely to be married with 45.4% of them unmarried at childbirth.
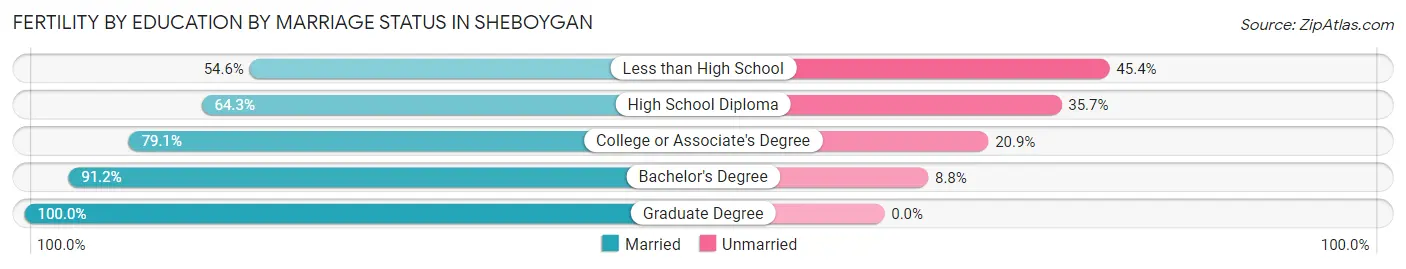
| Educational Attainment | Married | Unmarried |
| Less than High School | 53 (54.6%) | 44 (45.4%) |
| High School Diploma | 92 (64.3%) | 51 (35.7%) |
| College or Associate's Degree | 253 (79.1%) | 67 (20.9%) |
| Bachelor's Degree | 176 (91.2%) | 17 (8.8%) |
| Graduate Degree | 14 (100.0%) | 0 (0.0%) |
| Total | 588 (76.7%) | 179 (23.3%) |
Employment Characteristics in Sheboygan
Employment by Class of Employer in Sheboygan
Among the 25,229 employed individuals in Sheboygan, private company employees (19,793 | 78.4%), not-for-profit organizations (2,003 | 7.9%), and local government employees (1,383 | 5.5%) make up the most common classes of employment.
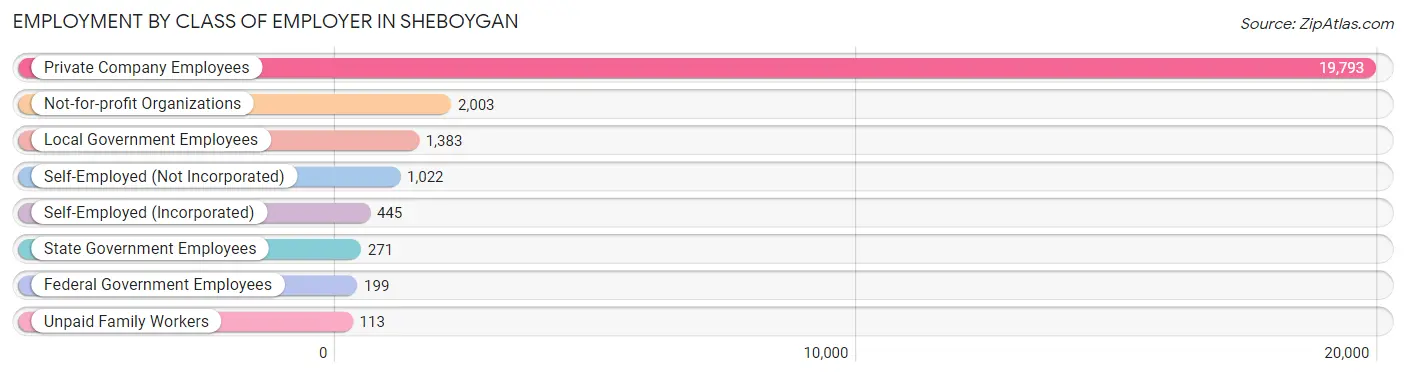
| Employer Class | # Employees | % Employees |
| Private Company Employees | 19,793 | 78.4% |
| Self-Employed (Incorporated) | 445 | 1.8% |
| Self-Employed (Not Incorporated) | 1,022 | 4.1% |
| Not-for-profit Organizations | 2,003 | 7.9% |
| Local Government Employees | 1,383 | 5.5% |
| State Government Employees | 271 | 1.1% |
| Federal Government Employees | 199 | 0.8% |
| Unpaid Family Workers | 113 | 0.4% |
| Total | 25,229 | 100.0% |
Employment Status by Age in Sheboygan
According to the labor force statistics for Sheboygan, out of the total population over 16 years of age (38,918), 68.2% or 26,542 individuals are in the labor force, with 3.4% or 902 of them unemployed. The age group with the highest labor force participation rate is 25 to 29 years, with 89.3% or 3,165 individuals in the labor force. Within the labor force, the 16 to 19 years age range has the highest percentage of unemployed individuals, with 10.9% or 143 of them being unemployed.
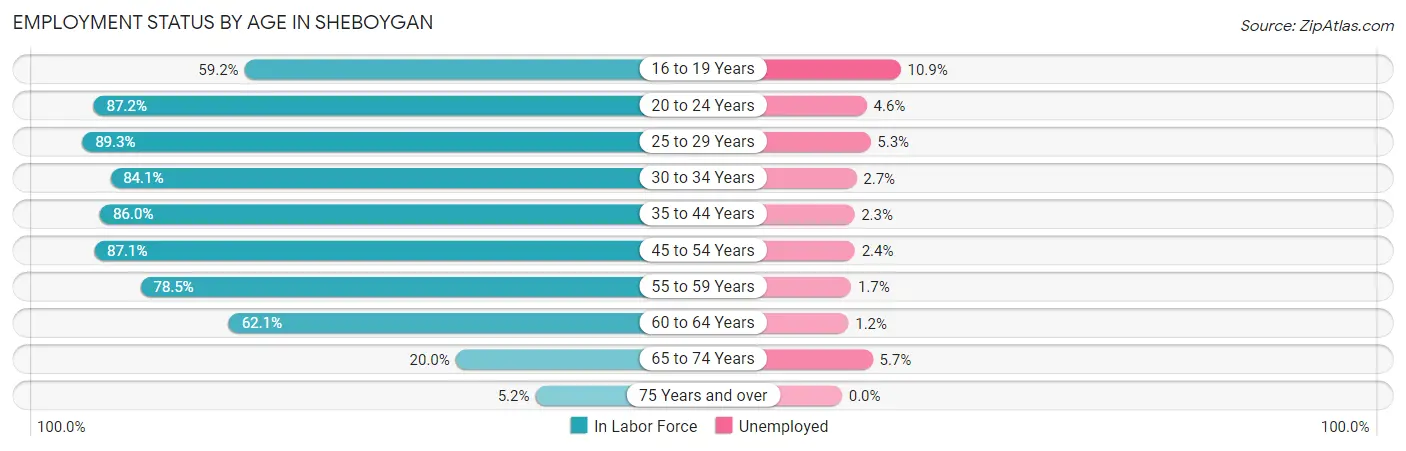
| Age Bracket | In Labor Force | Unemployed |
| 16 to 19 Years | 1,313 (59.2%) | 143 (10.9%) |
| 20 to 24 Years | 3,004 (87.2%) | 138 (4.6%) |
| 25 to 29 Years | 3,165 (89.3%) | 168 (5.3%) |
| 30 to 34 Years | 2,653 (84.1%) | 72 (2.7%) |
| 35 to 44 Years | 6,050 (86.0%) | 139 (2.3%) |
| 45 to 54 Years | 5,112 (87.1%) | 123 (2.4%) |
| 55 to 59 Years | 2,318 (78.5%) | 39 (1.7%) |
| 60 to 64 Years | 1,883 (62.1%) | 23 (1.2%) |
| 65 to 74 Years | 883 (20.0%) | 50 (5.7%) |
| 75 Years and over | 169 (5.2%) | 0 (0.0%) |
| Total | 26,542 (68.2%) | 902 (3.4%) |
Employment Status by Educational Attainment in Sheboygan
According to labor force statistics for Sheboygan, 82.8% of individuals (21,188) out of the total population between 25 and 64 years of age (25,589) are in the labor force, with 2.7% or 572 of them being unemployed. The group with the highest labor force participation rate are those with the educational attainment of bachelor's degree or higher, with 89.7% or 5,431 individuals in the labor force. Within the labor force, individuals with high school diploma education have the highest percentage of unemployment, with 4.5% or 296 of them being unemployed.
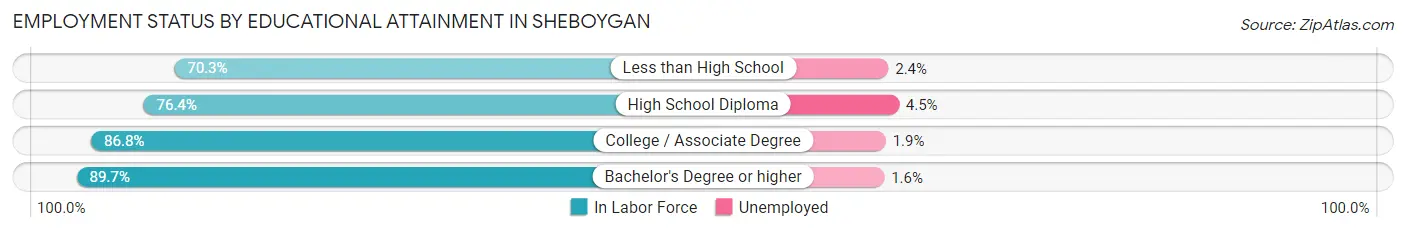
| Educational Attainment | In Labor Force | Unemployed |
| Less than High School | 1,364 (70.3%) | 47 (2.4%) |
| High School Diploma | 6,577 (76.4%) | 387 (4.5%) |
| College / Associate Degree | 7,800 (86.8%) | 171 (1.9%) |
| Bachelor's Degree or higher | 5,431 (89.7%) | 97 (1.6%) |
| Total | 21,188 (82.8%) | 691 (2.7%) |
Employment Occupations by Sex in Sheboygan
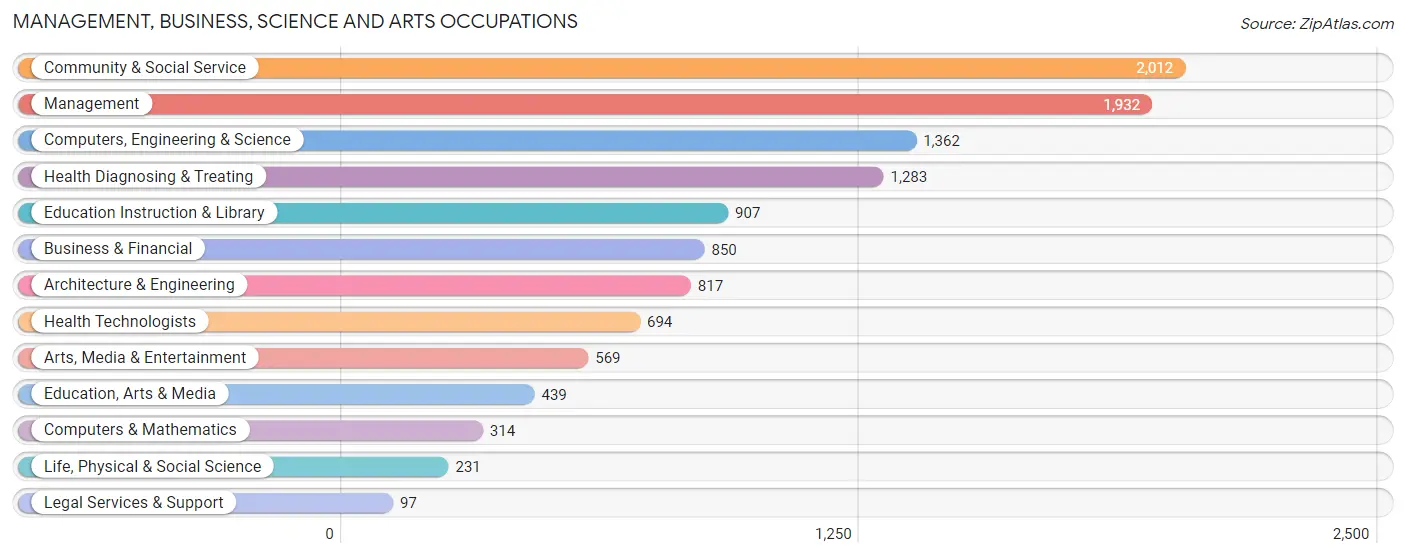
Management, Business, Science and Arts Occupations
The most common Management, Business, Science and Arts occupations in Sheboygan are Community & Social Service (2,012 | 7.9%), Management (1,932 | 7.5%), Computers, Engineering & Science (1,362 | 5.3%), Health Diagnosing & Treating (1,283 | 5.0%), and Education Instruction & Library (907 | 3.5%).
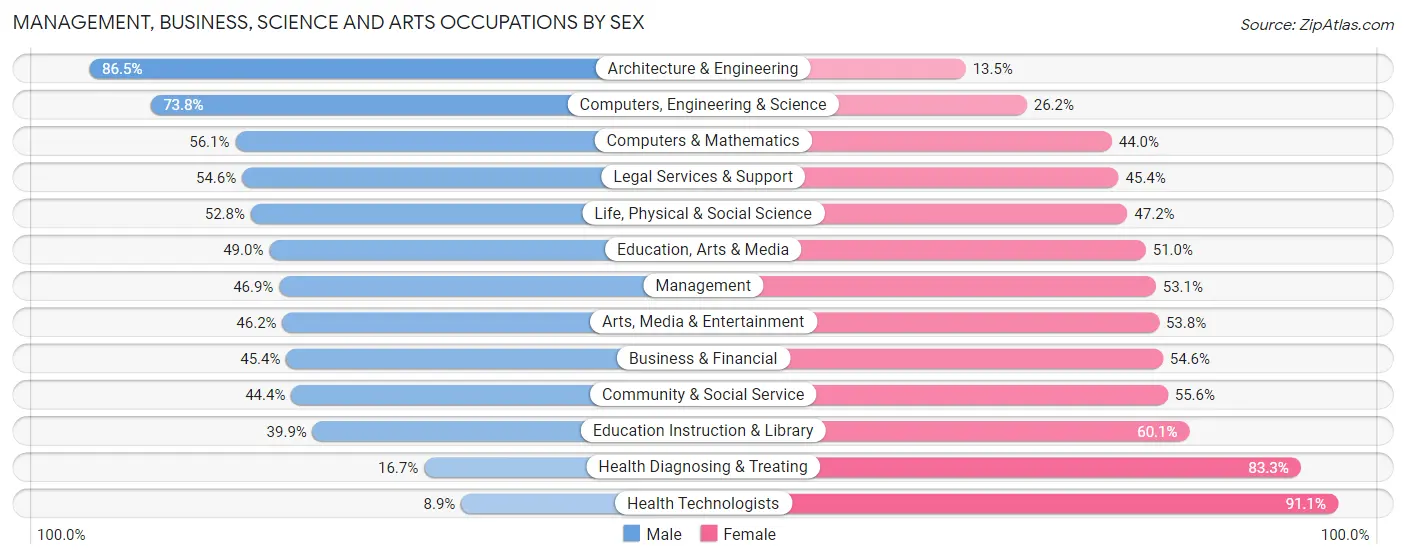
Management, Business, Science and Arts Occupations by Sex
Within the Management, Business, Science and Arts occupations in Sheboygan, the most male-oriented occupations are Architecture & Engineering (86.5%), Computers, Engineering & Science (73.8%), and Computers & Mathematics (56.0%), while the most female-oriented occupations are Health Technologists (91.1%), Health Diagnosing & Treating (83.3%), and Education Instruction & Library (60.1%).
| Occupation | Male | Female |
| Management | 906 (46.9%) | 1,026 (53.1%) |
| Business & Financial | 386 (45.4%) | 464 (54.6%) |
| Computers, Engineering & Science | 1,005 (73.8%) | 357 (26.2%) |
| Computers & Mathematics | 176 (56.0%) | 138 (44.0%) |
| Architecture & Engineering | 707 (86.5%) | 110 (13.5%) |
| Life, Physical & Social Science | 122 (52.8%) | 109 (47.2%) |
| Community & Social Service | 893 (44.4%) | 1,119 (55.6%) |
| Education, Arts & Media | 215 (49.0%) | 224 (51.0%) |
| Legal Services & Support | 53 (54.6%) | 44 (45.4%) |
| Education Instruction & Library | 362 (39.9%) | 545 (60.1%) |
| Arts, Media & Entertainment | 263 (46.2%) | 306 (53.8%) |
| Health Diagnosing & Treating | 214 (16.7%) | 1,069 (83.3%) |
| Health Technologists | 62 (8.9%) | 632 (91.1%) |
| Total (Category) | 3,404 (45.8%) | 4,035 (54.2%) |
| Total (Overall) | 13,637 (53.2%) | 11,992 (46.8%) |
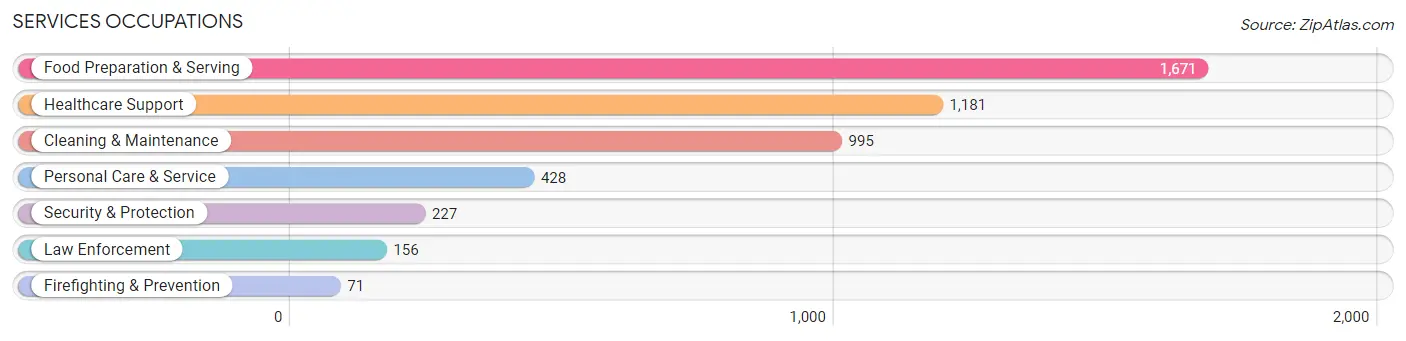
Services Occupations
The most common Services occupations in Sheboygan are Food Preparation & Serving (1,671 | 6.5%), Healthcare Support (1,181 | 4.6%), Cleaning & Maintenance (995 | 3.9%), Personal Care & Service (428 | 1.7%), and Security & Protection (227 | 0.9%).
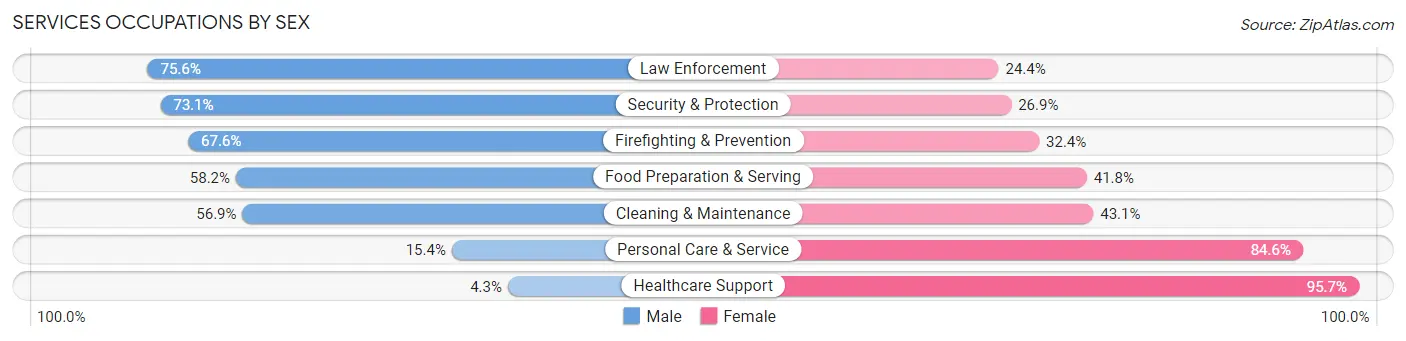
Services Occupations by Sex
Within the Services occupations in Sheboygan, the most male-oriented occupations are Law Enforcement (75.6%), Security & Protection (73.1%), and Firefighting & Prevention (67.6%), while the most female-oriented occupations are Healthcare Support (95.7%), Personal Care & Service (84.6%), and Cleaning & Maintenance (43.1%).
| Occupation | Male | Female |
| Healthcare Support | 51 (4.3%) | 1,130 (95.7%) |
| Security & Protection | 166 (73.1%) | 61 (26.9%) |
| Firefighting & Prevention | 48 (67.6%) | 23 (32.4%) |
| Law Enforcement | 118 (75.6%) | 38 (24.4%) |
| Food Preparation & Serving | 972 (58.2%) | 699 (41.8%) |
| Cleaning & Maintenance | 566 (56.9%) | 429 (43.1%) |
| Personal Care & Service | 66 (15.4%) | 362 (84.6%) |
| Total (Category) | 1,821 (40.5%) | 2,681 (59.6%) |
| Total (Overall) | 13,637 (53.2%) | 11,992 (46.8%) |
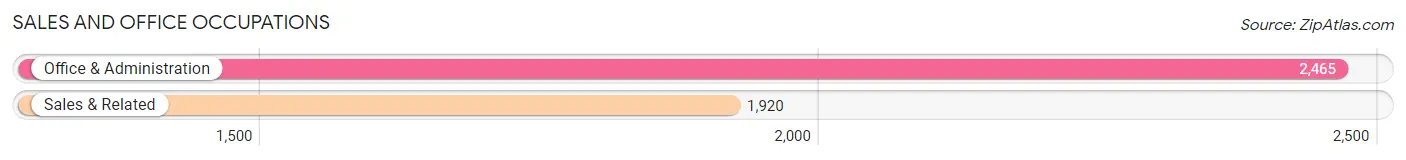
Sales and Office Occupations
The most common Sales and Office occupations in Sheboygan are Office & Administration (2,465 | 9.6%), and Sales & Related (1,920 | 7.5%).
Sales and Office Occupations by Sex
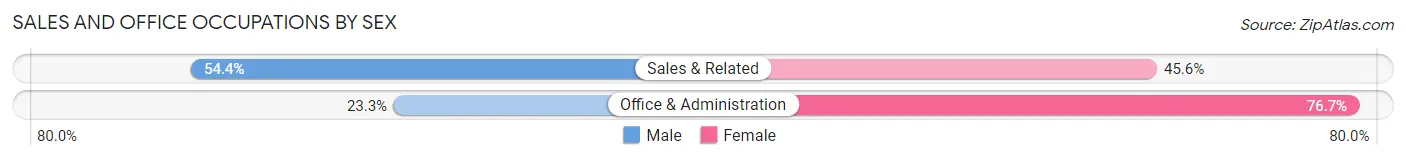
| Occupation | Male | Female |
| Sales & Related | 1,044 (54.4%) | 876 (45.6%) |
| Office & Administration | 575 (23.3%) | 1,890 (76.7%) |
| Total (Category) | 1,619 (36.9%) | 2,766 (63.1%) |
| Total (Overall) | 13,637 (53.2%) | 11,992 (46.8%) |
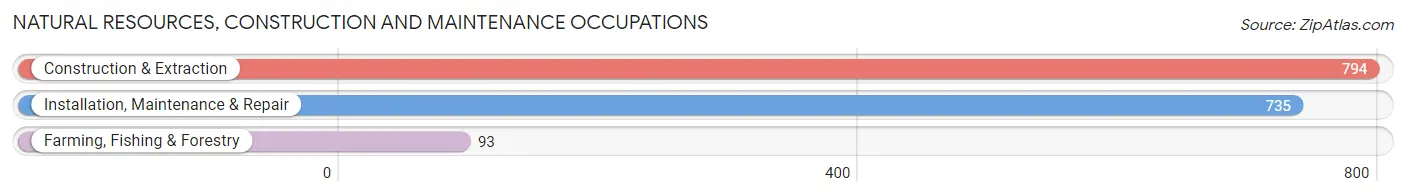
Natural Resources, Construction and Maintenance Occupations
The most common Natural Resources, Construction and Maintenance occupations in Sheboygan are Construction & Extraction (794 | 3.1%), Installation, Maintenance & Repair (735 | 2.9%), and Farming, Fishing & Forestry (93 | 0.4%).
Natural Resources, Construction and Maintenance Occupations by Sex
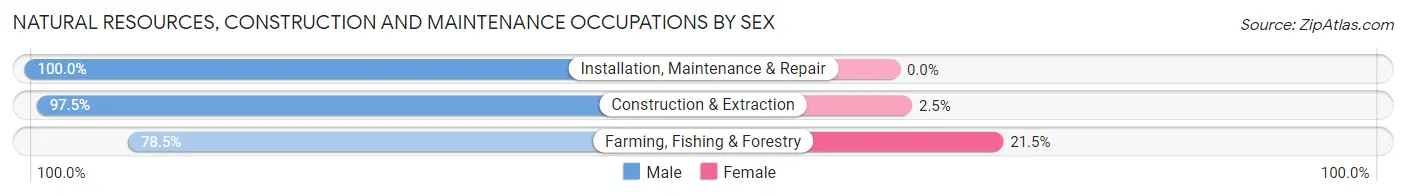
| Occupation | Male | Female |
| Farming, Fishing & Forestry | 73 (78.5%) | 20 (21.5%) |
| Construction & Extraction | 774 (97.5%) | 20 (2.5%) |
| Installation, Maintenance & Repair | 735 (100.0%) | 0 (0.0%) |
| Total (Category) | 1,582 (97.5%) | 40 (2.5%) |
| Total (Overall) | 13,637 (53.2%) | 11,992 (46.8%) |
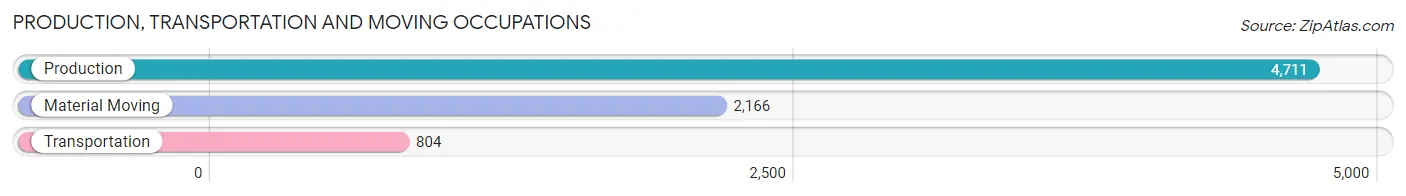
Production, Transportation and Moving Occupations
The most common Production, Transportation and Moving occupations in Sheboygan are Production (4,711 | 18.4%), Material Moving (2,166 | 8.5%), and Transportation (804 | 3.1%).
Production, Transportation and Moving Occupations by Sex
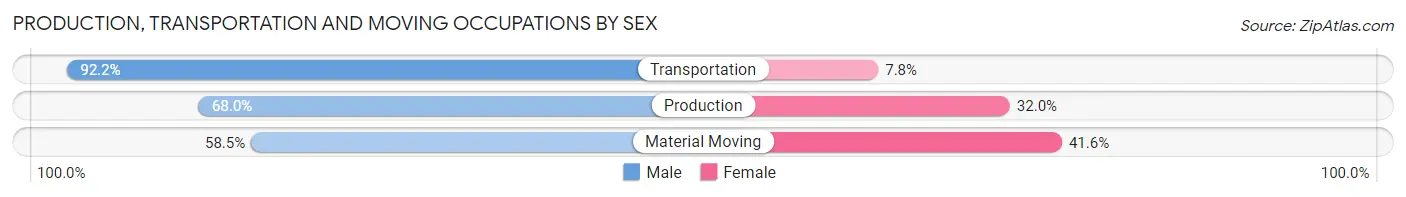
| Occupation | Male | Female |
| Production | 3,204 (68.0%) | 1,507 (32.0%) |
| Transportation | 741 (92.2%) | 63 (7.8%) |
| Material Moving | 1,266 (58.5%) | 900 (41.5%) |
| Total (Category) | 5,211 (67.8%) | 2,470 (32.2%) |
| Total (Overall) | 13,637 (53.2%) | 11,992 (46.8%) |
Employment Industries by Sex in Sheboygan
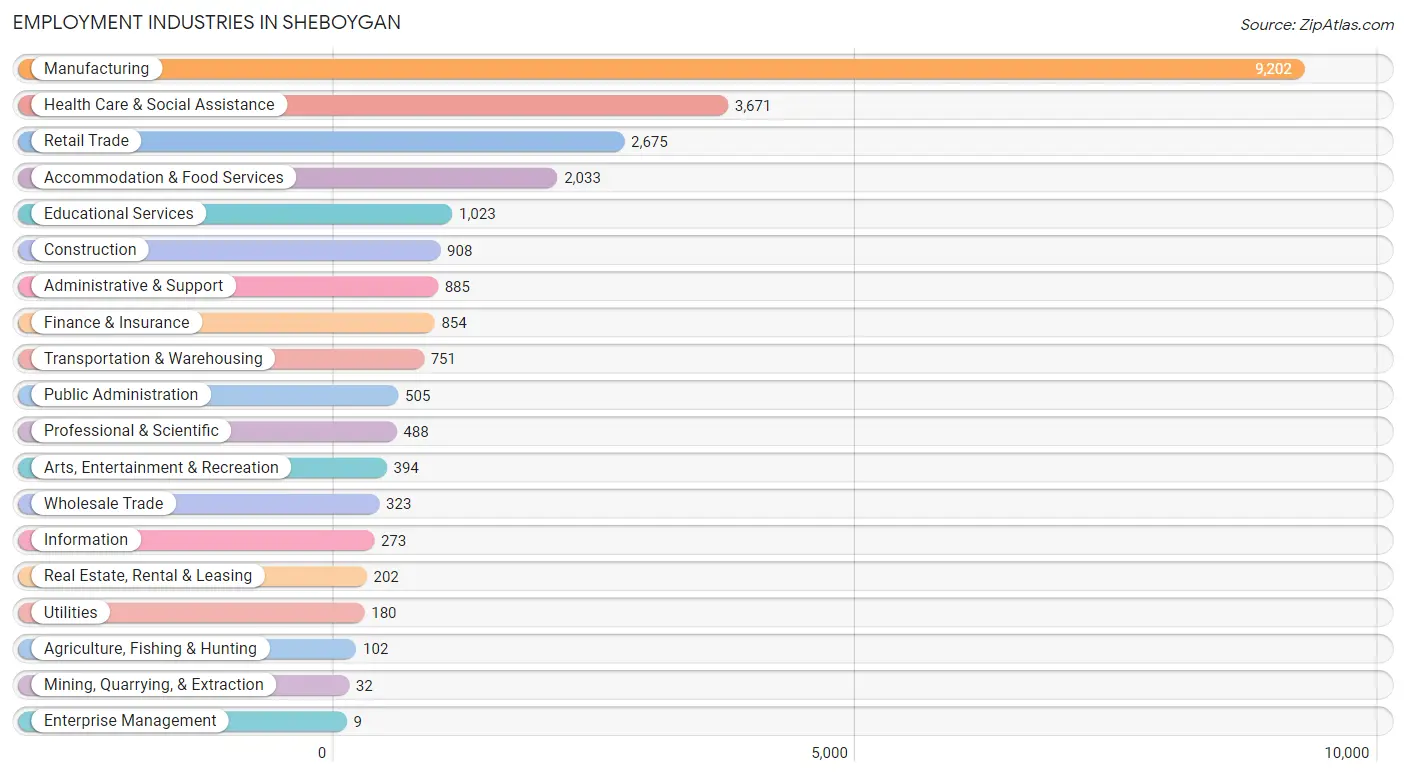
Employment Industries in Sheboygan
The major employment industries in Sheboygan include Manufacturing (9,202 | 35.9%), Health Care & Social Assistance (3,671 | 14.3%), Retail Trade (2,675 | 10.4%), Accommodation & Food Services (2,033 | 7.9%), and Educational Services (1,023 | 4.0%).
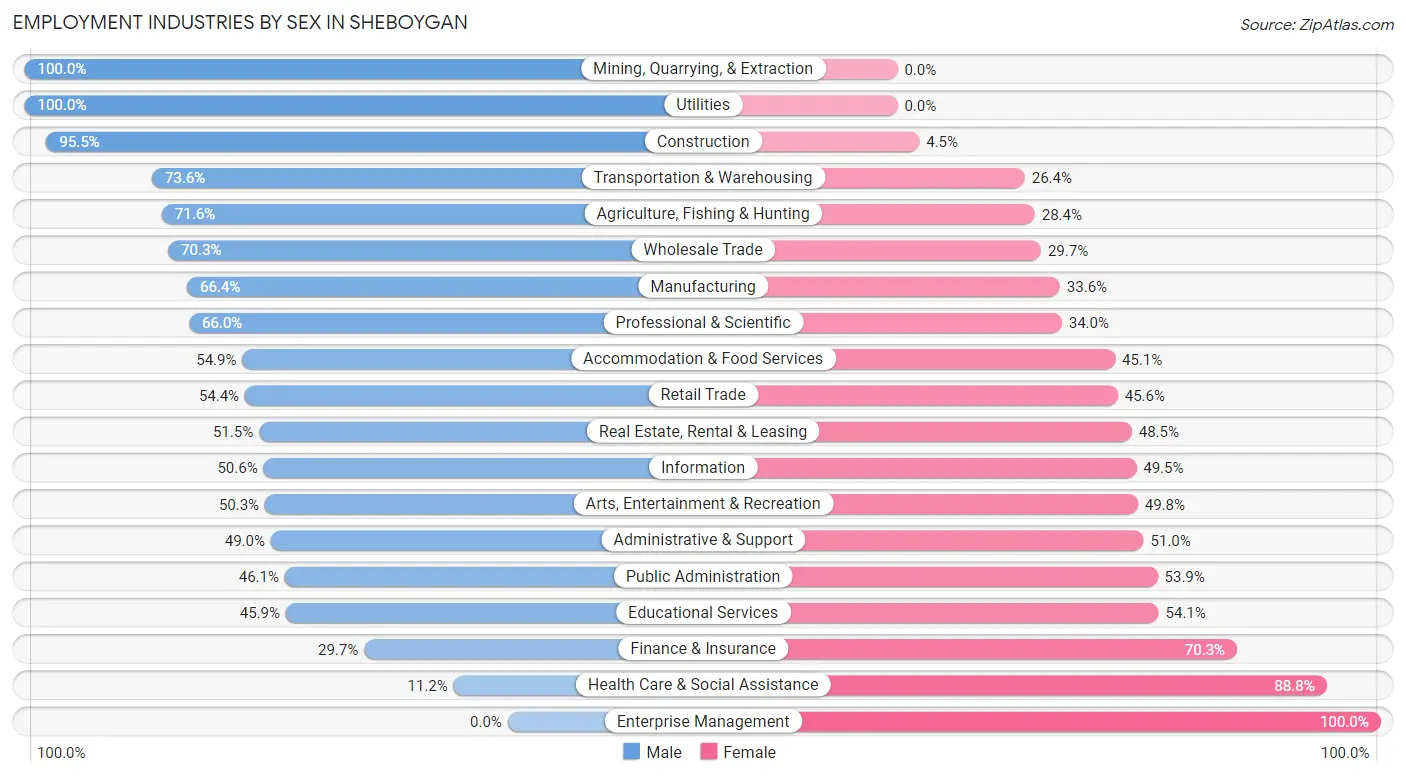
Employment Industries by Sex in Sheboygan
The Sheboygan industries that see more men than women are Mining, Quarrying, & Extraction (100.0%), Utilities (100.0%), and Construction (95.5%), whereas the industries that tend to have a higher number of women are Enterprise Management (100.0%), Health Care & Social Assistance (88.8%), and Finance & Insurance (70.3%).
| Industry | Male | Female |
| Agriculture, Fishing & Hunting | 73 (71.6%) | 29 (28.4%) |
| Mining, Quarrying, & Extraction | 32 (100.0%) | 0 (0.0%) |
| Construction | 867 (95.5%) | 41 (4.5%) |
| Manufacturing | 6,107 (66.4%) | 3,095 (33.6%) |
| Wholesale Trade | 227 (70.3%) | 96 (29.7%) |
| Retail Trade | 1,455 (54.4%) | 1,220 (45.6%) |
| Transportation & Warehousing | 553 (73.6%) | 198 (26.4%) |
| Utilities | 180 (100.0%) | 0 (0.0%) |
| Information | 138 (50.5%) | 135 (49.4%) |
| Finance & Insurance | 254 (29.7%) | 600 (70.3%) |
| Real Estate, Rental & Leasing | 104 (51.5%) | 98 (48.5%) |
| Professional & Scientific | 322 (66.0%) | 166 (34.0%) |
| Enterprise Management | 0 (0.0%) | 9 (100.0%) |
| Administrative & Support | 434 (49.0%) | 451 (51.0%) |
| Educational Services | 470 (45.9%) | 553 (54.1%) |
| Health Care & Social Assistance | 411 (11.2%) | 3,260 (88.8%) |
| Arts, Entertainment & Recreation | 198 (50.2%) | 196 (49.7%) |
| Accommodation & Food Services | 1,117 (54.9%) | 916 (45.1%) |
| Public Administration | 233 (46.1%) | 272 (53.9%) |
| Total | 13,637 (53.2%) | 11,992 (46.8%) |
Education in Sheboygan
School Enrollment in Sheboygan
The most common levels of schooling among the 11,350 students in Sheboygan are middle school (2,672 | 23.5%), high school (2,640 | 23.3%), and elementary school (2,548 | 22.5%).
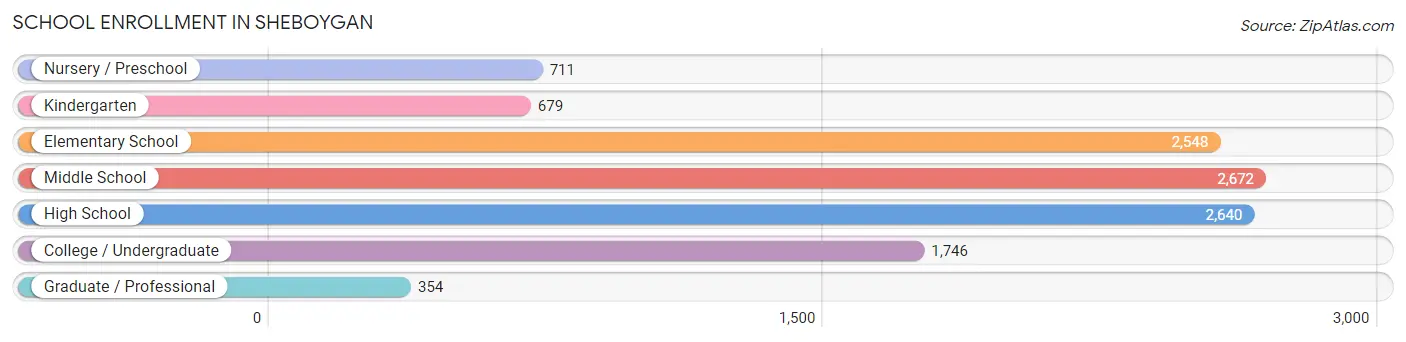
| School Level | # Students | % Students |
| Nursery / Preschool | 711 | 6.3% |
| Kindergarten | 679 | 6.0% |
| Elementary School | 2,548 | 22.5% |
| Middle School | 2,672 | 23.5% |
| High School | 2,640 | 23.3% |
| College / Undergraduate | 1,746 | 15.4% |
| Graduate / Professional | 354 | 3.1% |
| Total | 11,350 | 100.0% |
School Enrollment by Age by Funding Source in Sheboygan
Out of a total of 11,350 students who are enrolled in schools in Sheboygan, 2,372 (20.9%) attend a private institution, while the remaining 8,978 (79.1%) are enrolled in public schools. The age group of 3 to 4 year olds has the highest likelihood of being enrolled in private schools, with 184 (40.9% in the age bracket) enrolled. Conversely, the age group of 25 to 34 year olds has the lowest likelihood of being enrolled in a private school, with 554 (94.4% in the age bracket) attending a public institution.
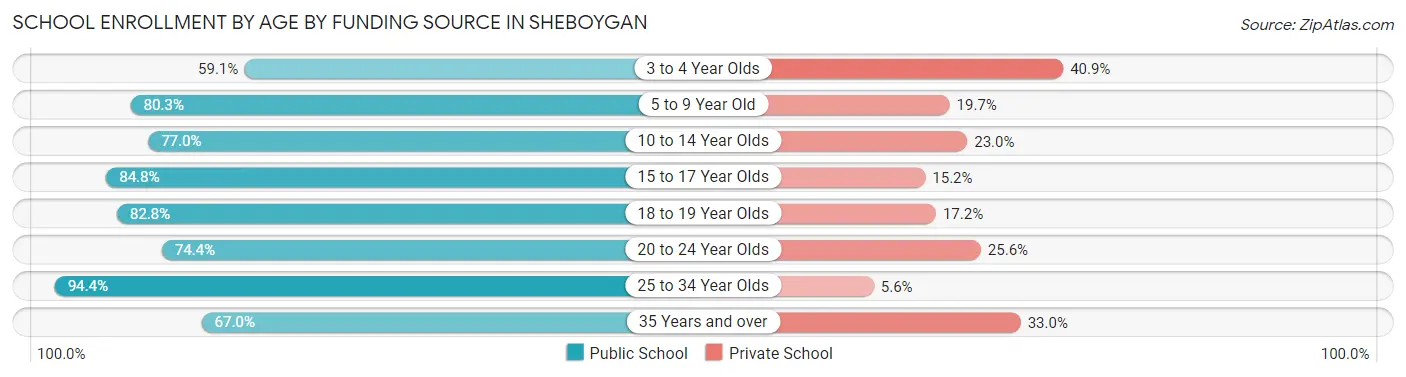
| Age Bracket | Public School | Private School |
| 3 to 4 Year Olds | 266 (59.1%) | 184 (40.9%) |
| 5 to 9 Year Old | 2,451 (80.3%) | 603 (19.7%) |
| 10 to 14 Year Olds | 2,590 (77.0%) | 775 (23.0%) |
| 15 to 17 Year Olds | 1,727 (84.8%) | 310 (15.2%) |
| 18 to 19 Year Olds | 472 (82.8%) | 98 (17.2%) |
| 20 to 24 Year Olds | 536 (74.4%) | 184 (25.6%) |
| 25 to 34 Year Olds | 554 (94.4%) | 33 (5.6%) |
| 35 Years and over | 380 (67.0%) | 187 (33.0%) |
| Total | 8,978 (79.1%) | 2,372 (20.9%) |
Educational Attainment by Field of Study in Sheboygan
Business (1,639 | 19.0%), education (1,187 | 13.7%), science & technology (807 | 9.3%), engineering (615 | 7.1%), and visual & performing arts (603 | 7.0%) are the most common fields of study among 8,641 individuals in Sheboygan who have obtained a bachelor's degree or higher.
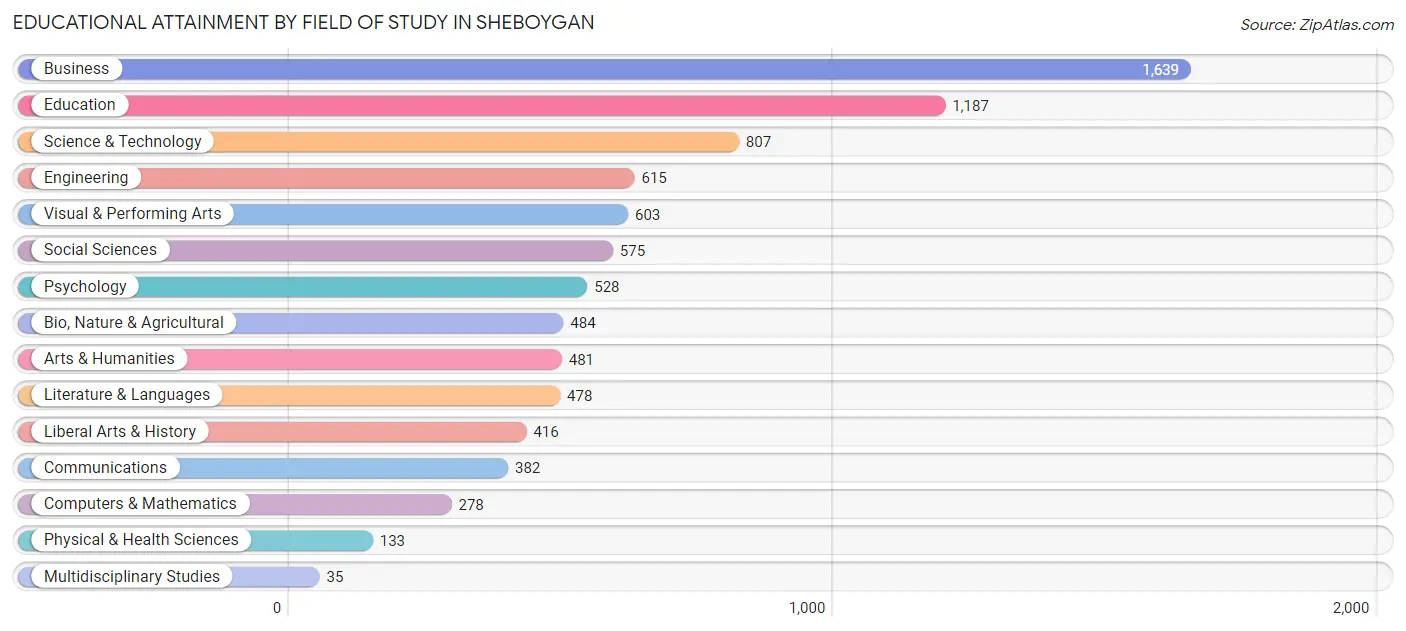
| Field of Study | # Graduates | % Graduates |
| Computers & Mathematics | 278 | 3.2% |
| Bio, Nature & Agricultural | 484 | 5.6% |
| Physical & Health Sciences | 133 | 1.5% |
| Psychology | 528 | 6.1% |
| Social Sciences | 575 | 6.7% |
| Engineering | 615 | 7.1% |
| Multidisciplinary Studies | 35 | 0.4% |
| Science & Technology | 807 | 9.3% |
| Business | 1,639 | 19.0% |
| Education | 1,187 | 13.7% |
| Literature & Languages | 478 | 5.5% |
| Liberal Arts & History | 416 | 4.8% |
| Visual & Performing Arts | 603 | 7.0% |
| Communications | 382 | 4.4% |
| Arts & Humanities | 481 | 5.6% |
| Total | 8,641 | 100.0% |
Transportation & Commute in Sheboygan
Vehicle Availability by Sex in Sheboygan
The most prevalent vehicle ownership categories in Sheboygan are males with 2 vehicles (6,187, accounting for 46.1%) and females with 2 vehicles (5,349, making up 52.6%).
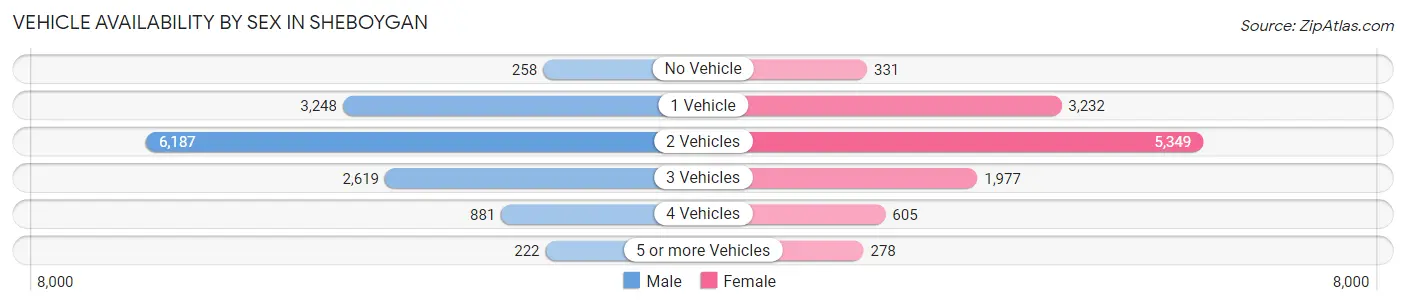
| Vehicles Available | Male | Female |
| No Vehicle | 258 (1.9%) | 331 (2.8%) |
| 1 Vehicle | 3,248 (24.2%) | 3,232 (27.5%) |
| 2 Vehicles | 6,187 (46.1%) | 5,349 (45.4%) |
| 3 Vehicles | 2,619 (19.5%) | 1,977 (16.8%) |
| 4 Vehicles | 881 (6.6%) | 605 (5.1%) |
| 5 or more Vehicles | 222 (1.7%) | 278 (2.4%) |
| Total | 13,415 (100.0%) | 11,772 (100.0%) |
Commute Time in Sheboygan
The most frequently occuring commute durations in Sheboygan are 10 to 14 minutes (6,249 commuters, 26.2%), 5 to 9 minutes (5,374 commuters, 22.5%), and 15 to 19 minutes (4,903 commuters, 20.5%).
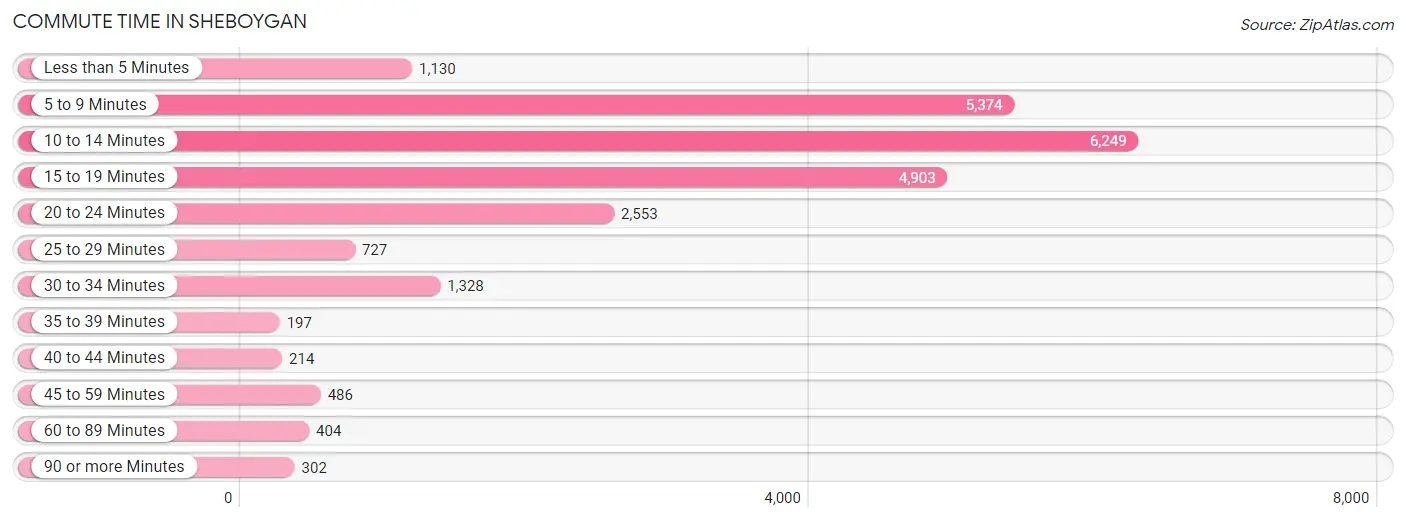
| Commute Time | # Commuters | % Commuters |
| Less than 5 Minutes | 1,130 | 4.7% |
| 5 to 9 Minutes | 5,374 | 22.5% |
| 10 to 14 Minutes | 6,249 | 26.2% |
| 15 to 19 Minutes | 4,903 | 20.5% |
| 20 to 24 Minutes | 2,553 | 10.7% |
| 25 to 29 Minutes | 727 | 3.0% |
| 30 to 34 Minutes | 1,328 | 5.6% |
| 35 to 39 Minutes | 197 | 0.8% |
| 40 to 44 Minutes | 214 | 0.9% |
| 45 to 59 Minutes | 486 | 2.0% |
| 60 to 89 Minutes | 404 | 1.7% |
| 90 or more Minutes | 302 | 1.3% |
Commute Time by Sex in Sheboygan
The most common commute times in Sheboygan are 10 to 14 minutes (3,116 commuters, 24.5%) for males and 10 to 14 minutes (3,133 commuters, 28.1%) for females.
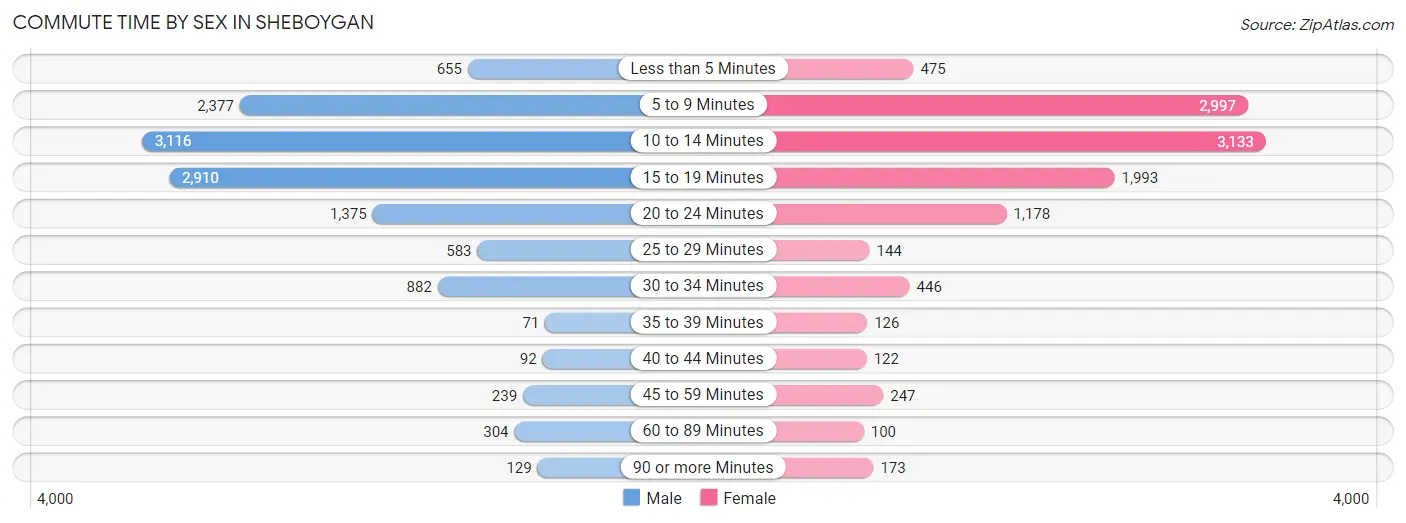
| Commute Time | Male | Female |
| Less than 5 Minutes | 655 (5.1%) | 475 (4.3%) |
| 5 to 9 Minutes | 2,377 (18.7%) | 2,997 (26.9%) |
| 10 to 14 Minutes | 3,116 (24.5%) | 3,133 (28.1%) |
| 15 to 19 Minutes | 2,910 (22.9%) | 1,993 (17.9%) |
| 20 to 24 Minutes | 1,375 (10.8%) | 1,178 (10.6%) |
| 25 to 29 Minutes | 583 (4.6%) | 144 (1.3%) |
| 30 to 34 Minutes | 882 (6.9%) | 446 (4.0%) |
| 35 to 39 Minutes | 71 (0.6%) | 126 (1.1%) |
| 40 to 44 Minutes | 92 (0.7%) | 122 (1.1%) |
| 45 to 59 Minutes | 239 (1.9%) | 247 (2.2%) |
| 60 to 89 Minutes | 304 (2.4%) | 100 (0.9%) |
| 90 or more Minutes | 129 (1.0%) | 173 (1.5%) |
Time of Departure to Work by Sex in Sheboygan
The most frequent times of departure to work in Sheboygan are 12:00 PM to 3:59 PM (2,353, 18.5%) for males and 7:30 AM to 7:59 AM (1,867, 16.8%) for females.
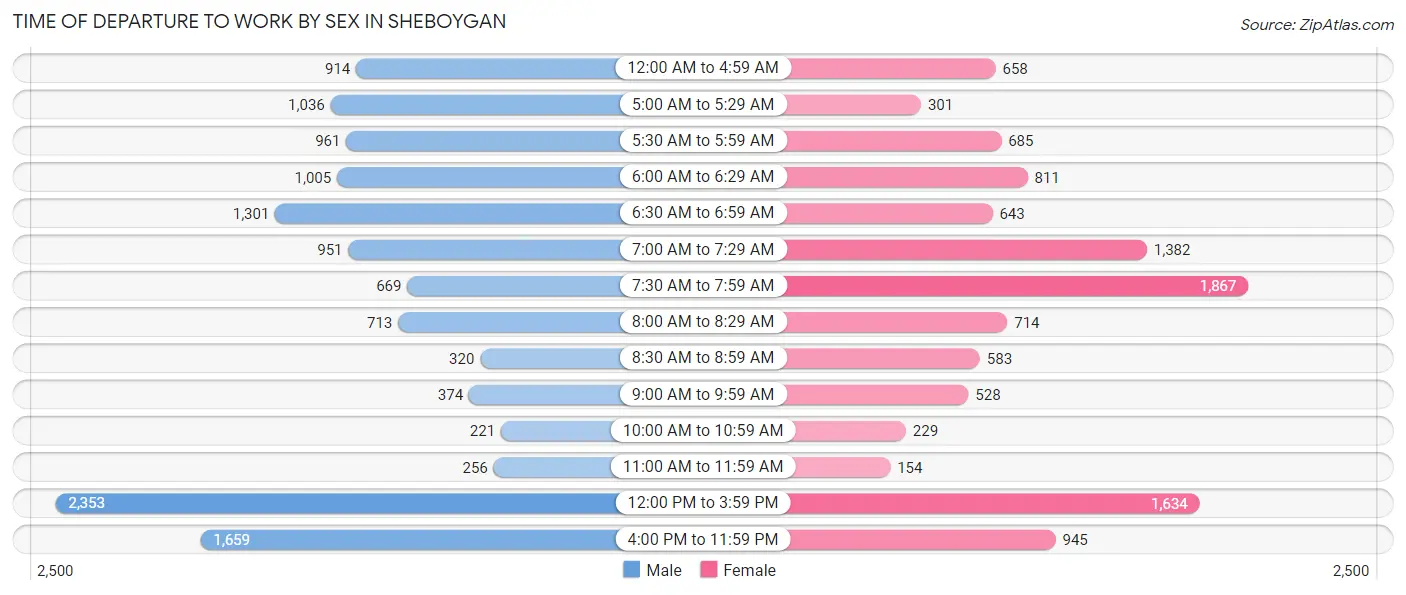
| Time of Departure | Male | Female |
| 12:00 AM to 4:59 AM | 914 (7.2%) | 658 (5.9%) |
| 5:00 AM to 5:29 AM | 1,036 (8.1%) | 301 (2.7%) |
| 5:30 AM to 5:59 AM | 961 (7.5%) | 685 (6.1%) |
| 6:00 AM to 6:29 AM | 1,005 (7.9%) | 811 (7.3%) |
| 6:30 AM to 6:59 AM | 1,301 (10.2%) | 643 (5.8%) |
| 7:00 AM to 7:29 AM | 951 (7.5%) | 1,382 (12.4%) |
| 7:30 AM to 7:59 AM | 669 (5.2%) | 1,867 (16.8%) |
| 8:00 AM to 8:29 AM | 713 (5.6%) | 714 (6.4%) |
| 8:30 AM to 8:59 AM | 320 (2.5%) | 583 (5.2%) |
| 9:00 AM to 9:59 AM | 374 (2.9%) | 528 (4.7%) |
| 10:00 AM to 10:59 AM | 221 (1.7%) | 229 (2.1%) |
| 11:00 AM to 11:59 AM | 256 (2.0%) | 154 (1.4%) |
| 12:00 PM to 3:59 PM | 2,353 (18.5%) | 1,634 (14.7%) |
| 4:00 PM to 11:59 PM | 1,659 (13.0%) | 945 (8.5%) |
| Total | 12,733 (100.0%) | 11,134 (100.0%) |
Housing Occupancy in Sheboygan
Occupancy by Ownership in Sheboygan
Of the total 21,046 dwellings in Sheboygan, owner-occupied units account for 12,795 (60.8%), while renter-occupied units make up 8,251 (39.2%).
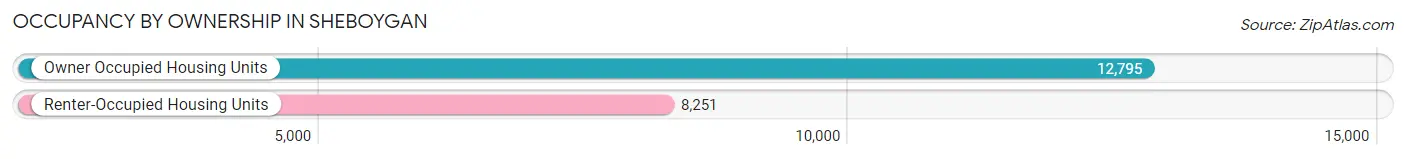
| Occupancy | # Housing Units | % Housing Units |
| Owner Occupied Housing Units | 12,795 | 60.8% |
| Renter-Occupied Housing Units | 8,251 | 39.2% |
| Total Occupied Housing Units | 21,046 | 100.0% |
Occupancy by Household Size in Sheboygan
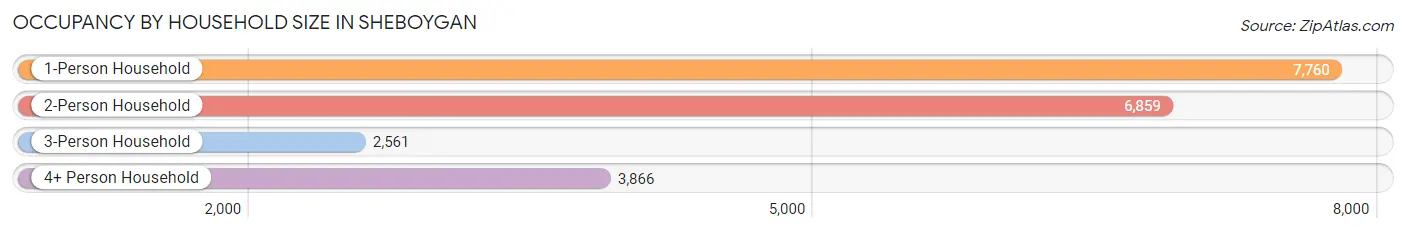
| Household Size | # Housing Units | % Housing Units |
| 1-Person Household | 7,760 | 36.9% |
| 2-Person Household | 6,859 | 32.6% |
| 3-Person Household | 2,561 | 12.2% |
| 4+ Person Household | 3,866 | 18.4% |
| Total Housing Units | 21,046 | 100.0% |
Occupancy by Ownership by Household Size in Sheboygan
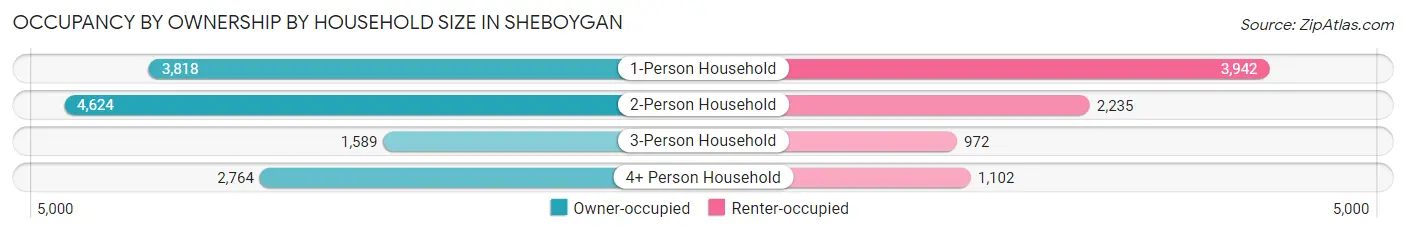
| Household Size | Owner-occupied | Renter-occupied |
| 1-Person Household | 3,818 (49.2%) | 3,942 (50.8%) |
| 2-Person Household | 4,624 (67.4%) | 2,235 (32.6%) |
| 3-Person Household | 1,589 (62.1%) | 972 (38.0%) |
| 4+ Person Household | 2,764 (71.5%) | 1,102 (28.5%) |
| Total Housing Units | 12,795 (60.8%) | 8,251 (39.2%) |
Occupancy by Educational Attainment in Sheboygan
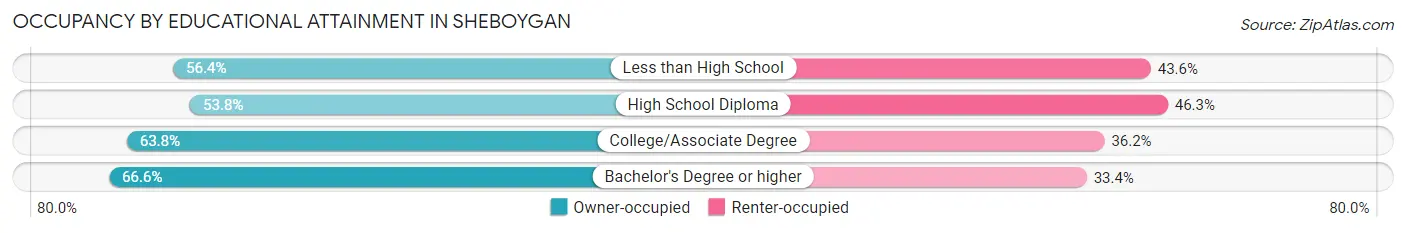
| Household Size | Owner-occupied | Renter-occupied |
| Less than High School | 833 (56.4%) | 643 (43.6%) |
| High School Diploma | 3,587 (53.7%) | 3,087 (46.3%) |
| College/Associate Degree | 4,868 (63.8%) | 2,763 (36.2%) |
| Bachelor's Degree or higher | 3,507 (66.6%) | 1,758 (33.4%) |
Occupancy by Age of Householder in Sheboygan
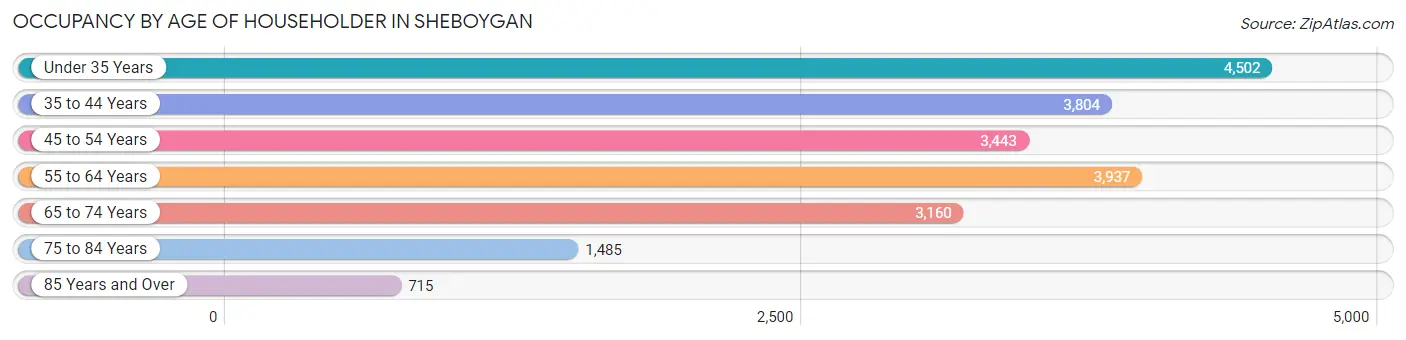
| Age Bracket | # Households | % Households |
| Under 35 Years | 4,502 | 21.4% |
| 35 to 44 Years | 3,804 | 18.1% |
| 45 to 54 Years | 3,443 | 16.4% |
| 55 to 64 Years | 3,937 | 18.7% |
| 65 to 74 Years | 3,160 | 15.0% |
| 75 to 84 Years | 1,485 | 7.1% |
| 85 Years and Over | 715 | 3.4% |
| Total | 21,046 | 100.0% |
Housing Finances in Sheboygan
Median Income by Occupancy in Sheboygan
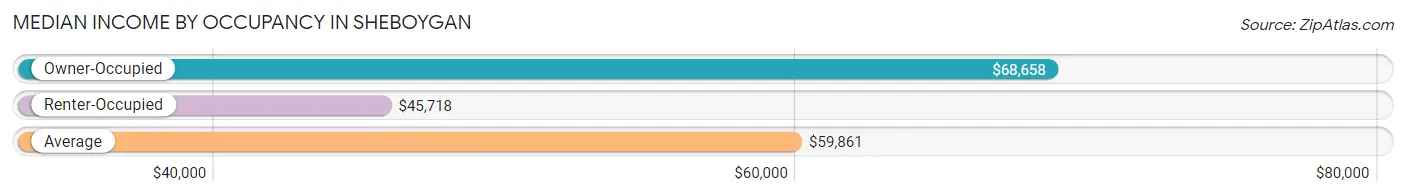
| Occupancy Type | # Households | Median Income |
| Owner-Occupied | 12,795 (60.8%) | $68,658 |
| Renter-Occupied | 8,251 (39.2%) | $45,718 |
| Average | 21,046 (100.0%) | $59,861 |
Occupancy by Householder Income Bracket in Sheboygan
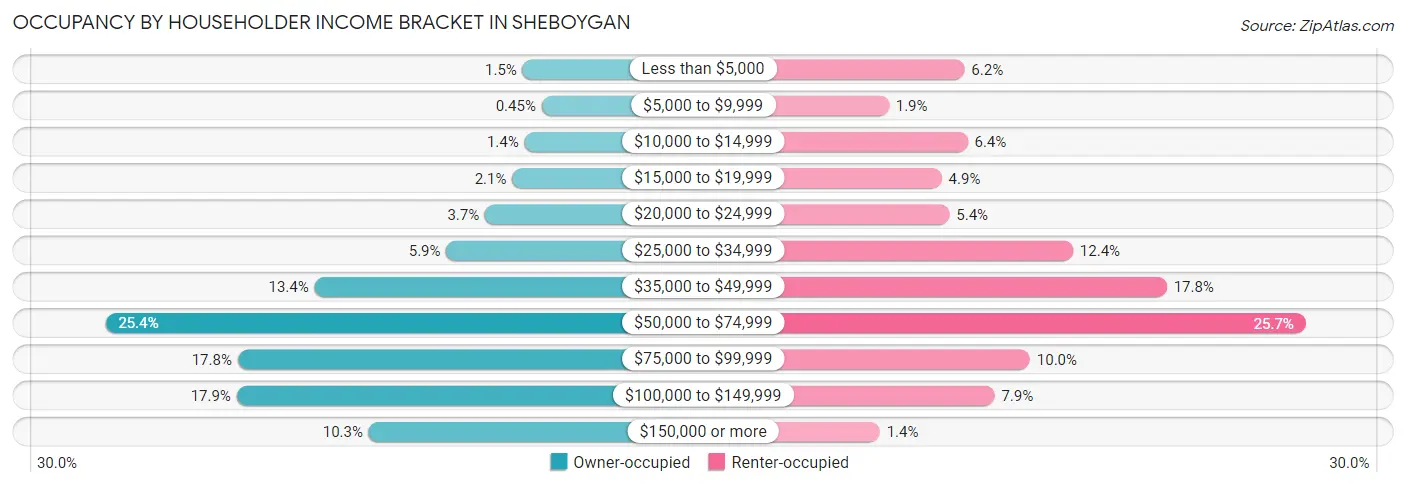
| Income Bracket | Owner-occupied | Renter-occupied |
| Less than $5,000 | 197 (1.5%) | 513 (6.2%) |
| $5,000 to $9,999 | 58 (0.4%) | 157 (1.9%) |
| $10,000 to $14,999 | 183 (1.4%) | 528 (6.4%) |
| $15,000 to $19,999 | 273 (2.1%) | 406 (4.9%) |
| $20,000 to $24,999 | 472 (3.7%) | 442 (5.4%) |
| $25,000 to $34,999 | 755 (5.9%) | 1,025 (12.4%) |
| $35,000 to $49,999 | 1,718 (13.4%) | 1,467 (17.8%) |
| $50,000 to $74,999 | 3,249 (25.4%) | 2,122 (25.7%) |
| $75,000 to $99,999 | 2,280 (17.8%) | 822 (10.0%) |
| $100,000 to $149,999 | 2,288 (17.9%) | 655 (7.9%) |
| $150,000 or more | 1,322 (10.3%) | 114 (1.4%) |
| Total | 12,795 (100.0%) | 8,251 (100.0%) |
Monthly Housing Cost Tiers in Sheboygan
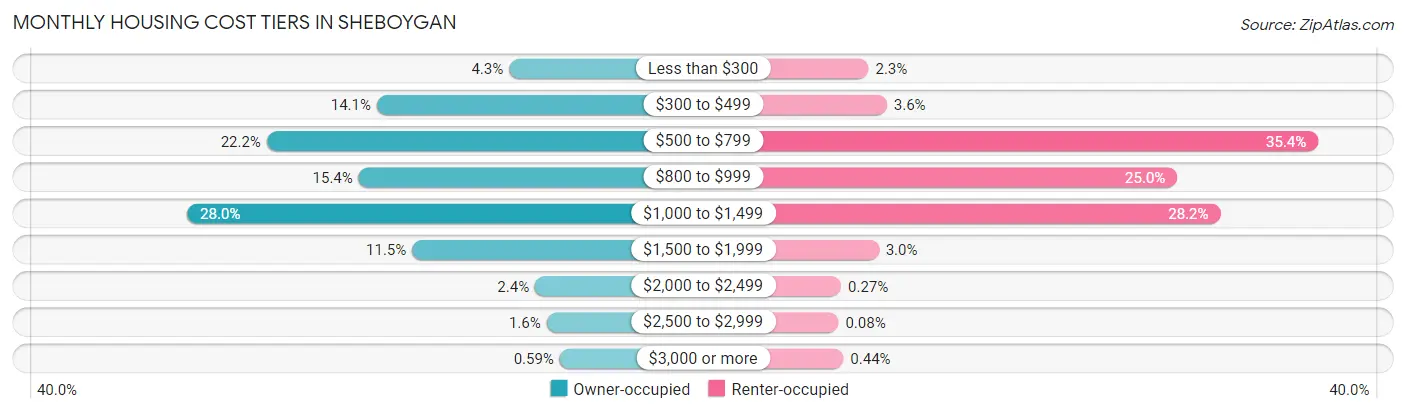
| Monthly Cost | Owner-occupied | Renter-occupied |
| Less than $300 | 553 (4.3%) | 189 (2.3%) |
| $300 to $499 | 1,799 (14.1%) | 300 (3.6%) |
| $500 to $799 | 2,837 (22.2%) | 2,921 (35.4%) |
| $800 to $999 | 1,970 (15.4%) | 2,064 (25.0%) |
| $1,000 to $1,499 | 3,587 (28.0%) | 2,327 (28.2%) |
| $1,500 to $1,999 | 1,466 (11.5%) | 251 (3.0%) |
| $2,000 to $2,499 | 308 (2.4%) | 22 (0.3%) |
| $2,500 to $2,999 | 200 (1.6%) | 7 (0.1%) |
| $3,000 or more | 75 (0.6%) | 36 (0.4%) |
| Total | 12,795 (100.0%) | 8,251 (100.0%) |
Physical Housing Characteristics in Sheboygan
Housing Structures in Sheboygan
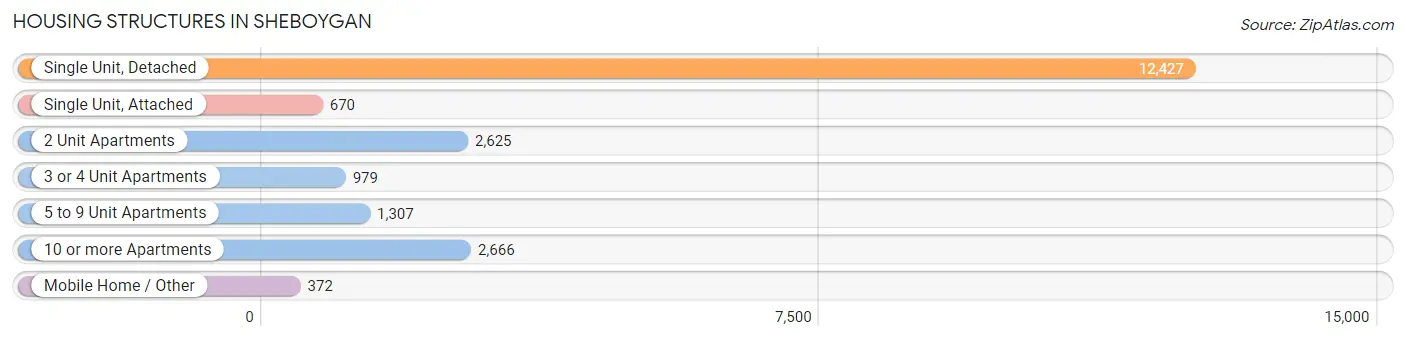
| Structure Type | # Housing Units | % Housing Units |
| Single Unit, Detached | 12,427 | 59.1% |
| Single Unit, Attached | 670 | 3.2% |
| 2 Unit Apartments | 2,625 | 12.5% |
| 3 or 4 Unit Apartments | 979 | 4.6% |
| 5 to 9 Unit Apartments | 1,307 | 6.2% |
| 10 or more Apartments | 2,666 | 12.7% |
| Mobile Home / Other | 372 | 1.8% |
| Total | 21,046 | 100.0% |
Housing Structures by Occupancy in Sheboygan
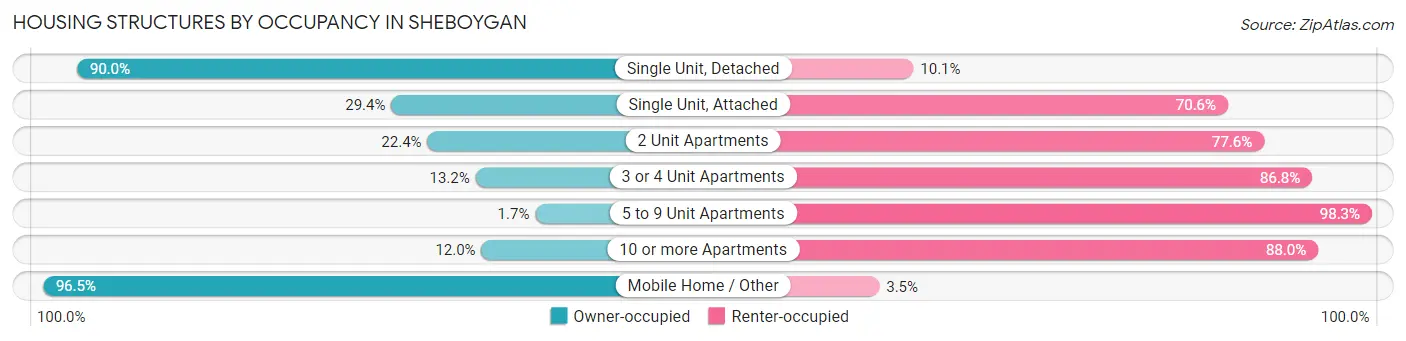
| Structure Type | Owner-occupied | Renter-occupied |
| Single Unit, Detached | 11,178 (89.9%) | 1,249 (10.1%) |
| Single Unit, Attached | 197 (29.4%) | 473 (70.6%) |
| 2 Unit Apartments | 589 (22.4%) | 2,036 (77.6%) |
| 3 or 4 Unit Apartments | 129 (13.2%) | 850 (86.8%) |
| 5 to 9 Unit Apartments | 22 (1.7%) | 1,285 (98.3%) |
| 10 or more Apartments | 321 (12.0%) | 2,345 (88.0%) |
| Mobile Home / Other | 359 (96.5%) | 13 (3.5%) |
| Total | 12,795 (60.8%) | 8,251 (39.2%) |
Housing Structures by Number of Rooms in Sheboygan
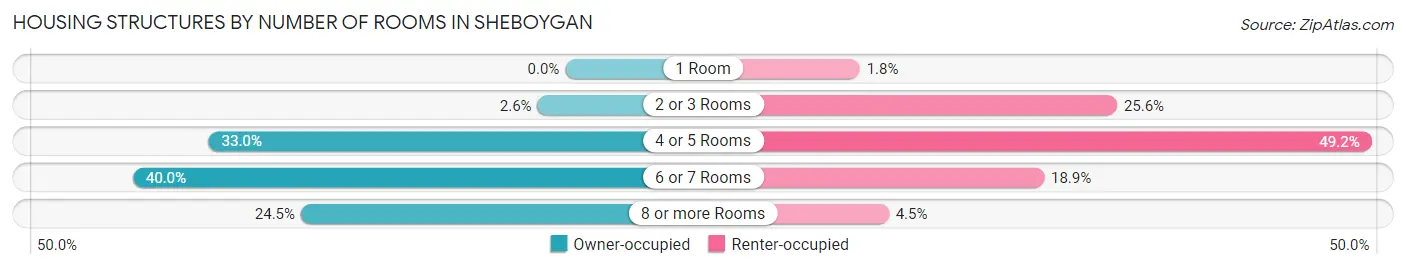
| Number of Rooms | Owner-occupied | Renter-occupied |
| 1 Room | 0 (0.0%) | 151 (1.8%) |
| 2 or 3 Rooms | 329 (2.6%) | 2,114 (25.6%) |
| 4 or 5 Rooms | 4,220 (33.0%) | 4,056 (49.2%) |
| 6 or 7 Rooms | 5,117 (40.0%) | 1,558 (18.9%) |
| 8 or more Rooms | 3,129 (24.4%) | 372 (4.5%) |
| Total | 12,795 (100.0%) | 8,251 (100.0%) |
Housing Structure by Heating Type in Sheboygan
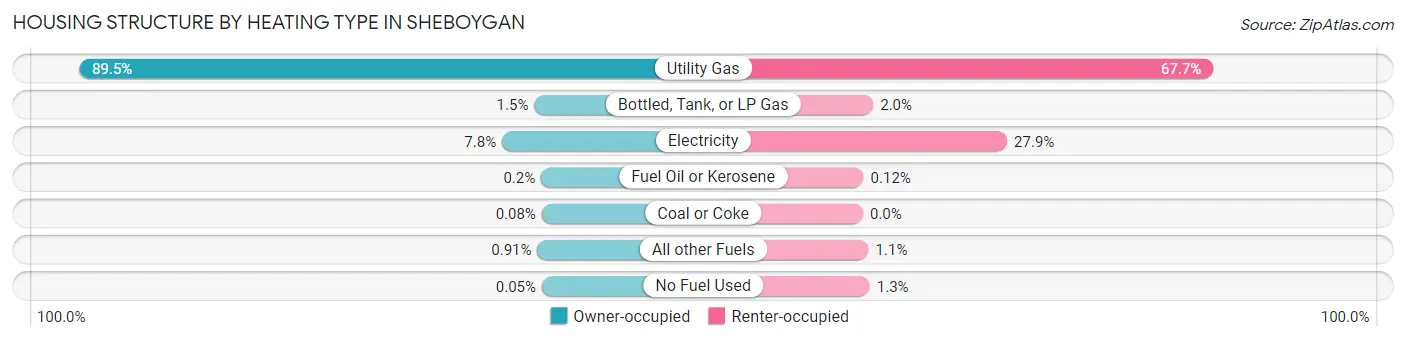
| Heating Type | Owner-occupied | Renter-occupied |
| Utility Gas | 11,450 (89.5%) | 5,582 (67.6%) |
| Bottled, Tank, or LP Gas | 194 (1.5%) | 163 (2.0%) |
| Electricity | 992 (7.7%) | 2,298 (27.9%) |
| Fuel Oil or Kerosene | 26 (0.2%) | 10 (0.1%) |
| Coal or Coke | 10 (0.1%) | 0 (0.0%) |
| All other Fuels | 116 (0.9%) | 89 (1.1%) |
| No Fuel Used | 7 (0.1%) | 109 (1.3%) |
| Total | 12,795 (100.0%) | 8,251 (100.0%) |
Household Vehicle Usage in Sheboygan
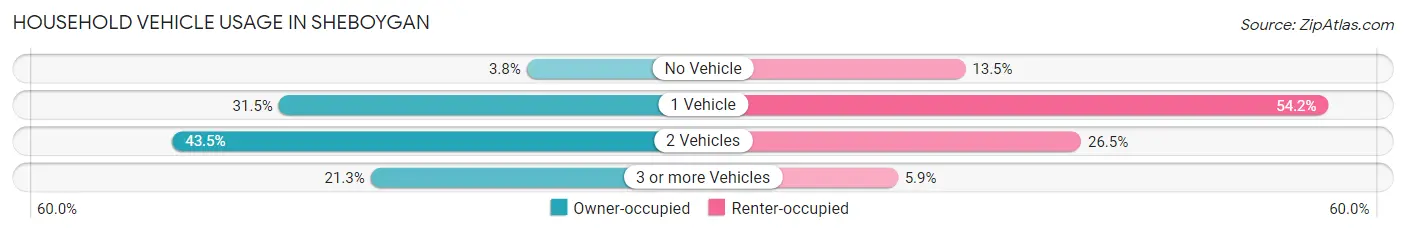
| Vehicles per Household | Owner-occupied | Renter-occupied |
| No Vehicle | 482 (3.8%) | 1,113 (13.5%) |
| 1 Vehicle | 4,035 (31.5%) | 4,468 (54.1%) |
| 2 Vehicles | 5,559 (43.4%) | 2,182 (26.5%) |
| 3 or more Vehicles | 2,719 (21.2%) | 488 (5.9%) |
| Total | 12,795 (100.0%) | 8,251 (100.0%) |
Real Estate & Mortgages in Sheboygan
Real Estate and Mortgage Overview in Sheboygan
| Characteristic | Without Mortgage | With Mortgage |
| Housing Units | 4,623 | 8,172 |
| Median Property Value | $146,200 | $158,000 |
| Median Household Income | $58,248 | $854 |
| Monthly Housing Costs | $505 | $64 |
| Real Estate Taxes | $2,729 | $106 |
Property Value by Mortgage Status in Sheboygan
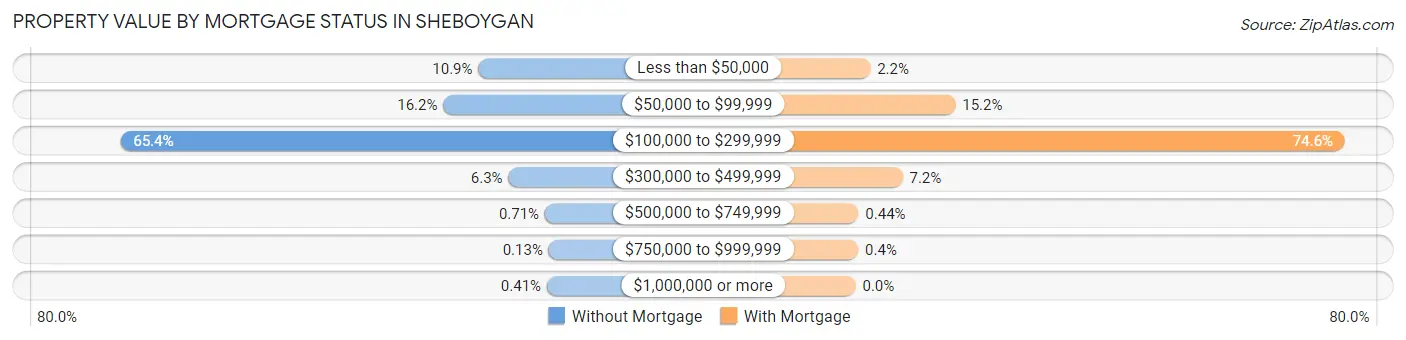
| Property Value | Without Mortgage | With Mortgage |
| Less than $50,000 | 502 (10.9%) | 182 (2.2%) |
| $50,000 to $99,999 | 749 (16.2%) | 1,242 (15.2%) |
| $100,000 to $299,999 | 3,024 (65.4%) | 6,094 (74.6%) |
| $300,000 to $499,999 | 290 (6.3%) | 585 (7.2%) |
| $500,000 to $749,999 | 33 (0.7%) | 36 (0.4%) |
| $750,000 to $999,999 | 6 (0.1%) | 33 (0.4%) |
| $1,000,000 or more | 19 (0.4%) | 0 (0.0%) |
| Total | 4,623 (100.0%) | 8,172 (100.0%) |
Household Income by Mortgage Status in Sheboygan
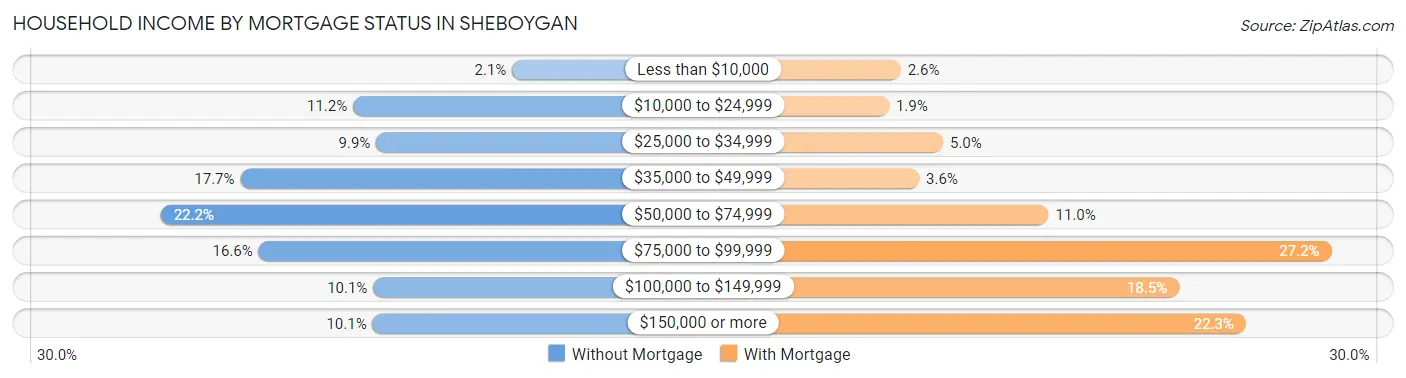
| Household Income | Without Mortgage | With Mortgage |
| Less than $10,000 | 99 (2.1%) | 211 (2.6%) |
| $10,000 to $24,999 | 519 (11.2%) | 156 (1.9%) |
| $25,000 to $34,999 | 458 (9.9%) | 409 (5.0%) |
| $35,000 to $49,999 | 817 (17.7%) | 297 (3.6%) |
| $50,000 to $74,999 | 1,027 (22.2%) | 901 (11.0%) |
| $75,000 to $99,999 | 769 (16.6%) | 2,222 (27.2%) |
| $100,000 to $149,999 | 466 (10.1%) | 1,511 (18.5%) |
| $150,000 or more | 468 (10.1%) | 1,822 (22.3%) |
| Total | 4,623 (100.0%) | 8,172 (100.0%) |
Property Value to Household Income Ratio in Sheboygan
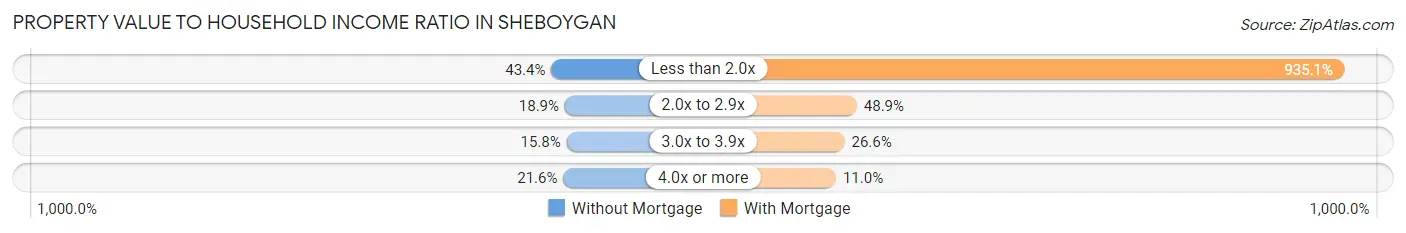
| Value-to-Income Ratio | Without Mortgage | With Mortgage |
| Less than 2.0x | 2,006 (43.4%) | 76,419 (935.1%) |
| 2.0x to 2.9x | 872 (18.9%) | 3,999 (48.9%) |
| 3.0x to 3.9x | 729 (15.8%) | 2,176 (26.6%) |
| 4.0x or more | 1,000 (21.6%) | 900 (11.0%) |
| Total | 4,623 (100.0%) | 8,172 (100.0%) |
Real Estate Taxes by Mortgage Status in Sheboygan
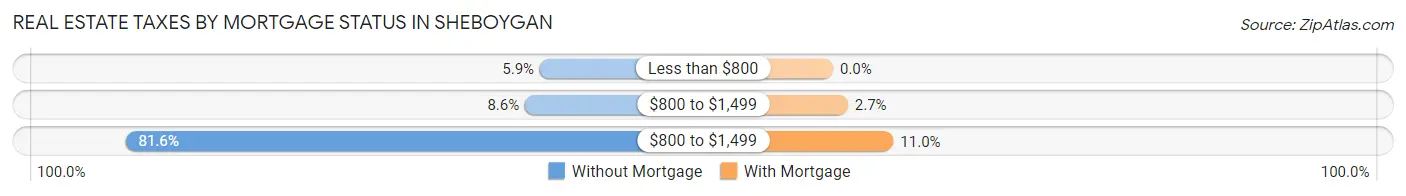
| Property Taxes | Without Mortgage | With Mortgage |
| Less than $800 | 272 (5.9%) | 0 (0.0%) |
| $800 to $1,499 | 397 (8.6%) | 221 (2.7%) |
| $800 to $1,499 | 3,770 (81.6%) | 901 (11.0%) |
| Total | 4,623 (100.0%) | 8,172 (100.0%) |
Health & Disability in Sheboygan
Health Insurance Coverage by Age in Sheboygan
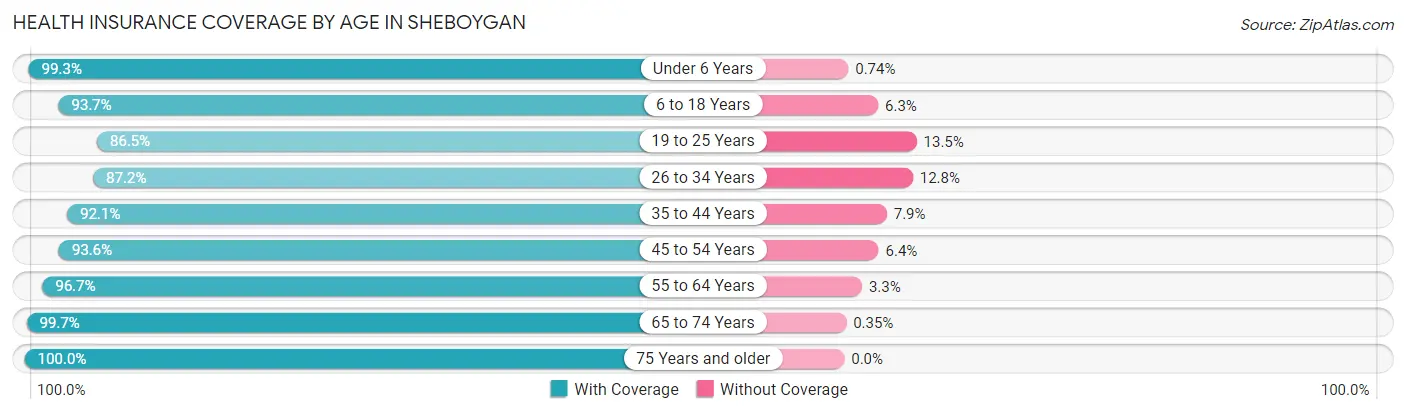
| Age Bracket | With Coverage | Without Coverage |
| Under 6 Years | 4,181 (99.3%) | 31 (0.7%) |
| 6 to 18 Years | 7,927 (93.7%) | 533 (6.3%) |
| 19 to 25 Years | 4,167 (86.5%) | 649 (13.5%) |
| 26 to 34 Years | 4,920 (87.2%) | 720 (12.8%) |
| 35 to 44 Years | 6,406 (92.1%) | 551 (7.9%) |
| 45 to 54 Years | 5,453 (93.6%) | 372 (6.4%) |
| 55 to 64 Years | 5,713 (96.7%) | 195 (3.3%) |
| 65 to 74 Years | 4,313 (99.7%) | 15 (0.4%) |
| 75 Years and older | 2,969 (100.0%) | 0 (0.0%) |
| Total | 46,049 (93.8%) | 3,066 (6.2%) |
Health Insurance Coverage by Citizenship Status in Sheboygan
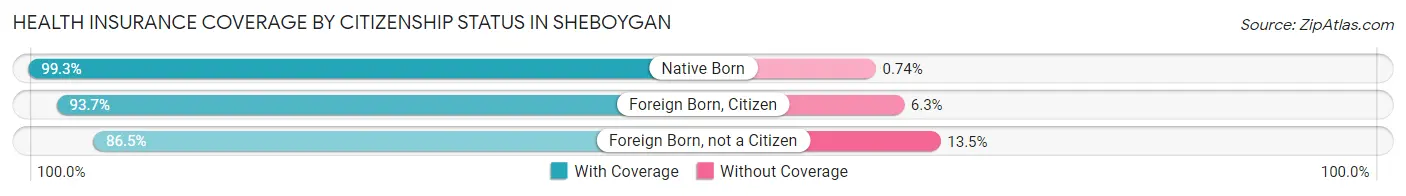
| Citizenship Status | With Coverage | Without Coverage |
| Native Born | 4,181 (99.3%) | 31 (0.7%) |
| Foreign Born, Citizen | 7,927 (93.7%) | 533 (6.3%) |
| Foreign Born, not a Citizen | 4,167 (86.5%) | 649 (13.5%) |
Health Insurance Coverage by Household Income in Sheboygan
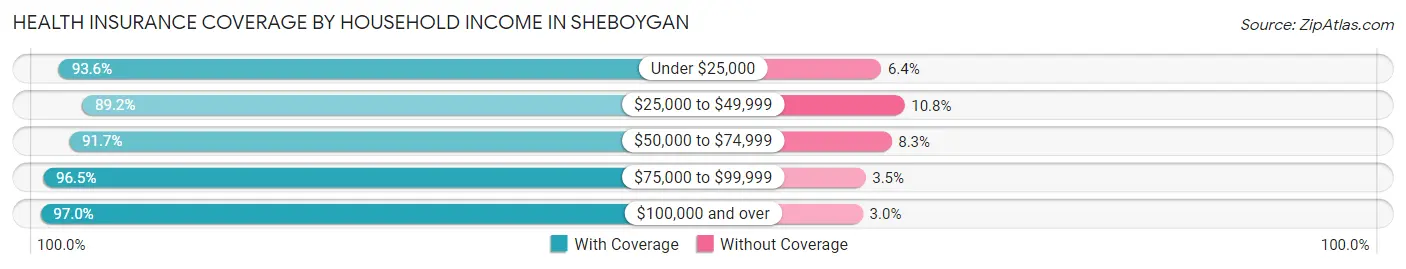
| Household Income | With Coverage | Without Coverage |
| Under $25,000 | 4,350 (93.6%) | 298 (6.4%) |
| $25,000 to $49,999 | 8,406 (89.2%) | 1,016 (10.8%) |
| $50,000 to $74,999 | 11,529 (91.7%) | 1,048 (8.3%) |
| $75,000 to $99,999 | 7,694 (96.5%) | 276 (3.5%) |
| $100,000 and over | 13,871 (97.0%) | 424 (3.0%) |
Public vs Private Health Insurance Coverage by Age in Sheboygan
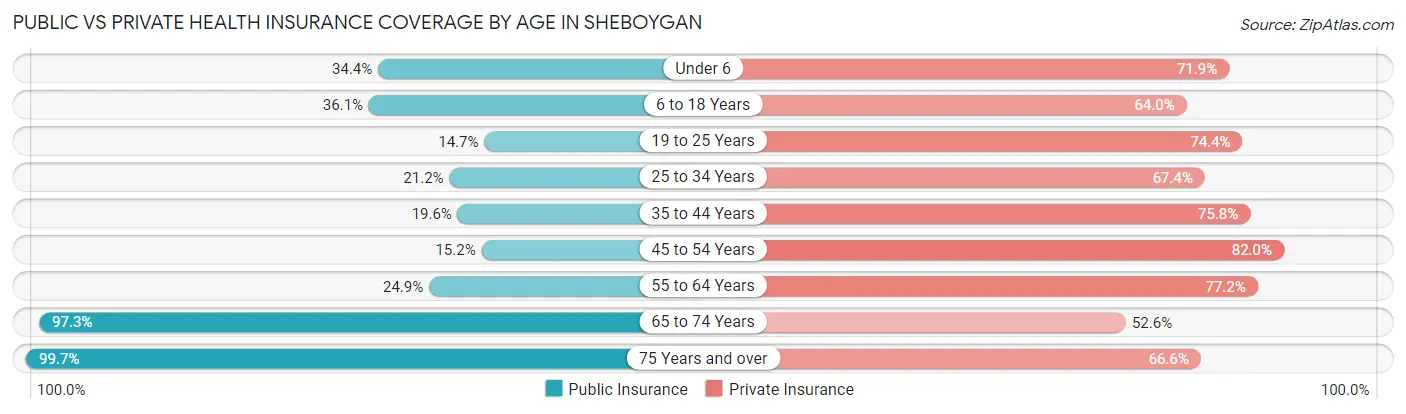
| Age Bracket | Public Insurance | Private Insurance |
| Under 6 | 1,448 (34.4%) | 3,027 (71.9%) |
| 6 to 18 Years | 3,053 (36.1%) | 5,414 (64.0%) |
| 19 to 25 Years | 707 (14.7%) | 3,581 (74.4%) |
| 25 to 34 Years | 1,193 (21.1%) | 3,799 (67.4%) |
| 35 to 44 Years | 1,364 (19.6%) | 5,272 (75.8%) |
| 45 to 54 Years | 885 (15.2%) | 4,779 (82.0%) |
| 55 to 64 Years | 1,473 (24.9%) | 4,559 (77.2%) |
| 65 to 74 Years | 4,212 (97.3%) | 2,275 (52.6%) |
| 75 Years and over | 2,960 (99.7%) | 1,978 (66.6%) |
| Total | 17,295 (35.2%) | 34,684 (70.6%) |
Disability Status by Sex by Age in Sheboygan
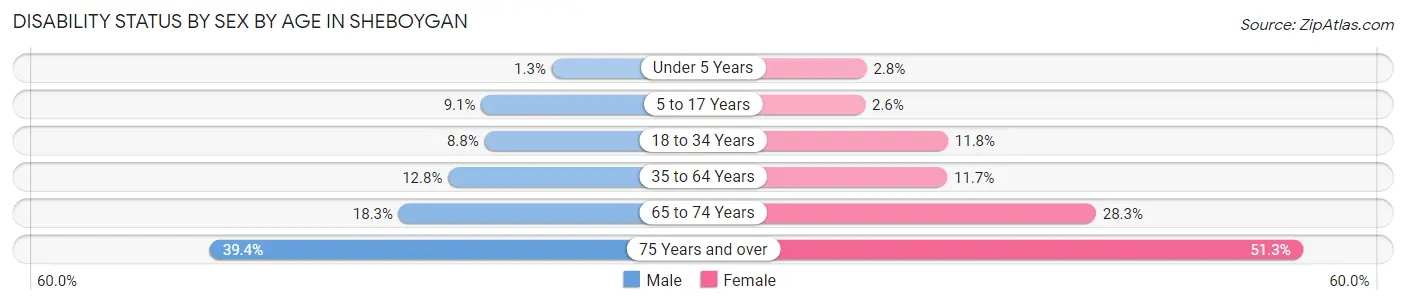
| Age Bracket | Male | Female |
| Under 5 Years | 22 (1.3%) | 47 (2.8%) |
| 5 to 17 Years | 432 (9.1%) | 103 (2.6%) |
| 18 to 34 Years | 478 (8.8%) | 657 (11.8%) |
| 35 to 64 Years | 1,254 (12.8%) | 1,044 (11.7%) |
| 65 to 74 Years | 409 (18.3%) | 593 (28.3%) |
| 75 Years and over | 472 (39.4%) | 908 (51.3%) |
Disability Class by Sex by Age in Sheboygan
Disability Class: Hearing Difficulty
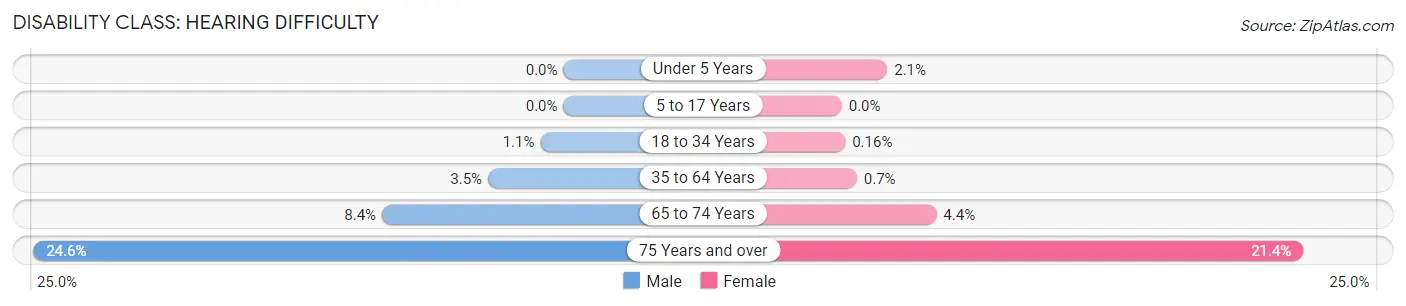
| Age Bracket | Male | Female |
| Under 5 Years | 0 (0.0%) | 36 (2.1%) |
| 5 to 17 Years | 0 (0.0%) | 0 (0.0%) |
| 18 to 34 Years | 58 (1.1%) | 9 (0.2%) |
| 35 to 64 Years | 342 (3.5%) | 62 (0.7%) |
| 65 to 74 Years | 188 (8.4%) | 92 (4.4%) |
| 75 Years and over | 295 (24.6%) | 379 (21.4%) |
Disability Class: Vision Difficulty
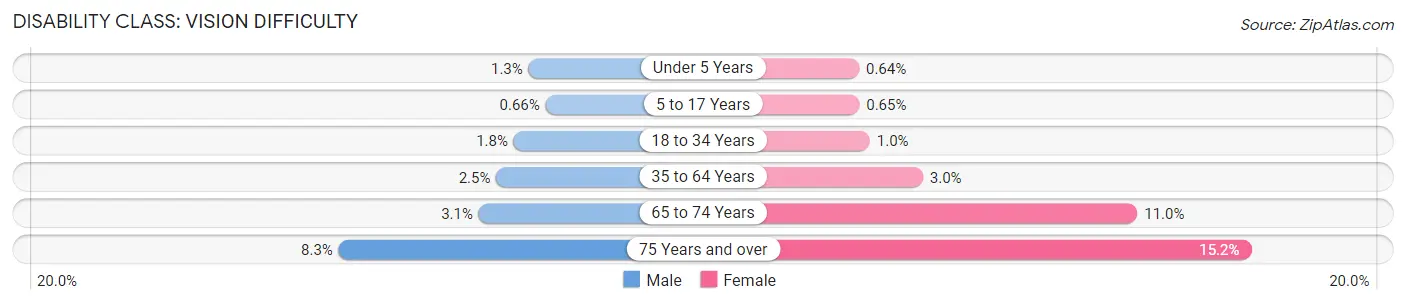
| Age Bracket | Male | Female |
| Under 5 Years | 22 (1.3%) | 11 (0.6%) |
| 5 to 17 Years | 31 (0.7%) | 26 (0.6%) |
| 18 to 34 Years | 100 (1.8%) | 58 (1.0%) |
| 35 to 64 Years | 244 (2.5%) | 268 (3.0%) |
| 65 to 74 Years | 70 (3.1%) | 230 (11.0%) |
| 75 Years and over | 100 (8.3%) | 269 (15.2%) |
Disability Class: Cognitive Difficulty

| Age Bracket | Male | Female |
| 5 to 17 Years | 327 (6.9%) | 41 (1.0%) |
| 18 to 34 Years | 335 (6.2%) | 525 (9.4%) |
| 35 to 64 Years | 531 (5.4%) | 403 (4.5%) |
| 65 to 74 Years | 39 (1.8%) | 134 (6.4%) |
| 75 Years and over | 80 (6.7%) | 118 (6.7%) |
Disability Class: Ambulatory Difficulty
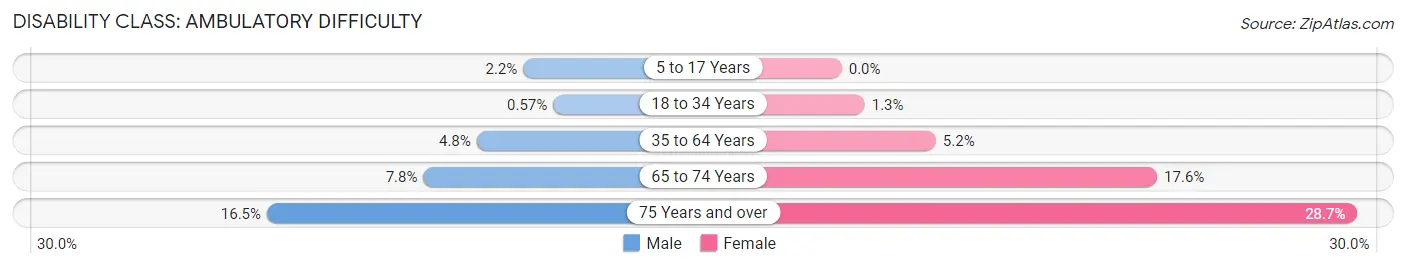
| Age Bracket | Male | Female |
| 5 to 17 Years | 106 (2.2%) | 0 (0.0%) |
| 18 to 34 Years | 31 (0.6%) | 71 (1.3%) |
| 35 to 64 Years | 473 (4.8%) | 467 (5.2%) |
| 65 to 74 Years | 174 (7.8%) | 368 (17.6%) |
| 75 Years and over | 198 (16.5%) | 508 (28.7%) |
Disability Class: Self-Care Difficulty
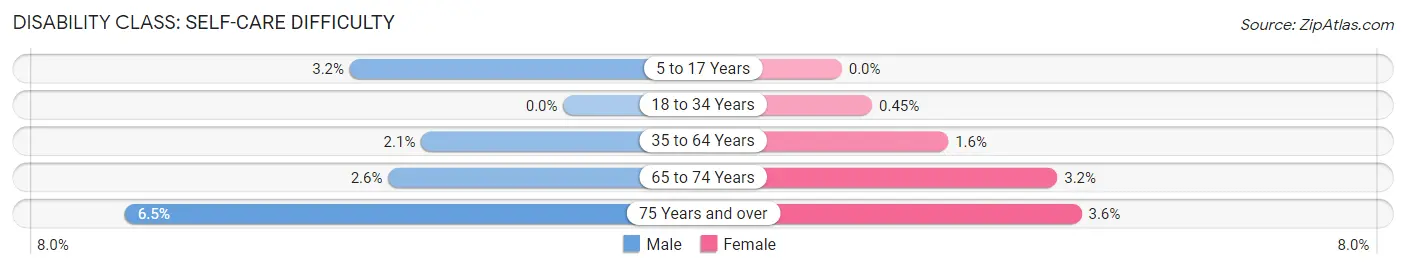
| Age Bracket | Male | Female |
| 5 to 17 Years | 150 (3.2%) | 0 (0.0%) |
| 18 to 34 Years | 0 (0.0%) | 25 (0.4%) |
| 35 to 64 Years | 206 (2.1%) | 141 (1.6%) |
| 65 to 74 Years | 58 (2.6%) | 67 (3.2%) |
| 75 Years and over | 78 (6.5%) | 63 (3.6%) |
Technology Access in Sheboygan
Computing Device Access in Sheboygan
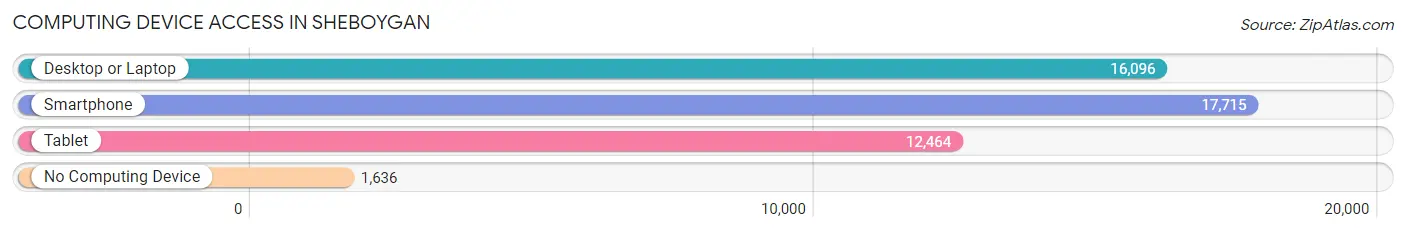
| Device Type | # Households | % Households |
| Desktop or Laptop | 16,096 | 76.5% |
| Smartphone | 17,715 | 84.2% |
| Tablet | 12,464 | 59.2% |
| No Computing Device | 1,636 | 7.8% |
| Total | 21,046 | 100.0% |
Internet Access in Sheboygan
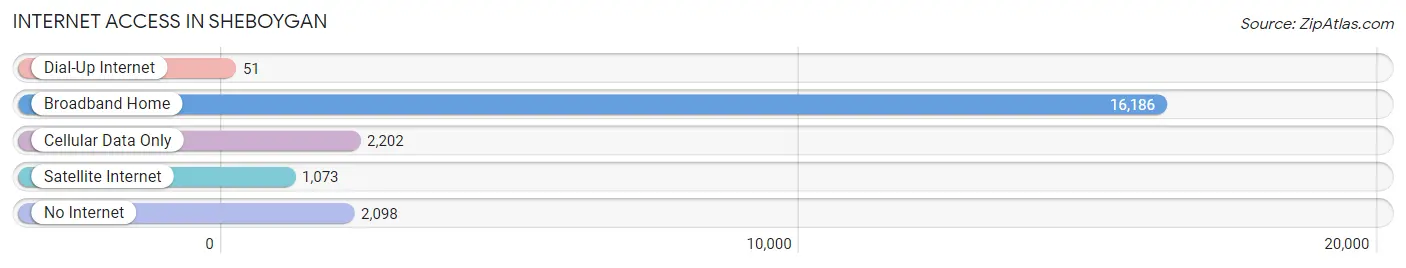
| Internet Type | # Households | % Households |
| Dial-Up Internet | 51 | 0.2% |
| Broadband Home | 16,186 | 76.9% |
| Cellular Data Only | 2,202 | 10.5% |
| Satellite Internet | 1,073 | 5.1% |
| No Internet | 2,098 | 10.0% |
| Total | 21,046 | 100.0% |
Sheboygan Summary
Sheboygan, Wisconsin is a city located in Sheboygan County in the southeastern corner of the state. It is situated on the western shore of Lake Michigan, about 50 miles north of Milwaukee and 90 miles south of Green Bay. The city has a population of approximately 50,000 people and is the county seat of Sheboygan County.
History
The area that is now Sheboygan was first inhabited by Native Americans, including the Potawatomi, Menominee, and Winnebago tribes. The first European settlers arrived in the area in the early 1800s, and the city was officially founded in 1846. The city was named after the Sheboygan River, which was named by the Potawatomi for the “noisy water” of the river.
The city quickly grew in the late 1800s and early 1900s, becoming an important port city and industrial center. The city was home to several large factories, including the Kohler Company, which is still in operation today. The city also became a popular tourist destination, with many visitors coming to enjoy the city’s beaches and other attractions.
Geography
Sheboygan is located in the southeastern corner of Wisconsin, on the western shore of Lake Michigan. The city is situated on the Sheboygan River, which flows into the lake. The city is surrounded by several small towns and villages, including Kohler, Oostburg, and Cedar Grove. The city is also close to several larger cities, including Milwaukee, Green Bay, and Madison.
The city has a total area of 16.3 square miles, of which 15.7 square miles is land and 0.6 square miles is water. The city has a humid continental climate, with cold winters and warm summers.
Economy
Sheboygan’s economy is largely based on manufacturing and tourism. The city is home to several large companies, including the Kohler Company, which manufactures plumbing fixtures and other products. The city is also home to several smaller companies, including several food processing plants and a number of smaller manufacturing companies.
The city is also a popular tourist destination, with many visitors coming to enjoy the city’s beaches and other attractions. The city is home to several festivals and events throughout the year, including the Sheboygan County Fair and the Sheboygan Bratwurst Festival.
Demographics
As of the 2010 census, Sheboygan had a population of 49,288 people. The racial makeup of the city was 90.2% White, 2.3% African American, 0.7% Native American, 2.2% Asian, 0.1% Pacific Islander, 2.7% from other races, and 2.7% from two or more races. Hispanic or Latino of any race were 6.2% of the population.
The median household income in Sheboygan was $45,945, and the median family income was $55,945. The per capita income for the city was $24,945. About 8.2% of families and 11.2% of the population were below the poverty line, including 15.2% of those under age 18 and 8.2% of those age 65 or over.
Common Questions
What is Per Capita Income in Sheboygan?
Per Capita income in Sheboygan is $31,290.
What is the Median Family Income in Sheboygan?
Median Family Income in Sheboygan is $72,962.
What is the Median Household income in Sheboygan?
Median Household Income in Sheboygan is $59,861.
What is Income or Wage Gap in Sheboygan?
Income or Wage Gap in Sheboygan is 27.4%.
Women in Sheboygan earn 72.6 cents for every dollar earned by a man.
What is Family Income Deficit in Sheboygan?
Family Income Deficit in Sheboygan is $11,150.
Families that are below poverty line in Sheboygan earn $11,150 less on average than the poverty threshold level.
What is Inequality or Gini Index in Sheboygan?
Inequality or Gini Index in Sheboygan is 0.39.
What is the Total Population of Sheboygan?
Total Population of Sheboygan is 49,805.
What is the Total Male Population of Sheboygan?
Total Male Population of Sheboygan is 25,498.
What is the Total Female Population of Sheboygan?
Total Female Population of Sheboygan is 24,307.
What is the Ratio of Males per 100 Females in Sheboygan?
There are 104.90 Males per 100 Females in Sheboygan.
What is the Ratio of Females per 100 Males in Sheboygan?
There are 95.33 Females per 100 Males in Sheboygan.
What is the Median Population Age in Sheboygan?
Median Population Age in Sheboygan is 37.0 Years.
What is the Average Family Size in Sheboygan
Average Family Size in Sheboygan is 3.2 People.
What is the Average Household Size in Sheboygan
Average Household Size in Sheboygan is 2.3 People.
How Large is the Labor Force in Sheboygan?
There are 26,542 People in the Labor Forcein in Sheboygan.
What is the Percentage of People in the Labor Force in Sheboygan?
68.2% of People are in the Labor Force in Sheboygan.
What is the Unemployment Rate in Sheboygan?
Unemployment Rate in Sheboygan is 3.4%.