Eau Claire, WI Map & Demographics
Eau Claire Map
Eau Claire Overview
$35,925
PER CAPITA INCOME
$93,916
AVG FAMILY INCOME
$63,882
AVG HOUSEHOLD INCOME
35.1%
WAGE / INCOME GAP [ % ]
64.9¢/ $1
WAGE / INCOME GAP [ $ ]
$10,473
FAMILY INCOME DEFICIT
0.43
INEQUALITY / GINI INDEX
69,098
TOTAL POPULATION
33,133
MALE POPULATION
35,965
FEMALE POPULATION
92.13
MALES / 100 FEMALES
108.55
FEMALES / 100 MALES
32.8
MEDIAN AGE
2.9
AVG FAMILY SIZE
2.3
AVG HOUSEHOLD SIZE
40,468
LABOR FORCE [ PEOPLE ]
69.5%
PERCENT IN LABOR FORCE
3.6%
UNEMPLOYMENT RATE
Income in Eau Claire
Income Overview in Eau Claire
Per Capita Income in Eau Claire is $35,925, while median incomes of families and households are $93,916 and $63,882 respectively.
| Characteristic | Number | Measure |
| Per Capita Income | 69,098 | $35,925 |
| Median Family Income | 14,851 | $93,916 |
| Mean Family Income | 14,851 | $111,464 |
| Median Household Income | 28,832 | $63,882 |
| Mean Household Income | 28,832 | $83,468 |
| Income Deficit | 14,851 | $10,473 |
| Wage / Income Gap (%) | 69,098 | 35.12% |
| Wage / Income Gap ($) | 69,098 | 64.88¢ per $1 |
| Gini / Inequality Index | 69,098 | 0.43 |
Earnings by Sex in Eau Claire
Average Earnings in Eau Claire are $32,830, $40,452 for men and $26,247 for women, a difference of 35.1%.
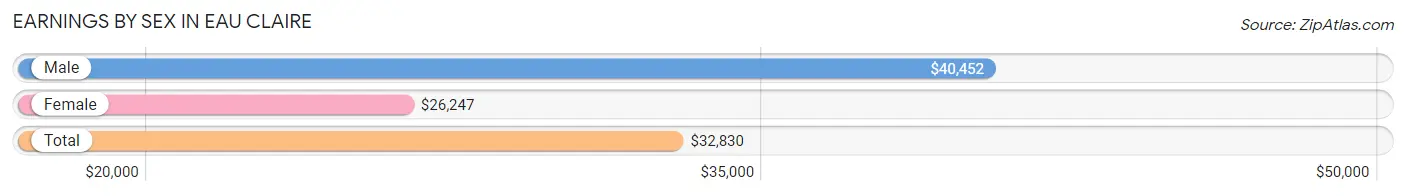
| Sex | Number | Average Earnings |
| Male | 22,157 (50.2%) | $40,452 |
| Female | 22,014 (49.8%) | $26,247 |
| Total | 44,171 (100.0%) | $32,830 |
Earnings by Sex by Income Bracket in Eau Claire
The most common earnings brackets in Eau Claire are $100,000+ for men (2,115 | 9.6%) and $2,499 or less for women (1,835 | 8.3%).
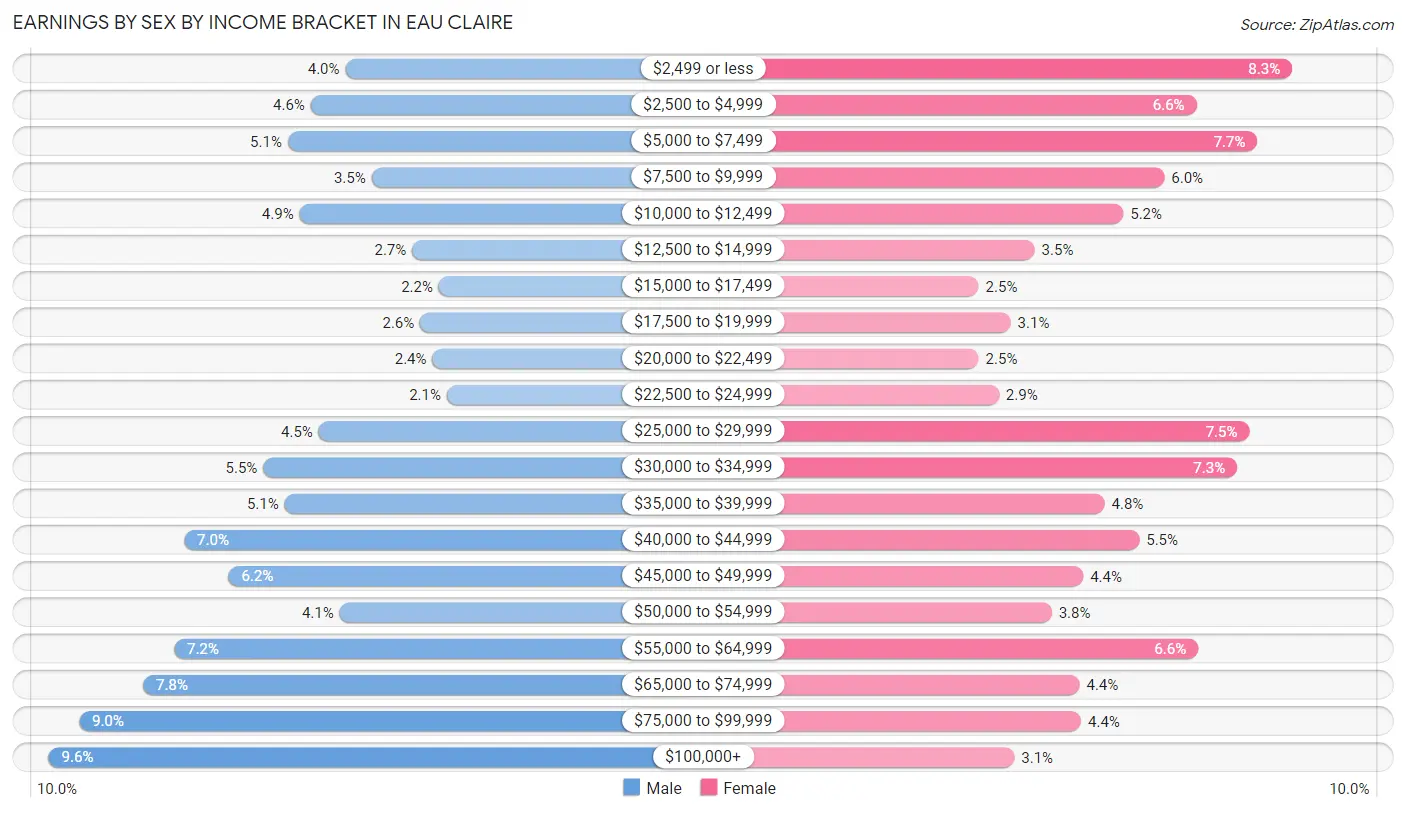
| Income | Male | Female |
| $2,499 or less | 883 (4.0%) | 1,835 (8.3%) |
| $2,500 to $4,999 | 1,029 (4.6%) | 1,442 (6.6%) |
| $5,000 to $7,499 | 1,123 (5.1%) | 1,693 (7.7%) |
| $7,500 to $9,999 | 775 (3.5%) | 1,310 (5.9%) |
| $10,000 to $12,499 | 1,074 (4.9%) | 1,140 (5.2%) |
| $12,500 to $14,999 | 608 (2.7%) | 775 (3.5%) |
| $15,000 to $17,499 | 497 (2.2%) | 544 (2.5%) |
| $17,500 to $19,999 | 573 (2.6%) | 675 (3.1%) |
| $20,000 to $22,499 | 524 (2.4%) | 544 (2.5%) |
| $22,500 to $24,999 | 462 (2.1%) | 627 (2.9%) |
| $25,000 to $29,999 | 994 (4.5%) | 1,659 (7.5%) |
| $30,000 to $34,999 | 1,225 (5.5%) | 1,610 (7.3%) |
| $35,000 to $39,999 | 1,136 (5.1%) | 1,063 (4.8%) |
| $40,000 to $44,999 | 1,554 (7.0%) | 1,207 (5.5%) |
| $45,000 to $49,999 | 1,369 (6.2%) | 976 (4.4%) |
| $50,000 to $54,999 | 908 (4.1%) | 846 (3.8%) |
| $55,000 to $64,999 | 1,595 (7.2%) | 1,449 (6.6%) |
| $65,000 to $74,999 | 1,724 (7.8%) | 960 (4.4%) |
| $75,000 to $99,999 | 1,989 (9.0%) | 967 (4.4%) |
| $100,000+ | 2,115 (9.6%) | 692 (3.1%) |
| Total | 22,157 (100.0%) | 22,014 (100.0%) |
Earnings by Sex by Educational Attainment in Eau Claire
Average earnings in Eau Claire are $51,360 for men and $37,218 for women, a difference of 27.5%. Men with an educational attainment of bachelor's degree enjoy the highest average annual earnings of $67,976, while those with less than high school education earn the least with $32,889. Women with an educational attainment of graduate degree earn the most with the average annual earnings of $63,051, while those with high school diploma education have the smallest earnings of $27,053.
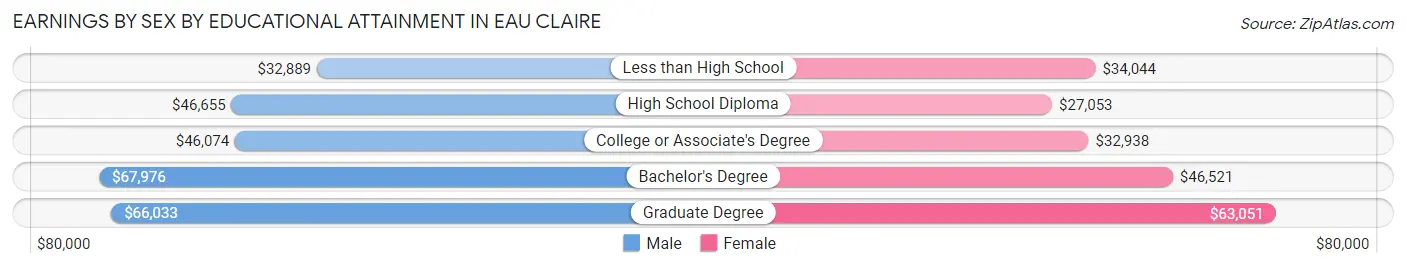
| Educational Attainment | Male Income | Female Income |
| Less than High School | $32,889 | $34,044 |
| High School Diploma | $46,655 | $27,053 |
| College or Associate's Degree | $46,074 | $32,938 |
| Bachelor's Degree | $67,976 | $46,521 |
| Graduate Degree | $66,033 | $63,051 |
| Total | $51,360 | $37,218 |
Family Income in Eau Claire
Family Income Brackets in Eau Claire
According to the Eau Claire family income data, there are 4,010 families falling into the $100,000 to $149,999 income range, which is the most common income bracket and makes up 27.0% of all families. Conversely, the less than $10,000 income bracket is the least frequent group with only 208 families (1.4%) belonging to this category.
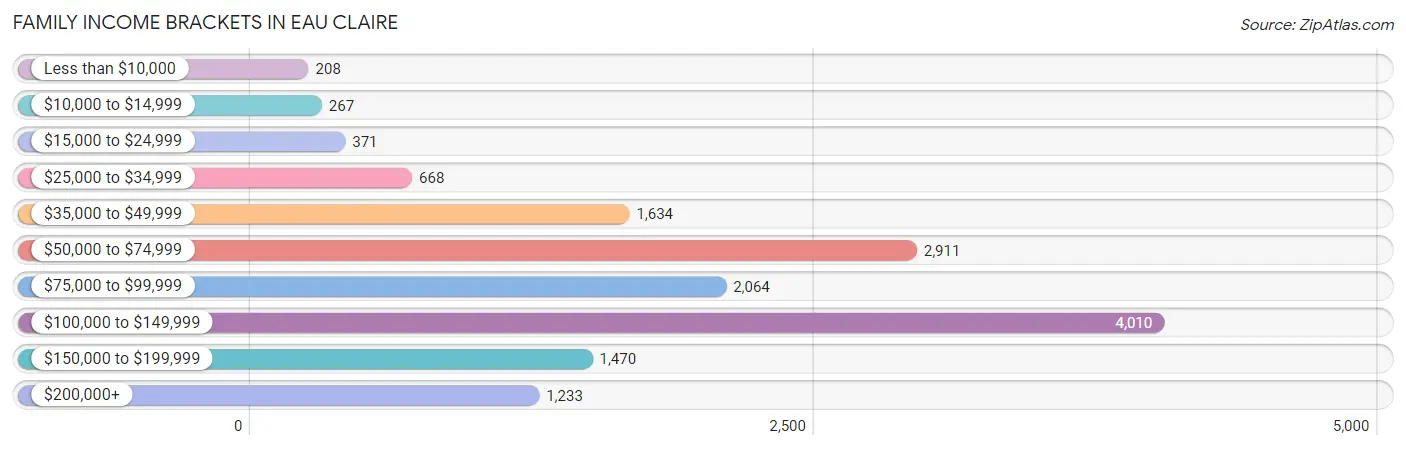
| Income Bracket | # Families | % Families |
| Less than $10,000 | 208 | 1.4% |
| $10,000 to $14,999 | 267 | 1.8% |
| $15,000 to $24,999 | 371 | 2.5% |
| $25,000 to $34,999 | 668 | 4.5% |
| $35,000 to $49,999 | 1,634 | 11.0% |
| $50,000 to $74,999 | 2,911 | 19.6% |
| $75,000 to $99,999 | 2,064 | 13.9% |
| $100,000 to $149,999 | 4,010 | 27.0% |
| $150,000 to $199,999 | 1,470 | 9.9% |
| $200,000+ | 1,233 | 8.3% |
Family Income by Famaliy Size in Eau Claire
4-person families (2,269 | 15.3%) account for the highest median family income in Eau Claire with $117,920 per family, while 2-person families (8,009 | 53.9%) have the highest median income of $40,914 per family member.
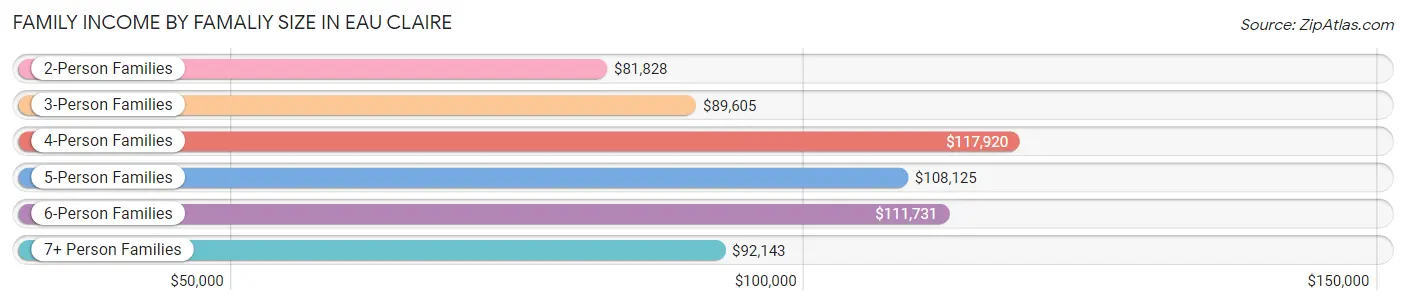
| Income Bracket | # Families | Median Income |
| 2-Person Families | 8,009 (53.9%) | $81,828 |
| 3-Person Families | 3,114 (21.0%) | $89,605 |
| 4-Person Families | 2,269 (15.3%) | $117,920 |
| 5-Person Families | 1,033 (7.0%) | $108,125 |
| 6-Person Families | 282 (1.9%) | $111,731 |
| 7+ Person Families | 144 (1.0%) | $92,143 |
| Total | 14,851 (100.0%) | $93,916 |
Family Income by Number of Earners in Eau Claire
The median family income in Eau Claire is $93,916, with families comprising 3+ earners (1,289) having the highest median family income of $123,880, while families with no earners (1,962) have the lowest median family income of $57,213, accounting for 8.7% and 13.2% of families, respectively.
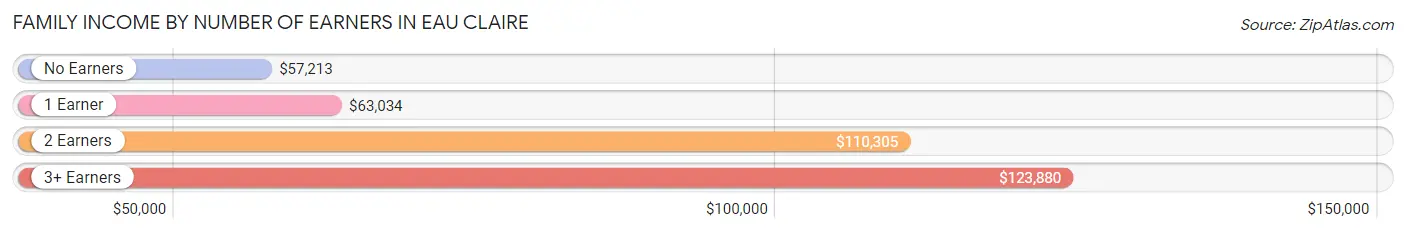
| Number of Earners | # Families | Median Income |
| No Earners | 1,962 (13.2%) | $57,213 |
| 1 Earner | 4,365 (29.4%) | $63,034 |
| 2 Earners | 7,235 (48.7%) | $110,305 |
| 3+ Earners | 1,289 (8.7%) | $123,880 |
| Total | 14,851 (100.0%) | $93,916 |
Household Income in Eau Claire
Household Income Brackets in Eau Claire
With 6,314 households falling in the category, the $50,000 to $74,999 income range is the most frequent in Eau Claire, accounting for 21.9% of all households. In contrast, only 980 households (3.4%) fall into the $10,000 to $14,999 income bracket, making it the least populous group.
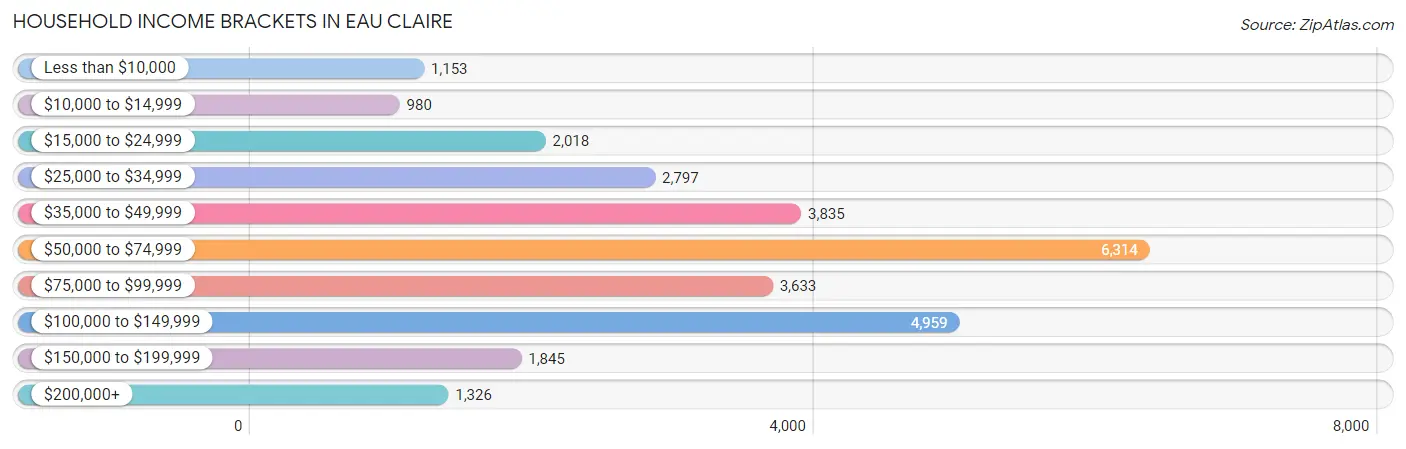
| Income Bracket | # Households | % Households |
| Less than $10,000 | 1,153 | 4.0% |
| $10,000 to $14,999 | 980 | 3.4% |
| $15,000 to $24,999 | 2,018 | 7.0% |
| $25,000 to $34,999 | 2,797 | 9.7% |
| $35,000 to $49,999 | 3,835 | 13.3% |
| $50,000 to $74,999 | 6,314 | 21.9% |
| $75,000 to $99,999 | 3,633 | 12.6% |
| $100,000 to $149,999 | 4,959 | 17.2% |
| $150,000 to $199,999 | 1,845 | 6.4% |
| $200,000+ | 1,326 | 4.6% |
Household Income by Householder Age in Eau Claire
The median household income in Eau Claire is $63,882, with the highest median household income of $80,665 found in the 45 to 64 years age bracket for the primary householder. A total of 8,056 households (27.9%) fall into this category. Meanwhile, the 15 to 24 years age bracket for the primary householder has the lowest median household income of $34,703, with 3,556 households (12.3%) in this group.
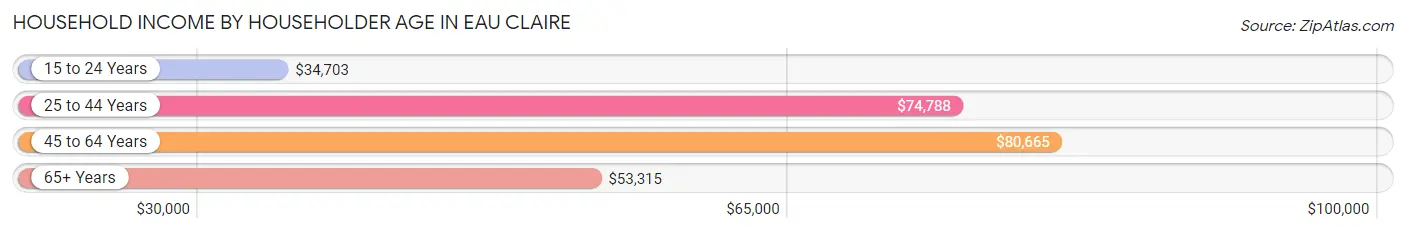
| Income Bracket | # Households | Median Income |
| 15 to 24 Years | 3,556 (12.3%) | $34,703 |
| 25 to 44 Years | 9,602 (33.3%) | $74,788 |
| 45 to 64 Years | 8,056 (27.9%) | $80,665 |
| 65+ Years | 7,618 (26.4%) | $53,315 |
| Total | 28,832 (100.0%) | $63,882 |
Poverty in Eau Claire
Income Below Poverty by Sex and Age in Eau Claire
With 13.2% poverty level for males and 16.7% for females among the residents of Eau Claire, 18 to 24 year old males and 18 to 24 year old females are the most vulnerable to poverty, with 2,011 males (37.1%) and 3,190 females (53.3%) in their respective age groups living below the poverty level.
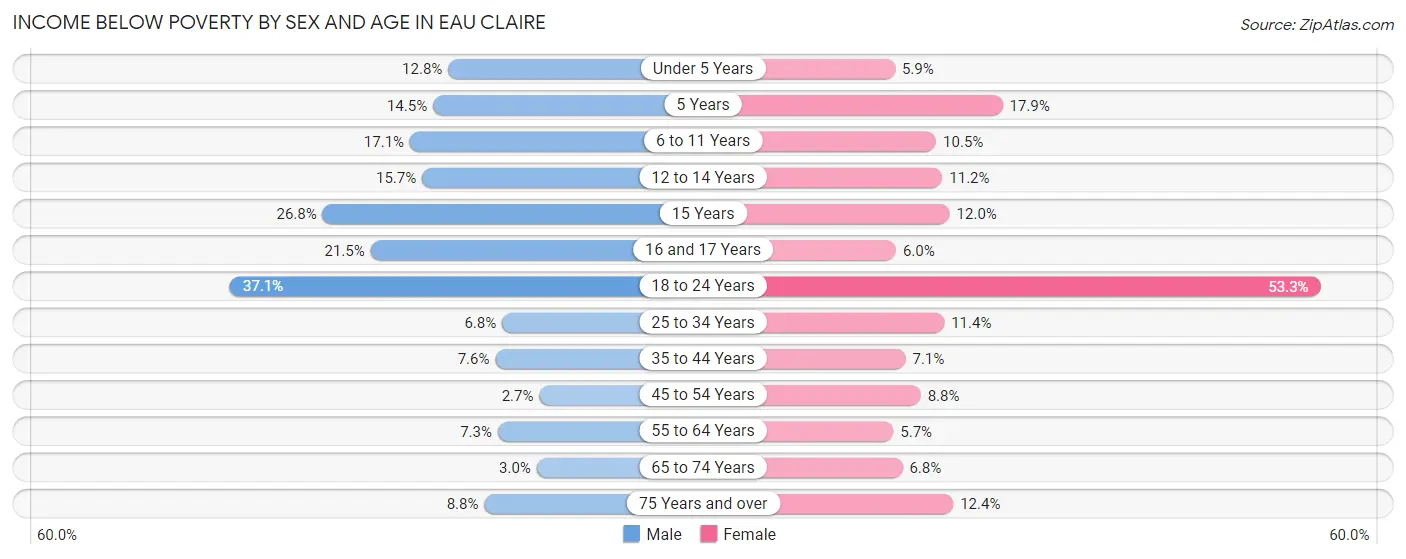
| Age Bracket | Male | Female |
| Under 5 Years | 206 (12.8%) | 99 (5.9%) |
| 5 Years | 62 (14.5%) | 75 (17.9%) |
| 6 to 11 Years | 306 (17.1%) | 230 (10.5%) |
| 12 to 14 Years | 179 (15.7%) | 93 (11.2%) |
| 15 Years | 70 (26.8%) | 43 (12.0%) |
| 16 and 17 Years | 123 (21.5%) | 41 (6.0%) |
| 18 to 24 Years | 2,011 (37.1%) | 3,190 (53.3%) |
| 25 to 34 Years | 349 (6.8%) | 558 (11.4%) |
| 35 to 44 Years | 300 (7.6%) | 271 (7.1%) |
| 45 to 54 Years | 91 (2.7%) | 285 (8.8%) |
| 55 to 64 Years | 246 (7.3%) | 208 (5.7%) |
| 65 to 74 Years | 90 (3.0%) | 231 (6.8%) |
| 75 Years and over | 154 (8.8%) | 339 (12.4%) |
| Total | 4,187 (13.2%) | 5,663 (16.7%) |
Income Above Poverty by Sex and Age in Eau Claire
According to the poverty statistics in Eau Claire, males aged 45 to 54 years and females aged 55 to 64 years are the age groups that are most secure financially, with 97.3% of males and 94.3% of females in these age groups living above the poverty line.
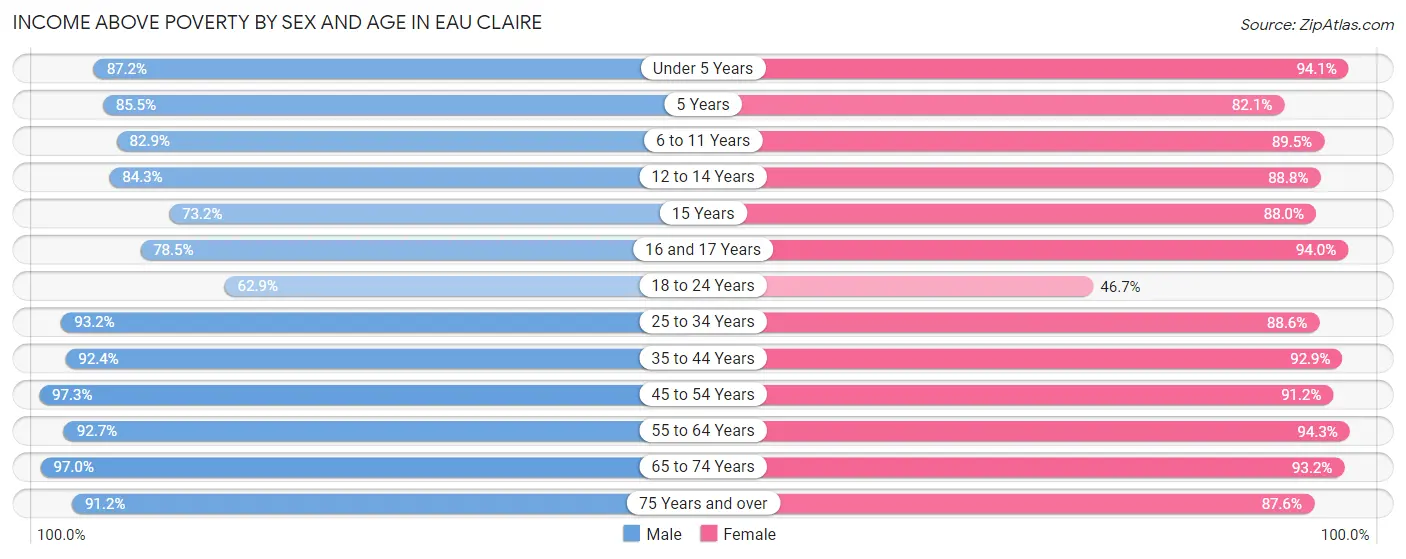
| Age Bracket | Male | Female |
| Under 5 Years | 1,400 (87.2%) | 1,574 (94.1%) |
| 5 Years | 365 (85.5%) | 344 (82.1%) |
| 6 to 11 Years | 1,484 (82.9%) | 1,958 (89.5%) |
| 12 to 14 Years | 958 (84.3%) | 737 (88.8%) |
| 15 Years | 191 (73.2%) | 315 (88.0%) |
| 16 and 17 Years | 450 (78.5%) | 639 (94.0%) |
| 18 to 24 Years | 3,405 (62.9%) | 2,795 (46.7%) |
| 25 to 34 Years | 4,759 (93.2%) | 4,332 (88.6%) |
| 35 to 44 Years | 3,657 (92.4%) | 3,544 (92.9%) |
| 45 to 54 Years | 3,304 (97.3%) | 2,958 (91.2%) |
| 55 to 64 Years | 3,123 (92.7%) | 3,414 (94.3%) |
| 65 to 74 Years | 2,937 (97.0%) | 3,186 (93.2%) |
| 75 Years and over | 1,596 (91.2%) | 2,393 (87.6%) |
| Total | 27,629 (86.8%) | 28,189 (83.3%) |
Income Below Poverty Among Married-Couple Families in Eau Claire
The poverty statistics for married-couple families in Eau Claire show that 3.2% or 364 of the total 11,500 families live below the poverty line. Families with 3 or 4 children have the highest poverty rate of 13.3%, comprising of 96 families. On the other hand, families with 5 or more children have the lowest poverty rate of 0.0%, which includes 0 families.
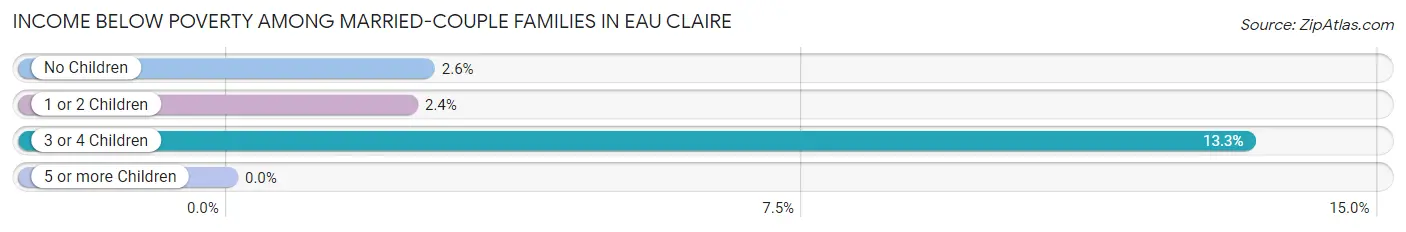
| Children | Above Poverty | Below Poverty |
| No Children | 6,926 (97.4%) | 183 (2.6%) |
| 1 or 2 Children | 3,527 (97.7%) | 85 (2.4%) |
| 3 or 4 Children | 627 (86.7%) | 96 (13.3%) |
| 5 or more Children | 56 (100.0%) | 0 (0.0%) |
| Total | 11,136 (96.8%) | 364 (3.2%) |
Income Below Poverty Among Single-Parent Households in Eau Claire
According to the poverty data in Eau Claire, 9.2% or 115 single-father households and 18.2% or 383 single-mother households are living below the poverty line. Among single-father households, those with 3 or 4 children have the highest poverty rate, with 46 households (39.7%) experiencing poverty. Likewise, among single-mother households, those with 5 or more children have the highest poverty rate, with 39 households (73.6%) falling below the poverty line.
| Children | Single Father | Single Mother |
| No Children | 0 (0.0%) | 23 (3.6%) |
| 1 or 2 Children | 69 (14.1%) | 261 (20.1%) |
| 3 or 4 Children | 46 (39.7%) | 60 (48.4%) |
| 5 or more Children | 0 (0.0%) | 39 (73.6%) |
| Total | 115 (9.2%) | 383 (18.2%) |
Income Below Poverty Among Married-Couple vs Single-Parent Households in Eau Claire
The poverty data for Eau Claire shows that 364 of the married-couple family households (3.2%) and 498 of the single-parent households (14.9%) are living below the poverty level. Within the married-couple family households, those with 3 or 4 children have the highest poverty rate, with 96 households (13.3%) falling below the poverty line. Among the single-parent households, those with 3 or 4 children have the highest poverty rate, with 106 household (44.2%) living below poverty.
| Children | Married-Couple Families | Single-Parent Households |
| No Children | 183 (2.6%) | 23 (1.9%) |
| 1 or 2 Children | 85 (2.4%) | 330 (18.5%) |
| 3 or 4 Children | 96 (13.3%) | 106 (44.2%) |
| 5 or more Children | 0 (0.0%) | 39 (29.5%) |
| Total | 364 (3.2%) | 498 (14.9%) |
Race in Eau Claire
The most populous races in Eau Claire are White / Caucasian (60,709 | 87.9%), Asian (4,165 | 6.0%), and Two or more Races (2,715 | 3.9%).
| Race | # Population | % Population |
| Asian | 4,165 | 6.0% |
| Black / African American | 970 | 1.4% |
| Hawaiian / Pacific | 45 | 0.1% |
| Hispanic or Latino | 1,860 | 2.7% |
| Native / Alaskan | 235 | 0.3% |
| White / Caucasian | 60,709 | 87.9% |
| Two or more Races | 2,715 | 3.9% |
| Some other Race | 259 | 0.4% |
| Total | 69,098 | 100.0% |
Ancestry in Eau Claire
The most populous ancestries reported in Eau Claire are German (25,676 | 37.2%), Norwegian (11,672 | 16.9%), Irish (7,873 | 11.4%), English (4,631 | 6.7%), and Polish (3,724 | 5.4%), together accounting for 77.5% of all Eau Claire residents.
| Ancestry | # Population | % Population |
| African | 31 | 0.0% |
| Albanian | 4 | 0.0% |
| Alsatian | 12 | 0.0% |
| American | 1,979 | 2.9% |
| Arab | 88 | 0.1% |
| Armenian | 61 | 0.1% |
| Australian | 31 | 0.0% |
| Austrian | 287 | 0.4% |
| Bangladeshi | 2,868 | 4.2% |
| Belgian | 174 | 0.3% |
| Bhutanese | 119 | 0.2% |
| Brazilian | 44 | 0.1% |
| British | 264 | 0.4% |
| Burmese | 109 | 0.2% |
| Canadian | 59 | 0.1% |
| Central American | 270 | 0.4% |
| Cherokee | 140 | 0.2% |
| Chippewa | 123 | 0.2% |
| Costa Rican | 4 | 0.0% |
| Creek | 20 | 0.0% |
| Croatian | 79 | 0.1% |
| Cuban | 21 | 0.0% |
| Czech | 966 | 1.4% |
| Czechoslovakian | 124 | 0.2% |
| Danish | 219 | 0.3% |
| Dominican | 4 | 0.0% |
| Dutch | 1,118 | 1.6% |
| Eastern European | 103 | 0.2% |
| English | 4,631 | 6.7% |
| European | 720 | 1.0% |
| Filipino | 16 | 0.0% |
| Finnish | 370 | 0.5% |
| French | 2,325 | 3.4% |
| French American Indian | 14 | 0.0% |
| French Canadian | 903 | 1.3% |
| German | 25,676 | 37.2% |
| German Russian | 1 | 0.0% |
| Greek | 171 | 0.3% |
| Guamanian / Chamorro | 11 | 0.0% |
| Guatemalan | 7 | 0.0% |
| Haitian | 5 | 0.0% |
| Honduran | 28 | 0.0% |
| Hungarian | 243 | 0.4% |
| Icelander | 96 | 0.1% |
| Indian (Asian) | 255 | 0.4% |
| Iranian | 96 | 0.1% |
| Irish | 7,873 | 11.4% |
| Iroquois | 46 | 0.1% |
| Italian | 2,110 | 3.0% |
| Jamaican | 5 | 0.0% |
| Japanese | 48 | 0.1% |
| Kenyan | 53 | 0.1% |
| Korean | 461 | 0.7% |
| Latvian | 23 | 0.0% |
| Lebanese | 14 | 0.0% |
| Lithuanian | 217 | 0.3% |
| Luxembourger | 19 | 0.0% |
| Malaysian | 153 | 0.2% |
| Menominee | 81 | 0.1% |
| Mexican | 1,201 | 1.7% |
| Mexican American Indian | 17 | 0.0% |
| Mongolian | 146 | 0.2% |
| Native Hawaiian | 51 | 0.1% |
| Nicaraguan | 75 | 0.1% |
| Nigerian | 3 | 0.0% |
| Northern European | 58 | 0.1% |
| Norwegian | 11,672 | 16.9% |
| Palestinian | 60 | 0.1% |
| Panamanian | 44 | 0.1% |
| Pennsylvania German | 59 | 0.1% |
| Peruvian | 7 | 0.0% |
| Polish | 3,724 | 5.4% |
| Portuguese | 207 | 0.3% |
| Puerto Rican | 169 | 0.2% |
| Romanian | 4 | 0.0% |
| Russian | 195 | 0.3% |
| Salvadoran | 112 | 0.2% |
| Scandinavian | 578 | 0.8% |
| Scotch-Irish | 246 | 0.4% |
| Scottish | 1,057 | 1.5% |
| Serbian | 6 | 0.0% |
| Sioux | 14 | 0.0% |
| Slavic | 69 | 0.1% |
| Slovak | 72 | 0.1% |
| Slovene | 54 | 0.1% |
| Somali | 24 | 0.0% |
| South American | 26 | 0.0% |
| Spaniard | 18 | 0.0% |
| Spanish | 45 | 0.1% |
| Sri Lankan | 246 | 0.4% |
| Subsaharan African | 133 | 0.2% |
| Swedish | 2,491 | 3.6% |
| Swiss | 462 | 0.7% |
| Syrian | 29 | 0.0% |
| Thai | 307 | 0.4% |
| Turkish | 42 | 0.1% |
| Ukrainian | 116 | 0.2% |
| Venezuelan | 19 | 0.0% |
| Welsh | 538 | 0.8% |
| Yugoslavian | 20 | 0.0% | View All 100 Rows |
Immigrants in Eau Claire
The most numerous immigrant groups reported in Eau Claire came from Asia (2,079 | 3.0%), South Eastern Asia (1,593 | 2.3%), Laos (543 | 0.8%), Latin America (495 | 0.7%), and Thailand (437 | 0.6%), together accounting for 7.5% of all Eau Claire residents.
| Immigration Origin | # Population | % Population |
| Africa | 21 | 0.0% |
| Albania | 4 | 0.0% |
| Asia | 2,079 | 3.0% |
| Bangladesh | 29 | 0.0% |
| Brazil | 44 | 0.1% |
| Cambodia | 48 | 0.1% |
| Canada | 53 | 0.1% |
| Caribbean | 10 | 0.0% |
| Central America | 415 | 0.6% |
| China | 176 | 0.3% |
| Eastern Africa | 18 | 0.0% |
| Eastern Asia | 247 | 0.4% |
| Eastern Europe | 31 | 0.0% |
| El Salvador | 87 | 0.1% |
| Europe | 175 | 0.3% |
| France | 13 | 0.0% |
| Germany | 50 | 0.1% |
| Greece | 28 | 0.0% |
| Guatemala | 7 | 0.0% |
| Haiti | 5 | 0.0% |
| Honduras | 20 | 0.0% |
| Hong Kong | 18 | 0.0% |
| India | 124 | 0.2% |
| Iraq | 28 | 0.0% |
| Ireland | 2 | 0.0% |
| Italy | 22 | 0.0% |
| Jamaica | 5 | 0.0% |
| Japan | 20 | 0.0% |
| Kenya | 18 | 0.0% |
| Korea | 51 | 0.1% |
| Kuwait | 12 | 0.0% |
| Laos | 543 | 0.8% |
| Latin America | 495 | 0.7% |
| Malaysia | 188 | 0.3% |
| Mexico | 219 | 0.3% |
| Nicaragua | 75 | 0.1% |
| Nigeria | 3 | 0.0% |
| Northern Europe | 31 | 0.0% |
| Pakistan | 46 | 0.1% |
| Panama | 7 | 0.0% |
| Peru | 7 | 0.0% |
| Philippines | 278 | 0.4% |
| Russia | 12 | 0.0% |
| South America | 70 | 0.1% |
| South Central Asia | 199 | 0.3% |
| South Eastern Asia | 1,593 | 2.3% |
| Southern Europe | 50 | 0.1% |
| Taiwan | 26 | 0.0% |
| Thailand | 437 | 0.6% |
| Venezuela | 19 | 0.0% |
| Vietnam | 99 | 0.1% |
| Western Africa | 3 | 0.0% |
| Western Asia | 40 | 0.1% |
| Western Europe | 63 | 0.1% | View All 54 Rows |
Sex and Age in Eau Claire
Sex and Age in Eau Claire
The most populous age groups in Eau Claire are 20 to 24 Years (4,920 | 14.8%) for men and 20 to 24 Years (5,534 | 15.4%) for women.
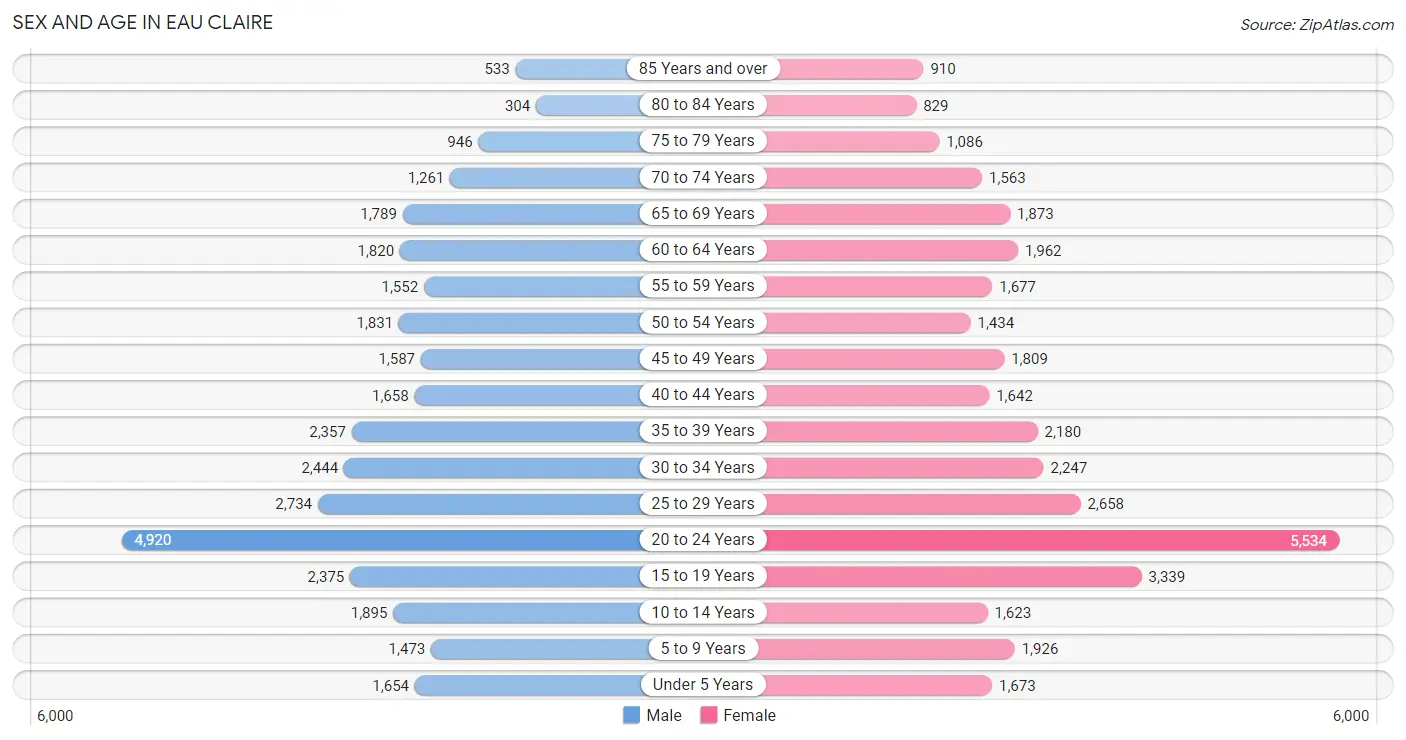
| Age Bracket | Male | Female |
| Under 5 Years | 1,654 (5.0%) | 1,673 (4.6%) |
| 5 to 9 Years | 1,473 (4.4%) | 1,926 (5.4%) |
| 10 to 14 Years | 1,895 (5.7%) | 1,623 (4.5%) |
| 15 to 19 Years | 2,375 (7.2%) | 3,339 (9.3%) |
| 20 to 24 Years | 4,920 (14.8%) | 5,534 (15.4%) |
| 25 to 29 Years | 2,734 (8.3%) | 2,658 (7.4%) |
| 30 to 34 Years | 2,444 (7.4%) | 2,247 (6.2%) |
| 35 to 39 Years | 2,357 (7.1%) | 2,180 (6.1%) |
| 40 to 44 Years | 1,658 (5.0%) | 1,642 (4.6%) |
| 45 to 49 Years | 1,587 (4.8%) | 1,809 (5.0%) |
| 50 to 54 Years | 1,831 (5.5%) | 1,434 (4.0%) |
| 55 to 59 Years | 1,552 (4.7%) | 1,677 (4.7%) |
| 60 to 64 Years | 1,820 (5.5%) | 1,962 (5.5%) |
| 65 to 69 Years | 1,789 (5.4%) | 1,873 (5.2%) |
| 70 to 74 Years | 1,261 (3.8%) | 1,563 (4.3%) |
| 75 to 79 Years | 946 (2.9%) | 1,086 (3.0%) |
| 80 to 84 Years | 304 (0.9%) | 829 (2.3%) |
| 85 Years and over | 533 (1.6%) | 910 (2.5%) |
| Total | 33,133 (100.0%) | 35,965 (100.0%) |
Families and Households in Eau Claire
Median Family Size in Eau Claire
The median family size in Eau Claire is 2.88 persons per family, with single male/father families (1,244 | 8.4%) accounting for the largest median family size of 2.94 persons per family. On the other hand, married-couple families (11,500 | 77.4%) represent the smallest median family size with 2.87 persons per family.
| Family Type | # Families | Family Size |
| Married-Couple | 11,500 (77.4%) | 2.87 |
| Single Male/Father | 1,244 (8.4%) | 2.94 |
| Single Female/Mother | 2,107 (14.2%) | 2.91 |
| Total Families | 14,851 (100.0%) | 2.88 |
Median Household Size in Eau Claire
The median household size in Eau Claire is 2.27 persons per household, with single male/father households (1,244 | 4.3%) accounting for the largest median household size of 3.4 persons per household. non-family households (13,981 | 48.5%) represent the smallest median household size with 1.51 persons per household.
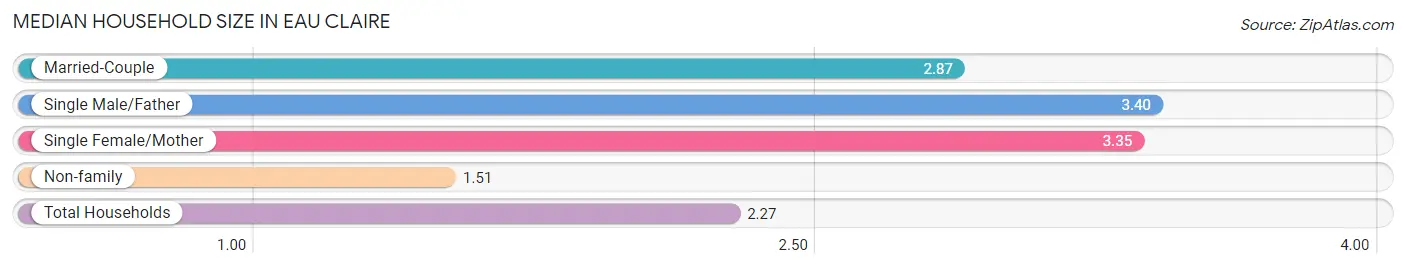
| Household Type | # Households | Household Size |
| Married-Couple | 11,500 (39.9%) | 2.87 |
| Single Male/Father | 1,244 (4.3%) | 3.40 |
| Single Female/Mother | 2,107 (7.3%) | 3.35 |
| Non-family | 13,981 (48.5%) | 1.51 |
| Total Households | 28,832 (100.0%) | 2.27 |
Household Size by Marriage Status in Eau Claire
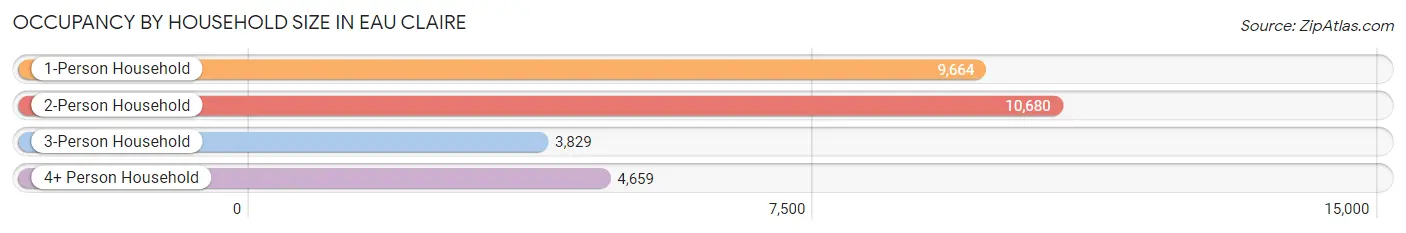
Out of a total of 28,832 households in Eau Claire, 14,851 (51.5%) are family households, while 13,981 (48.5%) are nonfamily households. The most numerous type of family households are 2-person households, comprising 7,516, and the most common type of nonfamily households are 1-person households, comprising 9,664.
| Household Size | Family Households | Nonfamily Households |
| 1-Person Households | - | 9,664 (33.5%) |
| 2-Person Households | 7,516 (26.1%) | 3,164 (11.0%) |
| 3-Person Households | 3,152 (10.9%) | 677 (2.4%) |
| 4-Person Households | 2,500 (8.7%) | 408 (1.4%) |
| 5-Person Households | 1,158 (4.0%) | 52 (0.2%) |
| 6-Person Households | 339 (1.2%) | 0 (0.0%) |
| 7+ Person Households | 186 (0.6%) | 16 (0.1%) |
| Total | 14,851 (51.5%) | 13,981 (48.5%) |
Female Fertility in Eau Claire
Fertility by Age in Eau Claire
Average fertility rate in Eau Claire is 39.0 births per 1,000 women. Women in the age bracket of 20 to 34 years have the highest fertility rate with 50.0 births per 1,000 women. Women in the age bracket of 20 to 34 years acount for 67.7% of all women with births.
| Age Bracket | Women with Births | Births / 1,000 Women |
| 15 to 19 years | 32 (4.2%) | 10.0 |
| 20 to 34 years | 521 (67.7%) | 50.0 |
| 35 to 50 years | 216 (28.1%) | 37.0 |
| Total | 769 (100.0%) | 39.0 |
Fertility by Age by Marriage Status in Eau Claire
70.0% of women with births (769) in Eau Claire are married. The highest percentage of unmarried women with births falls into 15 to 19 years age bracket with 100.0% of them unmarried at the time of birth, while the lowest percentage of unmarried women with births belong to 35 to 50 years age bracket with 0.0% of them unmarried.
| Age Bracket | Married | Unmarried |
| 15 to 19 years | 0 (0.0%) | 32 (100.0%) |
| 20 to 34 years | 322 (61.8%) | 199 (38.2%) |
| 35 to 50 years | 216 (100.0%) | 0 (0.0%) |
| Total | 538 (70.0%) | 231 (30.0%) |
Fertility by Education in Eau Claire
| Educational Attainment | Women with Births | Births / 1,000 Women |
| Less than High School | 0 (0.0%) | 0.0 |
| High School Diploma | 80 (10.4%) | 21.0 |
| College or Associate's Degree | 382 (49.7%) | 45.0 |
| Bachelor's Degree | 172 (22.4%) | 42.0 |
| Graduate Degree | 135 (17.6%) | 87.0 |
| Total | 769 (100.0%) | 39.0 |
Fertility by Education by Marriage Status in Eau Claire
30.0% of women with births in Eau Claire are unmarried. Women with the educational attainment of graduate degree are most likely to be married with 100.0% of them married at childbirth, while women with the educational attainment of high school diploma are least likely to be married with 48.7% of them unmarried at childbirth.
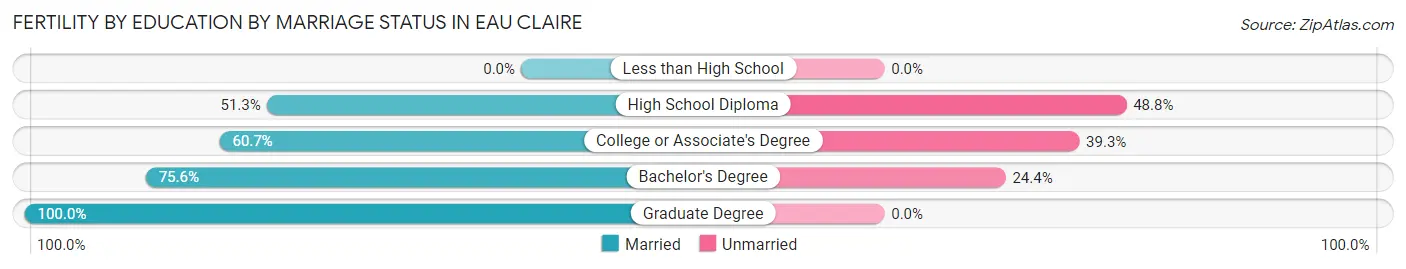
| Educational Attainment | Married | Unmarried |
| Less than High School | 0 (0.0%) | 0 (0.0%) |
| High School Diploma | 41 (51.2%) | 39 (48.7%) |
| College or Associate's Degree | 232 (60.7%) | 150 (39.3%) |
| Bachelor's Degree | 130 (75.6%) | 42 (24.4%) |
| Graduate Degree | 135 (100.0%) | 0 (0.0%) |
| Total | 538 (70.0%) | 231 (30.0%) |
Employment Characteristics in Eau Claire
Employment by Class of Employer in Eau Claire
Among the 37,997 employed individuals in Eau Claire, private company employees (26,081 | 68.6%), not-for-profit organizations (4,008 | 10.5%), and local government employees (2,623 | 6.9%) make up the most common classes of employment.
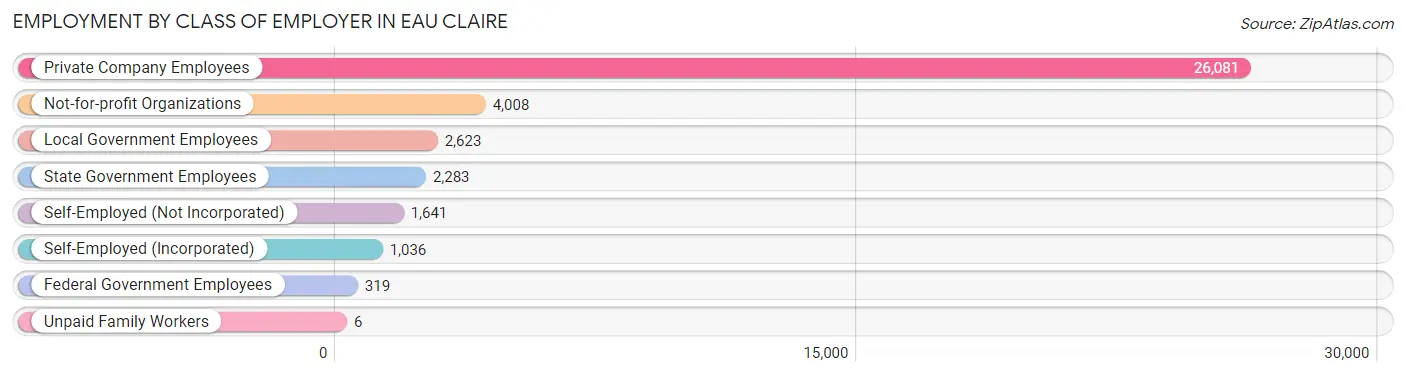
| Employer Class | # Employees | % Employees |
| Private Company Employees | 26,081 | 68.6% |
| Self-Employed (Incorporated) | 1,036 | 2.7% |
| Self-Employed (Not Incorporated) | 1,641 | 4.3% |
| Not-for-profit Organizations | 4,008 | 10.5% |
| Local Government Employees | 2,623 | 6.9% |
| State Government Employees | 2,283 | 6.0% |
| Federal Government Employees | 319 | 0.8% |
| Unpaid Family Workers | 6 | 0.0% |
| Total | 37,997 | 100.0% |
Employment Status by Age in Eau Claire
According to the labor force statistics for Eau Claire, out of the total population over 16 years of age (58,228), 69.5% or 40,468 individuals are in the labor force, with 3.6% or 1,457 of them unemployed. The age group with the highest labor force participation rate is 25 to 29 years, with 92.9% or 5,009 individuals in the labor force. Within the labor force, the 16 to 19 years age range has the highest percentage of unemployed individuals, with 9.8% or 286 of them being unemployed.
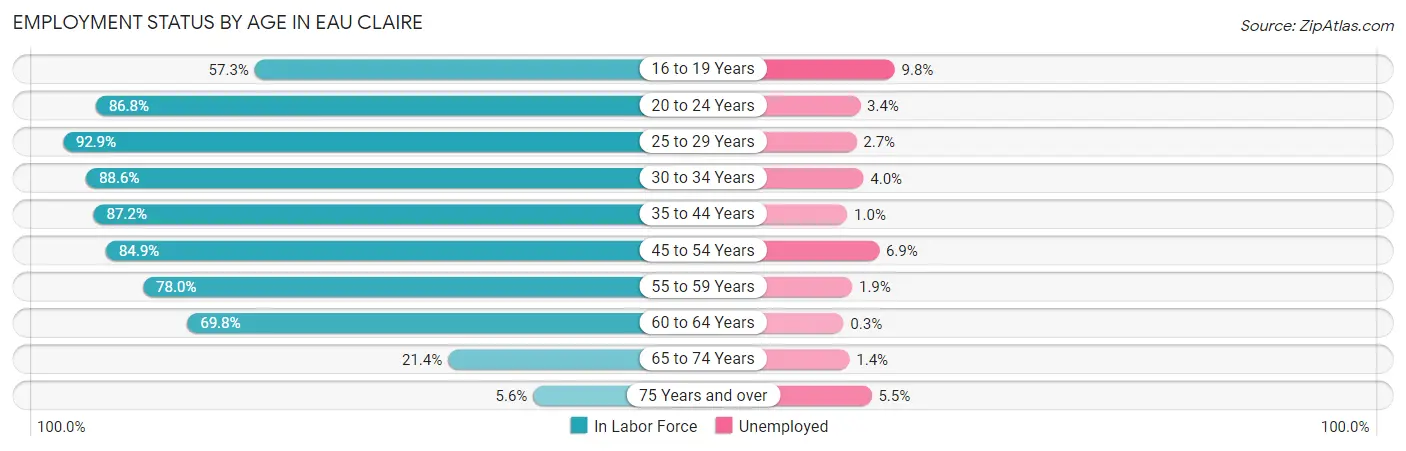
| Age Bracket | In Labor Force | Unemployed |
| 16 to 19 Years | 2,915 (57.3%) | 286 (9.8%) |
| 20 to 24 Years | 9,074 (86.8%) | 309 (3.4%) |
| 25 to 29 Years | 5,009 (92.9%) | 135 (2.7%) |
| 30 to 34 Years | 4,156 (88.6%) | 166 (4.0%) |
| 35 to 44 Years | 6,834 (87.2%) | 68 (1.0%) |
| 45 to 54 Years | 5,655 (84.9%) | 390 (6.9%) |
| 55 to 59 Years | 2,519 (78.0%) | 48 (1.9%) |
| 60 to 64 Years | 2,640 (69.8%) | 8 (0.3%) |
| 65 to 74 Years | 1,388 (21.4%) | 19 (1.4%) |
| 75 Years and over | 258 (5.6%) | 14 (5.5%) |
| Total | 40,468 (69.5%) | 1,457 (3.6%) |
Employment Status by Educational Attainment in Eau Claire
According to labor force statistics for Eau Claire, 84.9% of individuals (26,822) out of the total population between 25 and 64 years of age (31,592) are in the labor force, with 3.0% or 805 of them being unemployed. The group with the highest labor force participation rate are those with the educational attainment of bachelor's degree or higher, with 88.6% or 10,719 individuals in the labor force. Within the labor force, individuals with less than high school education have the highest percentage of unemployment, with 10.9% or 81 of them being unemployed.
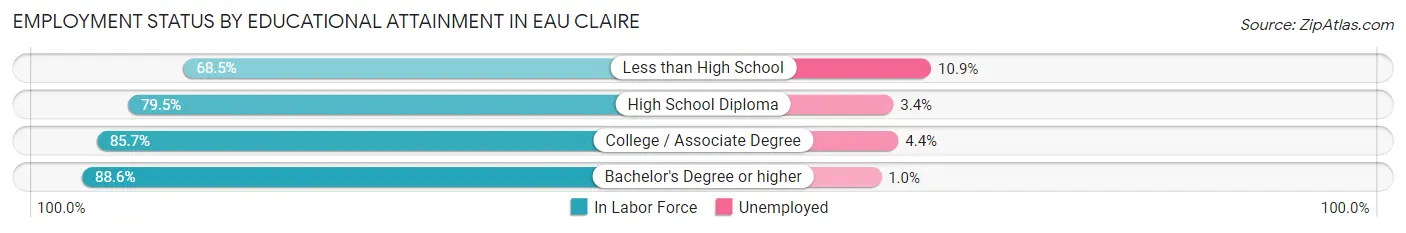
| Educational Attainment | In Labor Force | Unemployed |
| Less than High School | 740 (68.5%) | 118 (10.9%) |
| High School Diploma | 5,470 (79.5%) | 234 (3.4%) |
| College / Associate Degree | 9,884 (85.7%) | 507 (4.4%) |
| Bachelor's Degree or higher | 10,719 (88.6%) | 121 (1.0%) |
| Total | 26,822 (84.9%) | 948 (3.0%) |
Employment Occupations by Sex in Eau Claire
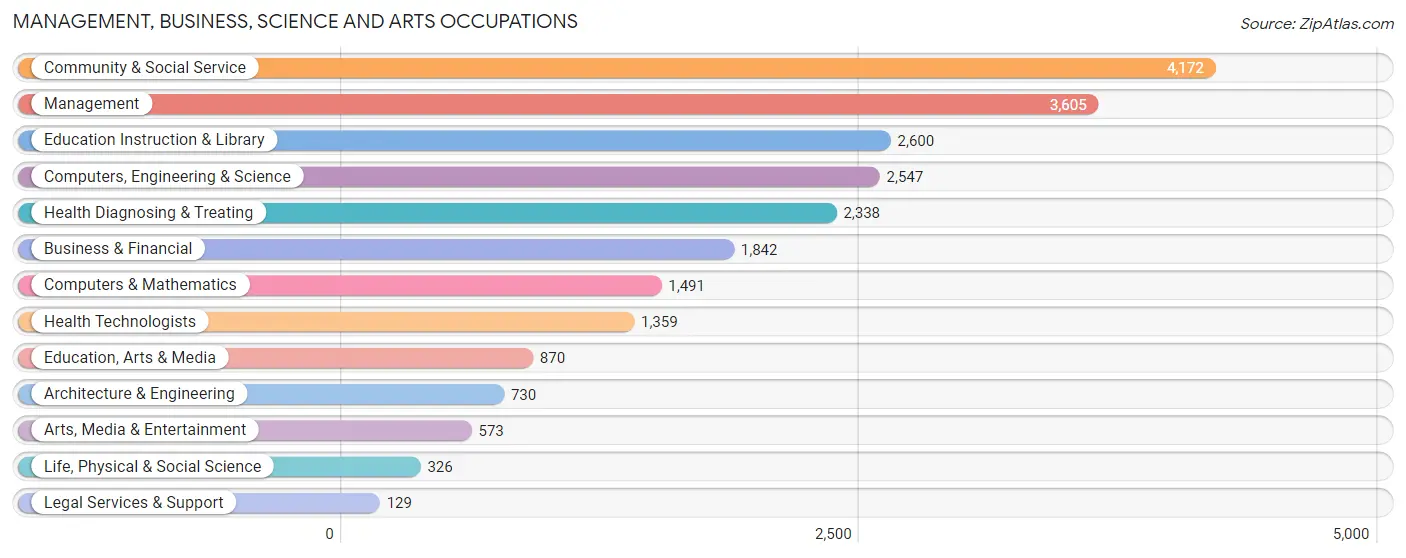
Management, Business, Science and Arts Occupations
The most common Management, Business, Science and Arts occupations in Eau Claire are Community & Social Service (4,172 | 10.7%), Management (3,605 | 9.2%), Education Instruction & Library (2,600 | 6.7%), Computers, Engineering & Science (2,547 | 6.5%), and Health Diagnosing & Treating (2,338 | 6.0%).
Management, Business, Science and Arts Occupations by Sex
Within the Management, Business, Science and Arts occupations in Eau Claire, the most male-oriented occupations are Architecture & Engineering (83.6%), Computers & Mathematics (79.5%), and Computers, Engineering & Science (77.5%), while the most female-oriented occupations are Health Diagnosing & Treating (78.4%), Health Technologists (77.0%), and Education Instruction & Library (72.1%).
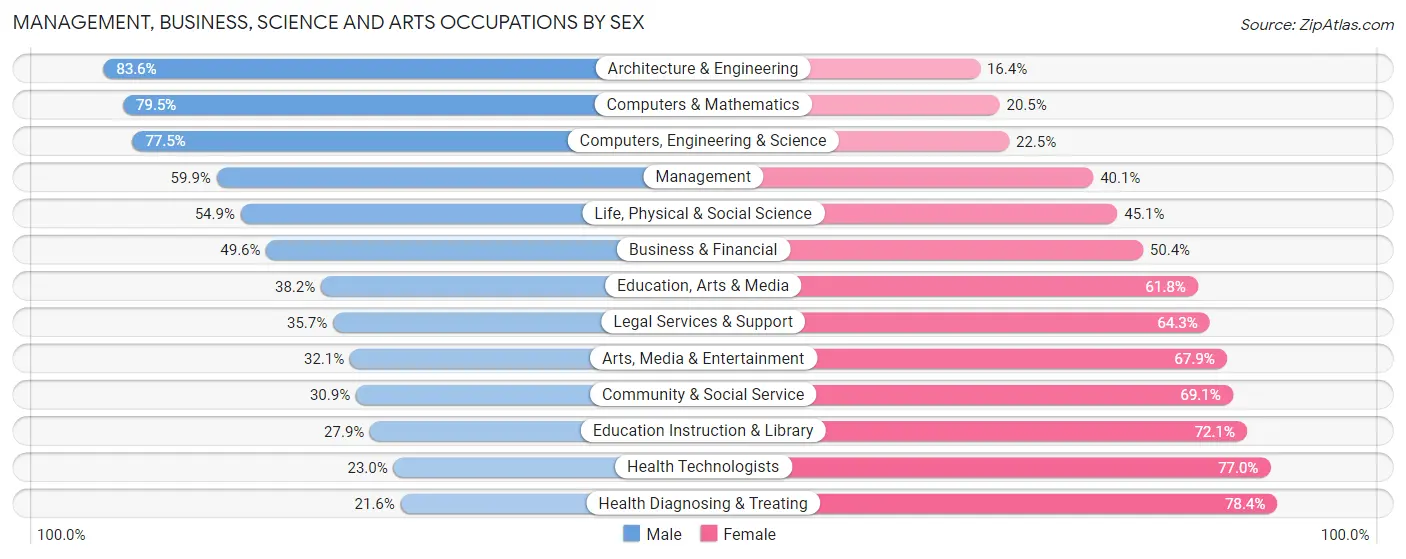
| Occupation | Male | Female |
| Management | 2,161 (59.9%) | 1,444 (40.1%) |
| Business & Financial | 913 (49.6%) | 929 (50.4%) |
| Computers, Engineering & Science | 1,974 (77.5%) | 573 (22.5%) |
| Computers & Mathematics | 1,185 (79.5%) | 306 (20.5%) |
| Architecture & Engineering | 610 (83.6%) | 120 (16.4%) |
| Life, Physical & Social Science | 179 (54.9%) | 147 (45.1%) |
| Community & Social Service | 1,288 (30.9%) | 2,884 (69.1%) |
| Education, Arts & Media | 332 (38.2%) | 538 (61.8%) |
| Legal Services & Support | 46 (35.7%) | 83 (64.3%) |
| Education Instruction & Library | 726 (27.9%) | 1,874 (72.1%) |
| Arts, Media & Entertainment | 184 (32.1%) | 389 (67.9%) |
| Health Diagnosing & Treating | 504 (21.6%) | 1,834 (78.4%) |
| Health Technologists | 313 (23.0%) | 1,046 (77.0%) |
| Total (Category) | 6,840 (47.2%) | 7,664 (52.8%) |
| Total (Overall) | 19,759 (50.7%) | 19,220 (49.3%) |
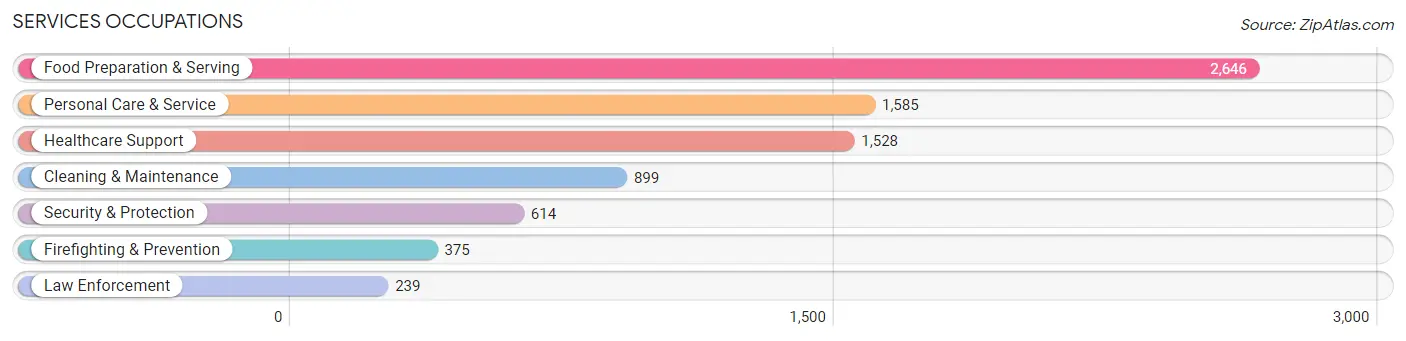
Services Occupations
The most common Services occupations in Eau Claire are Food Preparation & Serving (2,646 | 6.8%), Personal Care & Service (1,585 | 4.1%), Healthcare Support (1,528 | 3.9%), Cleaning & Maintenance (899 | 2.3%), and Security & Protection (614 | 1.6%).
Services Occupations by Sex
Within the Services occupations in Eau Claire, the most male-oriented occupations are Law Enforcement (82.0%), Security & Protection (68.6%), and Firefighting & Prevention (60.0%), while the most female-oriented occupations are Personal Care & Service (90.8%), Healthcare Support (83.3%), and Cleaning & Maintenance (52.3%).
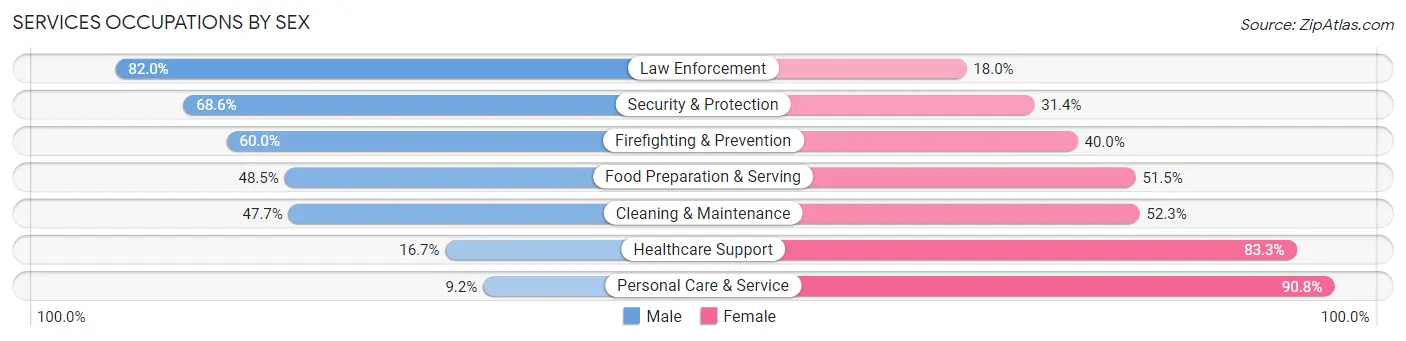
| Occupation | Male | Female |
| Healthcare Support | 255 (16.7%) | 1,273 (83.3%) |
| Security & Protection | 421 (68.6%) | 193 (31.4%) |
| Firefighting & Prevention | 225 (60.0%) | 150 (40.0%) |
| Law Enforcement | 196 (82.0%) | 43 (18.0%) |
| Food Preparation & Serving | 1,284 (48.5%) | 1,362 (51.5%) |
| Cleaning & Maintenance | 429 (47.7%) | 470 (52.3%) |
| Personal Care & Service | 146 (9.2%) | 1,439 (90.8%) |
| Total (Category) | 2,535 (34.9%) | 4,737 (65.1%) |
| Total (Overall) | 19,759 (50.7%) | 19,220 (49.3%) |
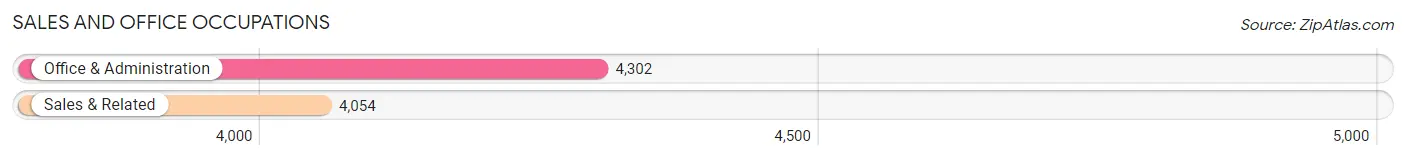
Sales and Office Occupations
The most common Sales and Office occupations in Eau Claire are Office & Administration (4,302 | 11.0%), and Sales & Related (4,054 | 10.4%).
Sales and Office Occupations by Sex
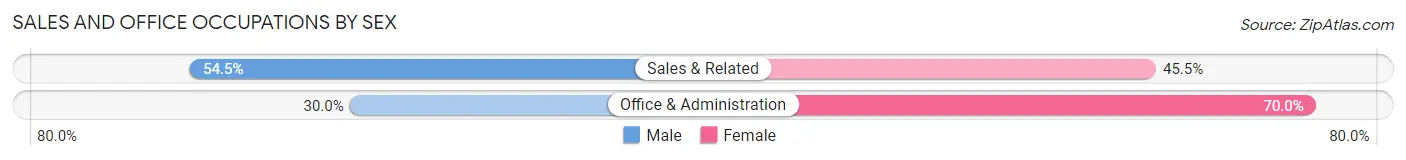
| Occupation | Male | Female |
| Sales & Related | 2,211 (54.5%) | 1,843 (45.5%) |
| Office & Administration | 1,291 (30.0%) | 3,011 (70.0%) |
| Total (Category) | 3,502 (41.9%) | 4,854 (58.1%) |
| Total (Overall) | 19,759 (50.7%) | 19,220 (49.3%) |
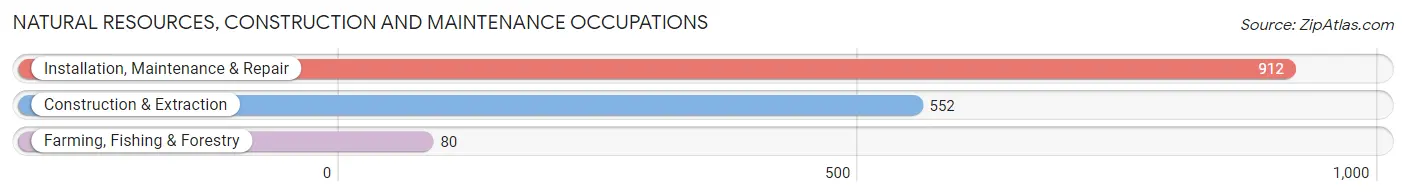
Natural Resources, Construction and Maintenance Occupations
The most common Natural Resources, Construction and Maintenance occupations in Eau Claire are Installation, Maintenance & Repair (912 | 2.3%), Construction & Extraction (552 | 1.4%), and Farming, Fishing & Forestry (80 | 0.2%).
Natural Resources, Construction and Maintenance Occupations by Sex
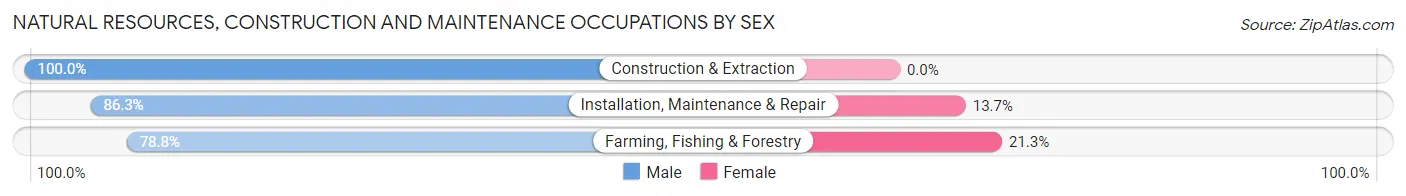
| Occupation | Male | Female |
| Farming, Fishing & Forestry | 63 (78.7%) | 17 (21.2%) |
| Construction & Extraction | 552 (100.0%) | 0 (0.0%) |
| Installation, Maintenance & Repair | 787 (86.3%) | 125 (13.7%) |
| Total (Category) | 1,402 (90.8%) | 142 (9.2%) |
| Total (Overall) | 19,759 (50.7%) | 19,220 (49.3%) |
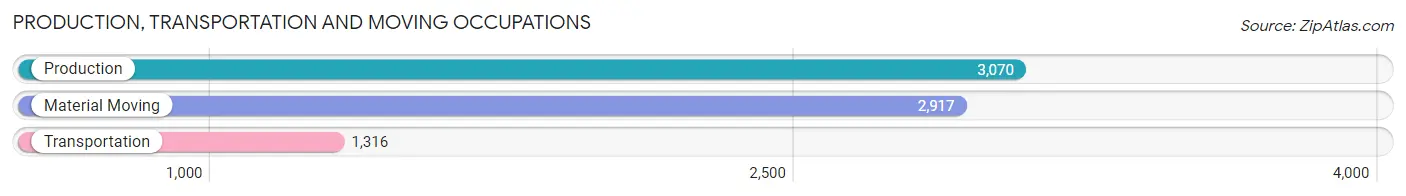
Production, Transportation and Moving Occupations
The most common Production, Transportation and Moving occupations in Eau Claire are Production (3,070 | 7.9%), Material Moving (2,917 | 7.5%), and Transportation (1,316 | 3.4%).
Production, Transportation and Moving Occupations by Sex
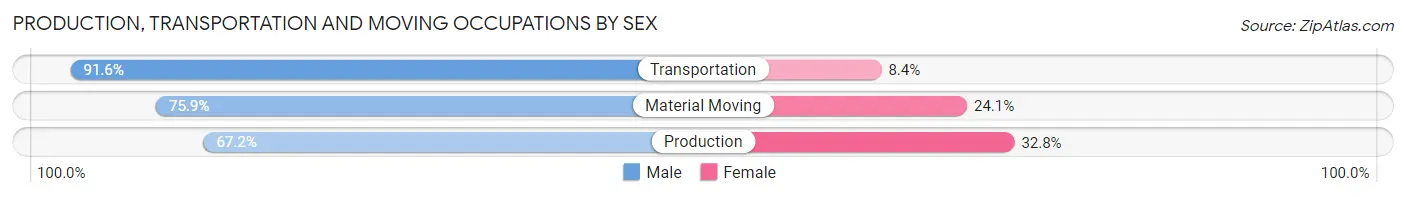
| Occupation | Male | Female |
| Production | 2,062 (67.2%) | 1,008 (32.8%) |
| Transportation | 1,205 (91.6%) | 111 (8.4%) |
| Material Moving | 2,213 (75.9%) | 704 (24.1%) |
| Total (Category) | 5,480 (75.0%) | 1,823 (25.0%) |
| Total (Overall) | 19,759 (50.7%) | 19,220 (49.3%) |
Employment Industries by Sex in Eau Claire
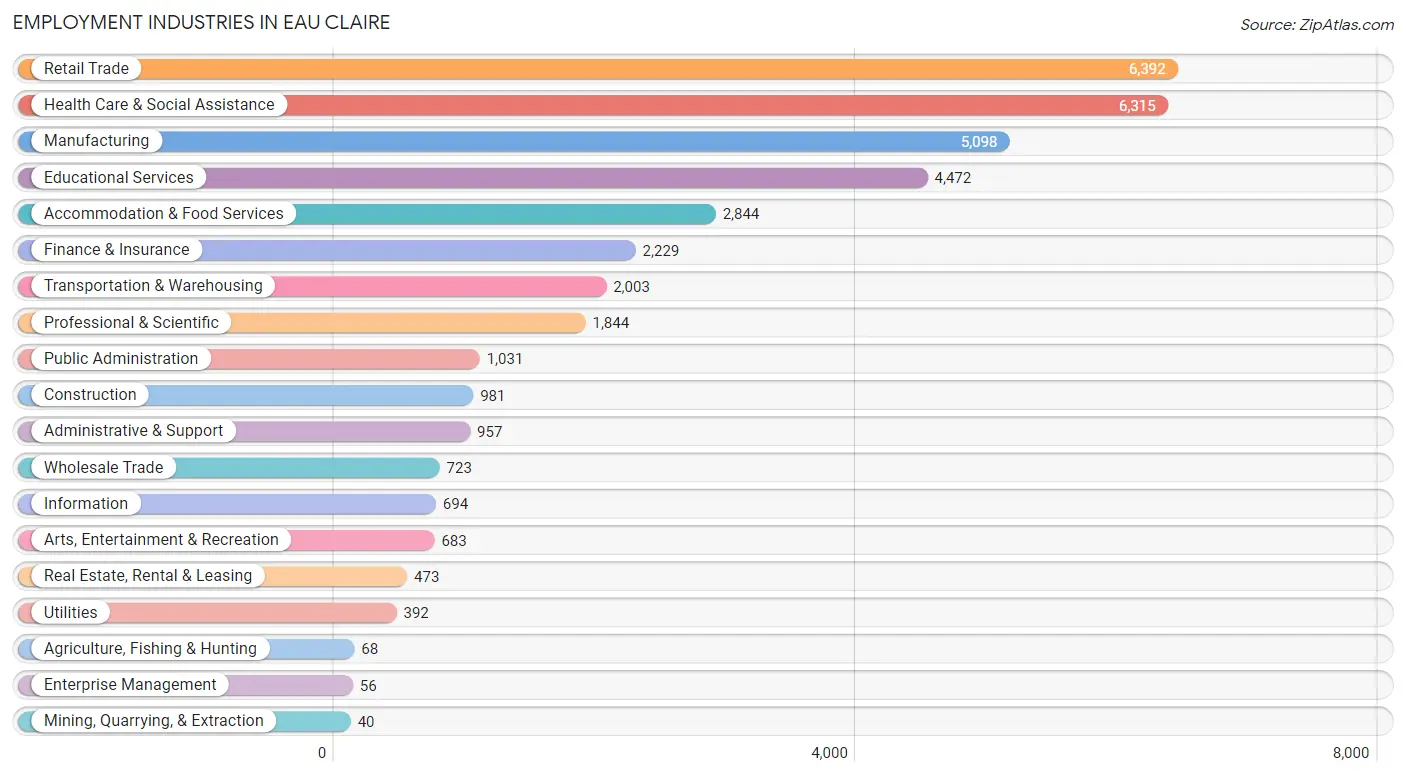
Employment Industries in Eau Claire
The major employment industries in Eau Claire include Retail Trade (6,392 | 16.4%), Health Care & Social Assistance (6,315 | 16.2%), Manufacturing (5,098 | 13.1%), Educational Services (4,472 | 11.5%), and Accommodation & Food Services (2,844 | 7.3%).
Employment Industries by Sex in Eau Claire
The Eau Claire industries that see more men than women are Mining, Quarrying, & Extraction (100.0%), Construction (93.3%), and Agriculture, Fishing & Hunting (89.7%), whereas the industries that tend to have a higher number of women are Enterprise Management (78.6%), Health Care & Social Assistance (78.2%), and Educational Services (70.7%).
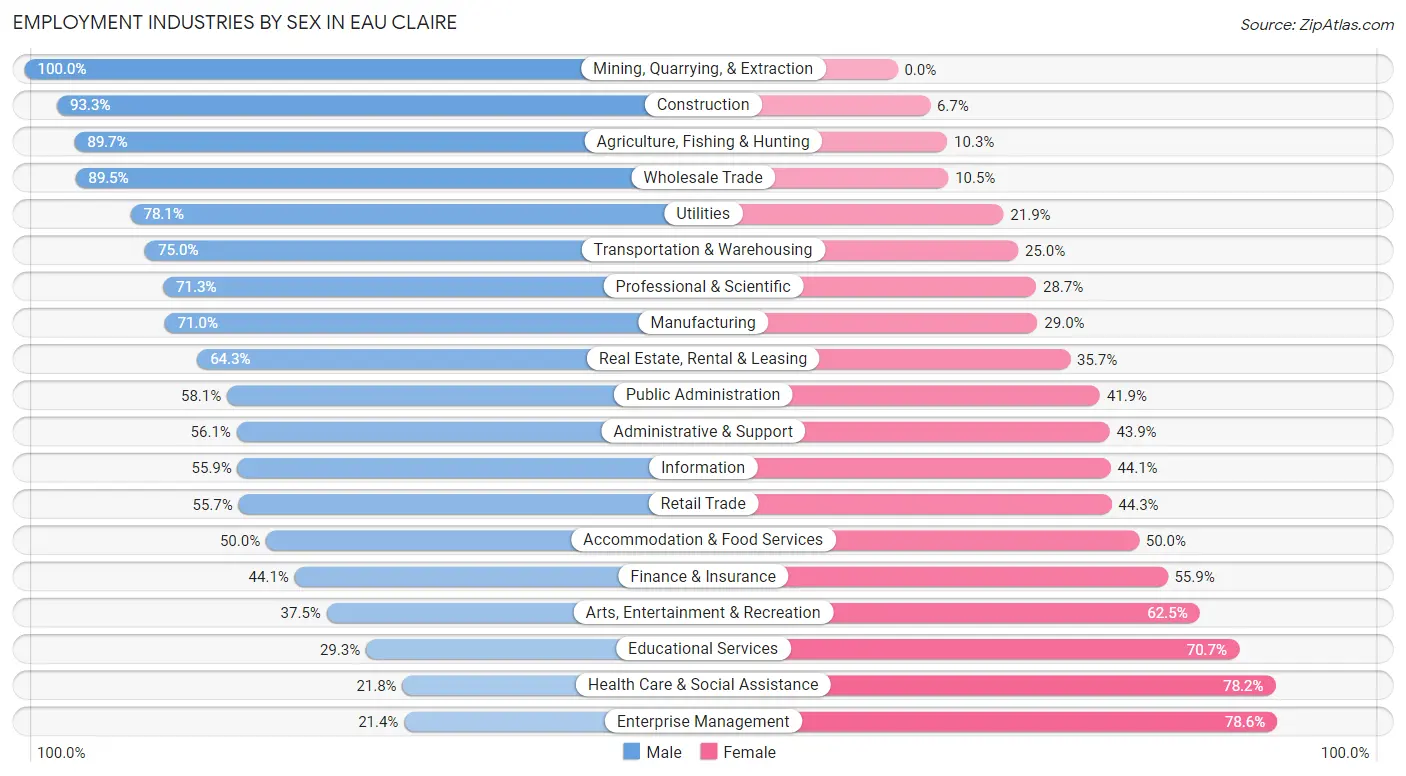
| Industry | Male | Female |
| Agriculture, Fishing & Hunting | 61 (89.7%) | 7 (10.3%) |
| Mining, Quarrying, & Extraction | 40 (100.0%) | 0 (0.0%) |
| Construction | 915 (93.3%) | 66 (6.7%) |
| Manufacturing | 3,621 (71.0%) | 1,477 (29.0%) |
| Wholesale Trade | 647 (89.5%) | 76 (10.5%) |
| Retail Trade | 3,561 (55.7%) | 2,831 (44.3%) |
| Transportation & Warehousing | 1,503 (75.0%) | 500 (25.0%) |
| Utilities | 306 (78.1%) | 86 (21.9%) |
| Information | 388 (55.9%) | 306 (44.1%) |
| Finance & Insurance | 983 (44.1%) | 1,246 (55.9%) |
| Real Estate, Rental & Leasing | 304 (64.3%) | 169 (35.7%) |
| Professional & Scientific | 1,315 (71.3%) | 529 (28.7%) |
| Enterprise Management | 12 (21.4%) | 44 (78.6%) |
| Administrative & Support | 537 (56.1%) | 420 (43.9%) |
| Educational Services | 1,312 (29.3%) | 3,160 (70.7%) |
| Health Care & Social Assistance | 1,376 (21.8%) | 4,939 (78.2%) |
| Arts, Entertainment & Recreation | 256 (37.5%) | 427 (62.5%) |
| Accommodation & Food Services | 1,423 (50.0%) | 1,421 (50.0%) |
| Public Administration | 599 (58.1%) | 432 (41.9%) |
| Total | 19,759 (50.7%) | 19,220 (49.3%) |
Education in Eau Claire
School Enrollment in Eau Claire
The most common levels of schooling among the 19,890 students in Eau Claire are college / undergraduate (9,554 | 48.0%), middle school (2,845 | 14.3%), and high school (2,629 | 13.2%).
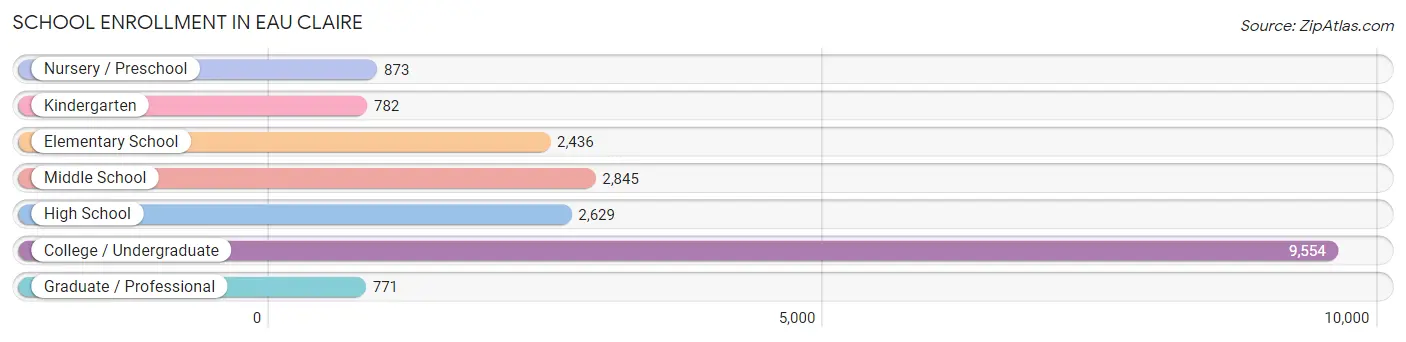
| School Level | # Students | % Students |
| Nursery / Preschool | 873 | 4.4% |
| Kindergarten | 782 | 3.9% |
| Elementary School | 2,436 | 12.2% |
| Middle School | 2,845 | 14.3% |
| High School | 2,629 | 13.2% |
| College / Undergraduate | 9,554 | 48.0% |
| Graduate / Professional | 771 | 3.9% |
| Total | 19,890 | 100.0% |
School Enrollment by Age by Funding Source in Eau Claire
Out of a total of 19,890 students who are enrolled in schools in Eau Claire, 1,770 (8.9%) attend a private institution, while the remaining 18,120 (91.1%) are enrolled in public schools. The age group of 3 to 4 year olds has the highest likelihood of being enrolled in private schools, with 225 (41.2% in the age bracket) enrolled. Conversely, the age group of 18 to 19 year olds has the lowest likelihood of being enrolled in a private school, with 3,170 (95.3% in the age bracket) attending a public institution.
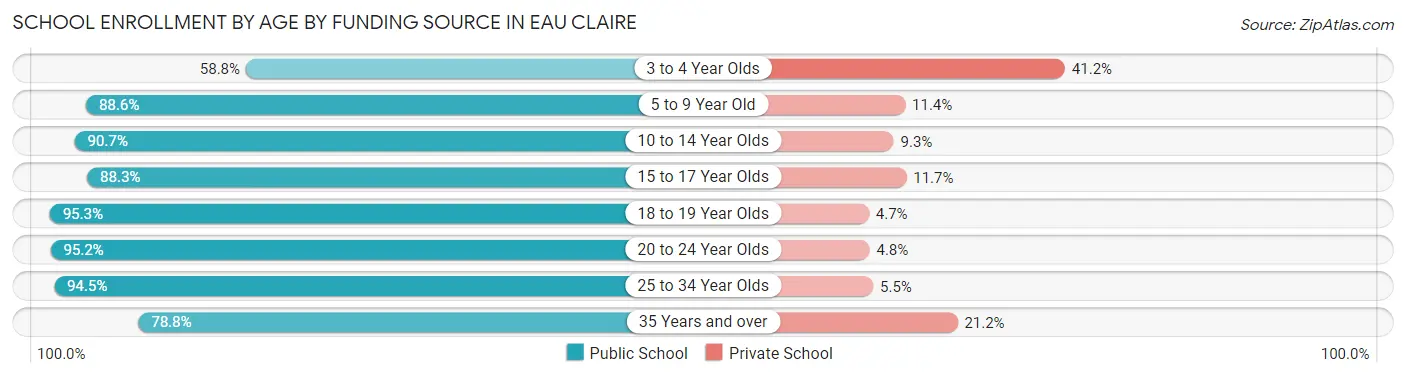
| Age Bracket | Public School | Private School |
| 3 to 4 Year Olds | 321 (58.8%) | 225 (41.2%) |
| 5 to 9 Year Old | 2,911 (88.6%) | 376 (11.4%) |
| 10 to 14 Year Olds | 3,111 (90.7%) | 319 (9.3%) |
| 15 to 17 Year Olds | 1,659 (88.3%) | 219 (11.7%) |
| 18 to 19 Year Olds | 3,170 (95.3%) | 156 (4.7%) |
| 20 to 24 Year Olds | 5,604 (95.2%) | 284 (4.8%) |
| 25 to 34 Year Olds | 862 (94.5%) | 50 (5.5%) |
| 35 Years and over | 491 (78.8%) | 132 (21.2%) |
| Total | 18,120 (91.1%) | 1,770 (8.9%) |
Educational Attainment by Field of Study in Eau Claire
Business (3,189 | 19.1%), education (2,416 | 14.4%), science & technology (1,886 | 11.3%), social sciences (1,123 | 6.7%), and bio, nature & agricultural (1,120 | 6.7%) are the most common fields of study among 16,726 individuals in Eau Claire who have obtained a bachelor's degree or higher.
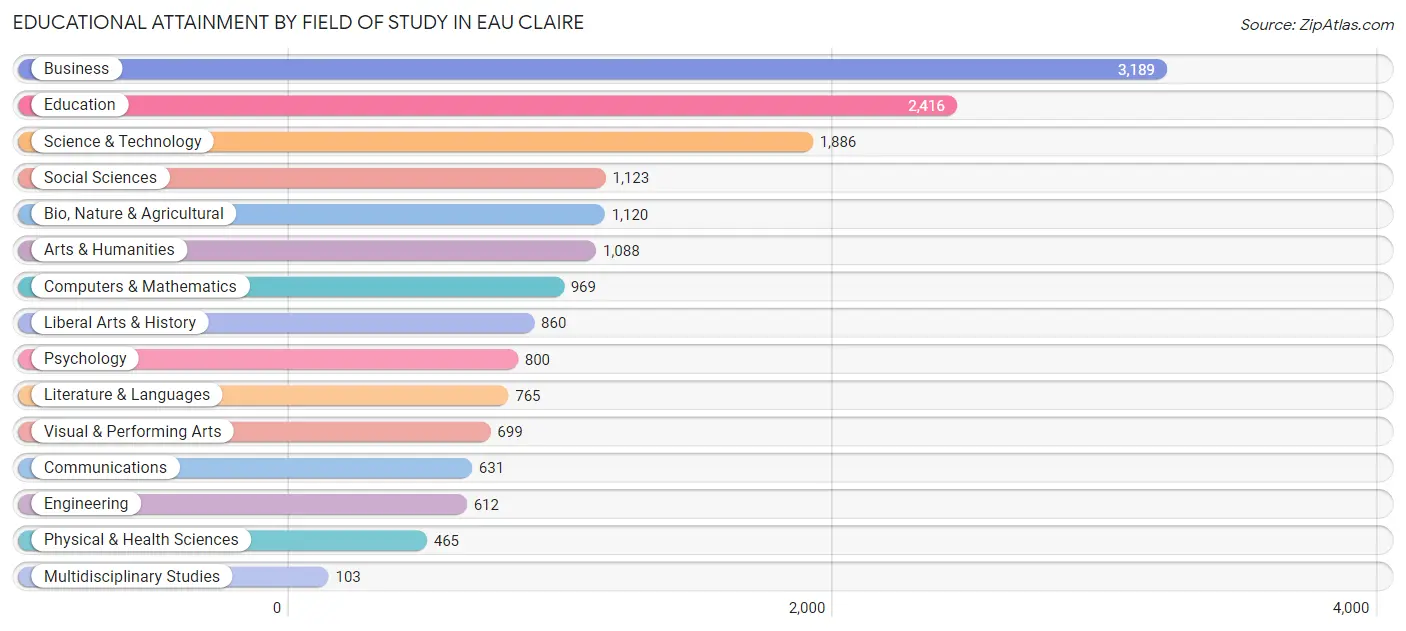
| Field of Study | # Graduates | % Graduates |
| Computers & Mathematics | 969 | 5.8% |
| Bio, Nature & Agricultural | 1,120 | 6.7% |
| Physical & Health Sciences | 465 | 2.8% |
| Psychology | 800 | 4.8% |
| Social Sciences | 1,123 | 6.7% |
| Engineering | 612 | 3.7% |
| Multidisciplinary Studies | 103 | 0.6% |
| Science & Technology | 1,886 | 11.3% |
| Business | 3,189 | 19.1% |
| Education | 2,416 | 14.4% |
| Literature & Languages | 765 | 4.6% |
| Liberal Arts & History | 860 | 5.1% |
| Visual & Performing Arts | 699 | 4.2% |
| Communications | 631 | 3.8% |
| Arts & Humanities | 1,088 | 6.5% |
| Total | 16,726 | 100.0% |
Transportation & Commute in Eau Claire
Vehicle Availability by Sex in Eau Claire
The most prevalent vehicle ownership categories in Eau Claire are males with 2 vehicles (9,040, accounting for 47.8%) and females with 2 vehicles (8,249, making up 50.8%).
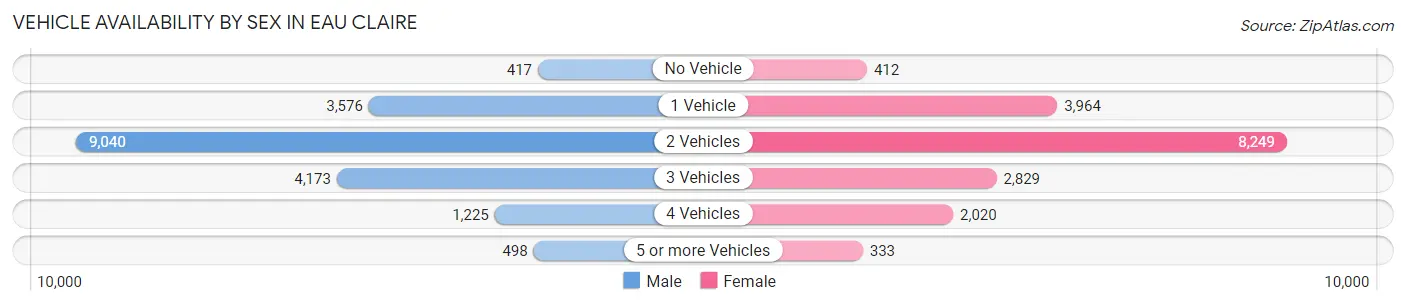
| Vehicles Available | Male | Female |
| No Vehicle | 417 (2.2%) | 412 (2.3%) |
| 1 Vehicle | 3,576 (18.9%) | 3,964 (22.3%) |
| 2 Vehicles | 9,040 (47.8%) | 8,249 (46.3%) |
| 3 Vehicles | 4,173 (22.1%) | 2,829 (15.9%) |
| 4 Vehicles | 1,225 (6.5%) | 2,020 (11.3%) |
| 5 or more Vehicles | 498 (2.6%) | 333 (1.9%) |
| Total | 18,929 (100.0%) | 17,807 (100.0%) |
Commute Time in Eau Claire
The most frequently occuring commute durations in Eau Claire are 10 to 14 minutes (9,780 commuters, 28.3%), 15 to 19 minutes (7,523 commuters, 21.8%), and 5 to 9 minutes (7,022 commuters, 20.3%).
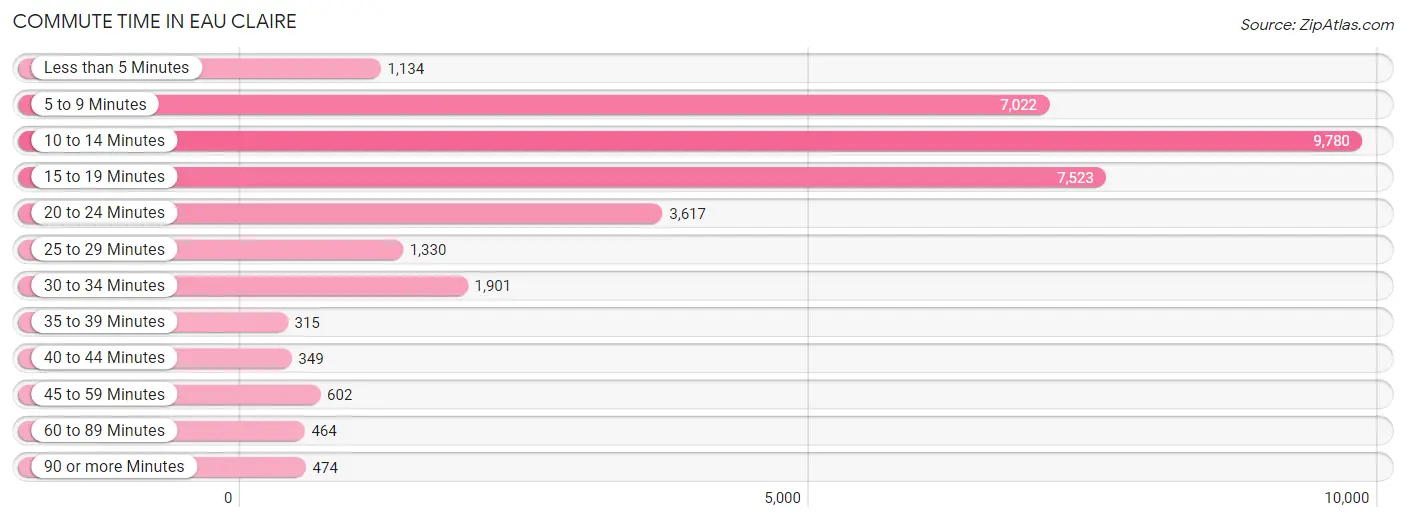
| Commute Time | # Commuters | % Commuters |
| Less than 5 Minutes | 1,134 | 3.3% |
| 5 to 9 Minutes | 7,022 | 20.3% |
| 10 to 14 Minutes | 9,780 | 28.3% |
| 15 to 19 Minutes | 7,523 | 21.8% |
| 20 to 24 Minutes | 3,617 | 10.5% |
| 25 to 29 Minutes | 1,330 | 3.8% |
| 30 to 34 Minutes | 1,901 | 5.5% |
| 35 to 39 Minutes | 315 | 0.9% |
| 40 to 44 Minutes | 349 | 1.0% |
| 45 to 59 Minutes | 602 | 1.7% |
| 60 to 89 Minutes | 464 | 1.3% |
| 90 or more Minutes | 474 | 1.4% |
Commute Time by Sex in Eau Claire
The most common commute times in Eau Claire are 10 to 14 minutes (4,439 commuters, 25.1%) for males and 10 to 14 minutes (5,341 commuters, 31.8%) for females.
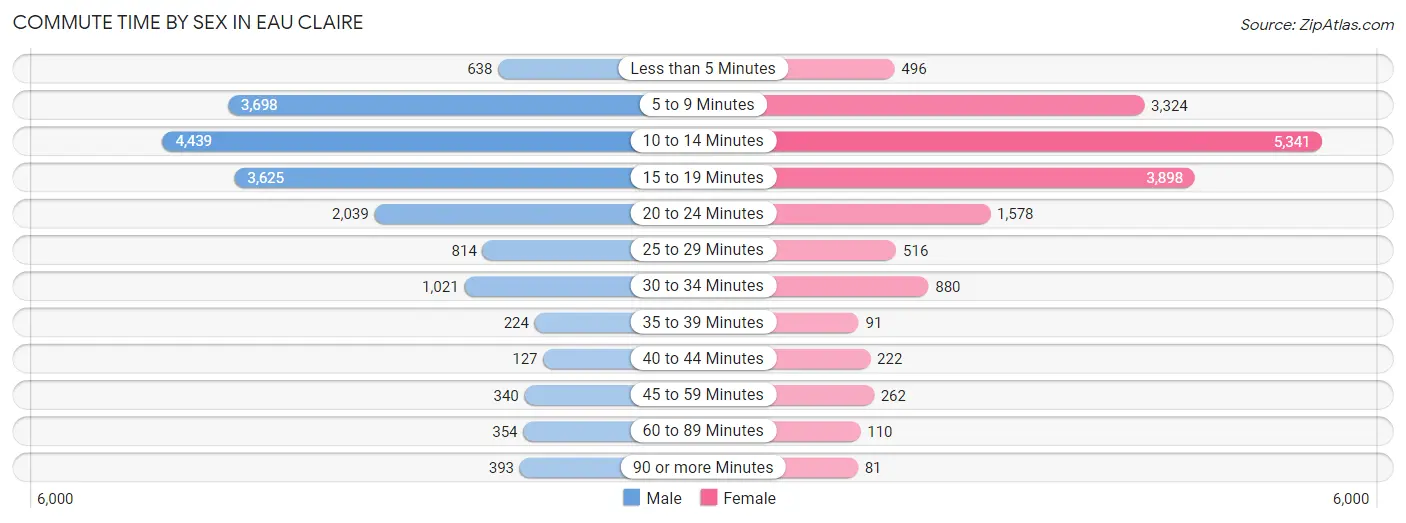
| Commute Time | Male | Female |
| Less than 5 Minutes | 638 (3.6%) | 496 (2.9%) |
| 5 to 9 Minutes | 3,698 (20.9%) | 3,324 (19.8%) |
| 10 to 14 Minutes | 4,439 (25.1%) | 5,341 (31.8%) |
| 15 to 19 Minutes | 3,625 (20.5%) | 3,898 (23.2%) |
| 20 to 24 Minutes | 2,039 (11.5%) | 1,578 (9.4%) |
| 25 to 29 Minutes | 814 (4.6%) | 516 (3.1%) |
| 30 to 34 Minutes | 1,021 (5.8%) | 880 (5.2%) |
| 35 to 39 Minutes | 224 (1.3%) | 91 (0.5%) |
| 40 to 44 Minutes | 127 (0.7%) | 222 (1.3%) |
| 45 to 59 Minutes | 340 (1.9%) | 262 (1.6%) |
| 60 to 89 Minutes | 354 (2.0%) | 110 (0.6%) |
| 90 or more Minutes | 393 (2.2%) | 81 (0.5%) |
Time of Departure to Work by Sex in Eau Claire
The most frequent times of departure to work in Eau Claire are 7:30 AM to 7:59 AM (2,478, 14.0%) for males and 7:30 AM to 7:59 AM (2,300, 13.7%) for females.
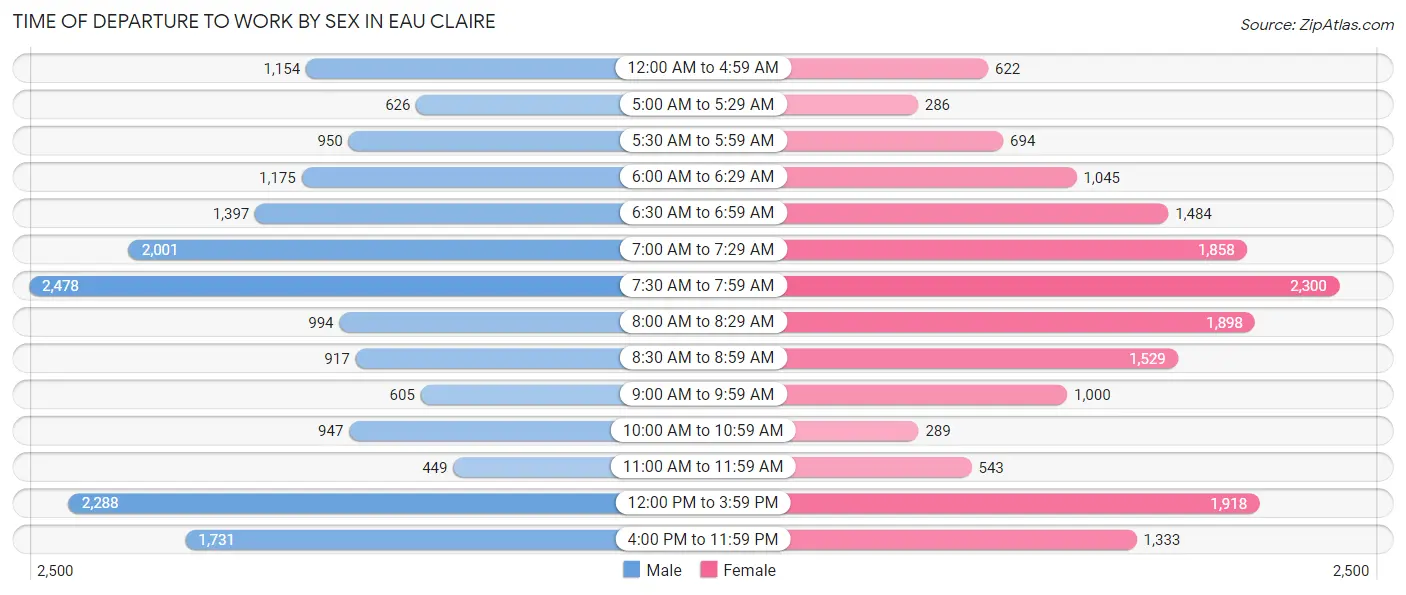
| Time of Departure | Male | Female |
| 12:00 AM to 4:59 AM | 1,154 (6.5%) | 622 (3.7%) |
| 5:00 AM to 5:29 AM | 626 (3.5%) | 286 (1.7%) |
| 5:30 AM to 5:59 AM | 950 (5.4%) | 694 (4.1%) |
| 6:00 AM to 6:29 AM | 1,175 (6.6%) | 1,045 (6.2%) |
| 6:30 AM to 6:59 AM | 1,397 (7.9%) | 1,484 (8.8%) |
| 7:00 AM to 7:29 AM | 2,001 (11.3%) | 1,858 (11.1%) |
| 7:30 AM to 7:59 AM | 2,478 (14.0%) | 2,300 (13.7%) |
| 8:00 AM to 8:29 AM | 994 (5.6%) | 1,898 (11.3%) |
| 8:30 AM to 8:59 AM | 917 (5.2%) | 1,529 (9.1%) |
| 9:00 AM to 9:59 AM | 605 (3.4%) | 1,000 (5.9%) |
| 10:00 AM to 10:59 AM | 947 (5.3%) | 289 (1.7%) |
| 11:00 AM to 11:59 AM | 449 (2.5%) | 543 (3.2%) |
| 12:00 PM to 3:59 PM | 2,288 (12.9%) | 1,918 (11.4%) |
| 4:00 PM to 11:59 PM | 1,731 (9.8%) | 1,333 (7.9%) |
| Total | 17,712 (100.0%) | 16,799 (100.0%) |
Housing Occupancy in Eau Claire
Occupancy by Ownership in Eau Claire
Of the total 28,832 dwellings in Eau Claire, owner-occupied units account for 16,281 (56.5%), while renter-occupied units make up 12,551 (43.5%).
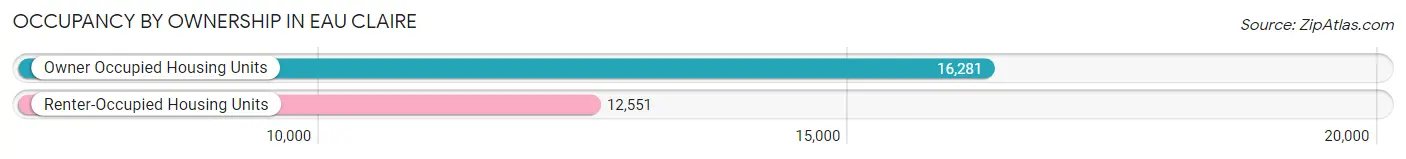
| Occupancy | # Housing Units | % Housing Units |
| Owner Occupied Housing Units | 16,281 | 56.5% |
| Renter-Occupied Housing Units | 12,551 | 43.5% |
| Total Occupied Housing Units | 28,832 | 100.0% |
Occupancy by Household Size in Eau Claire
| Household Size | # Housing Units | % Housing Units |
| 1-Person Household | 9,664 | 33.5% |
| 2-Person Household | 10,680 | 37.0% |
| 3-Person Household | 3,829 | 13.3% |
| 4+ Person Household | 4,659 | 16.2% |
| Total Housing Units | 28,832 | 100.0% |
Occupancy by Ownership by Household Size in Eau Claire
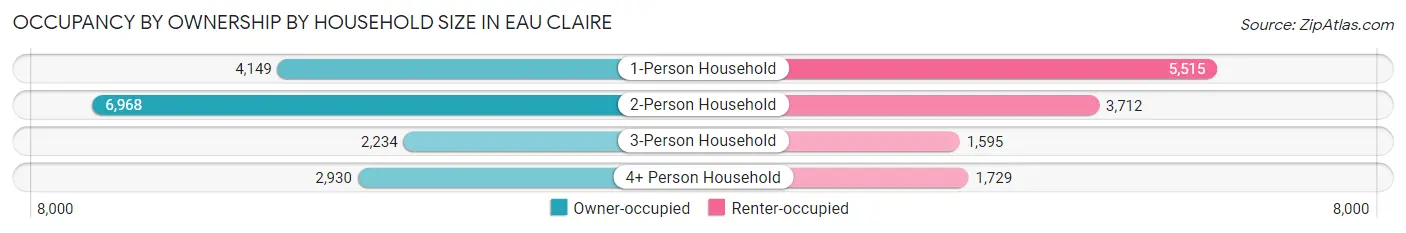
| Household Size | Owner-occupied | Renter-occupied |
| 1-Person Household | 4,149 (42.9%) | 5,515 (57.1%) |
| 2-Person Household | 6,968 (65.2%) | 3,712 (34.8%) |
| 3-Person Household | 2,234 (58.3%) | 1,595 (41.7%) |
| 4+ Person Household | 2,930 (62.9%) | 1,729 (37.1%) |
| Total Housing Units | 16,281 (56.5%) | 12,551 (43.5%) |
Occupancy by Educational Attainment in Eau Claire
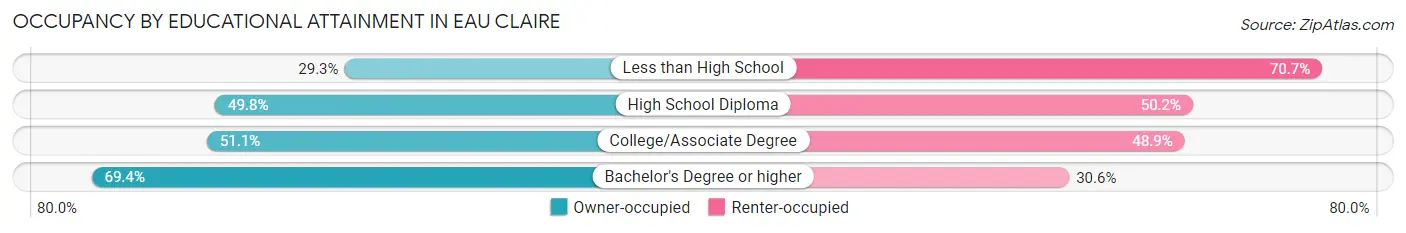
| Household Size | Owner-occupied | Renter-occupied |
| Less than High School | 229 (29.3%) | 553 (70.7%) |
| High School Diploma | 3,406 (49.8%) | 3,435 (50.2%) |
| College/Associate Degree | 5,775 (51.1%) | 5,530 (48.9%) |
| Bachelor's Degree or higher | 6,871 (69.4%) | 3,033 (30.6%) |
Occupancy by Age of Householder in Eau Claire
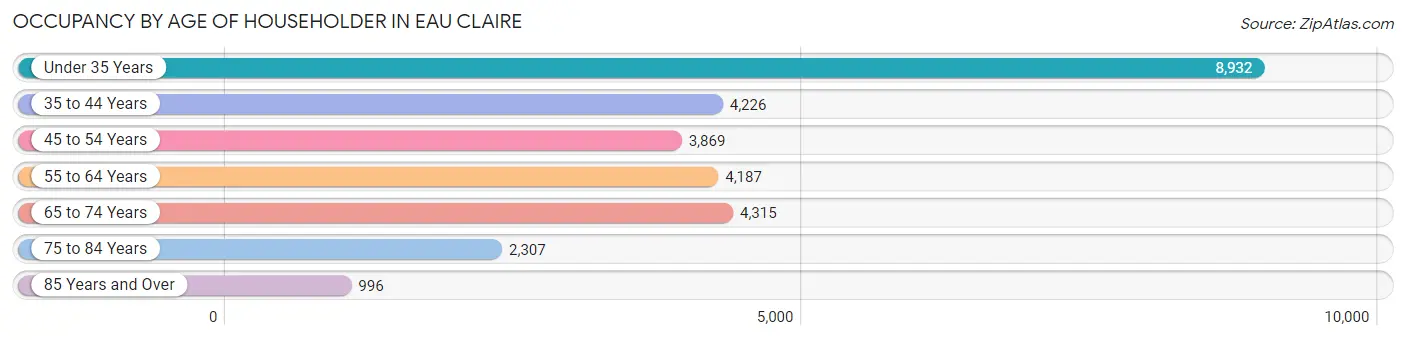
| Age Bracket | # Households | % Households |
| Under 35 Years | 8,932 | 31.0% |
| 35 to 44 Years | 4,226 | 14.7% |
| 45 to 54 Years | 3,869 | 13.4% |
| 55 to 64 Years | 4,187 | 14.5% |
| 65 to 74 Years | 4,315 | 15.0% |
| 75 to 84 Years | 2,307 | 8.0% |
| 85 Years and Over | 996 | 3.5% |
| Total | 28,832 | 100.0% |
Housing Finances in Eau Claire
Median Income by Occupancy in Eau Claire
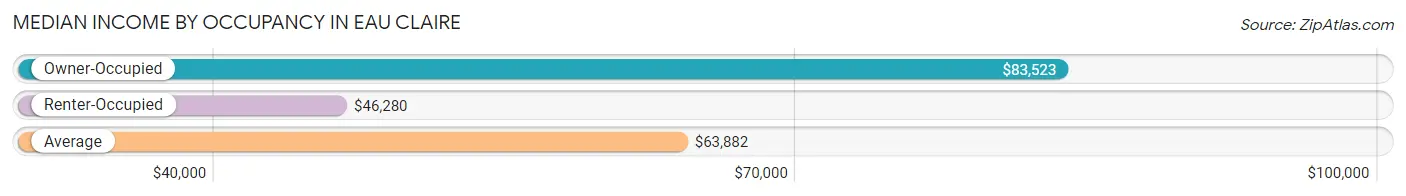
| Occupancy Type | # Households | Median Income |
| Owner-Occupied | 16,281 (56.5%) | $83,523 |
| Renter-Occupied | 12,551 (43.5%) | $46,280 |
| Average | 28,832 (100.0%) | $63,882 |
Occupancy by Householder Income Bracket in Eau Claire
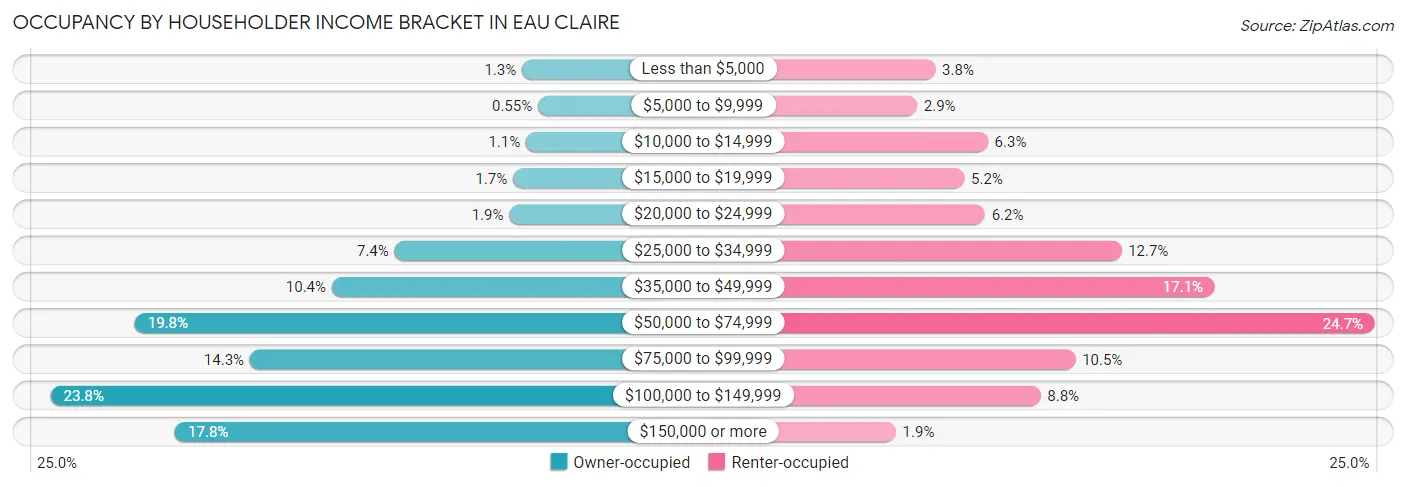
| Income Bracket | Owner-occupied | Renter-occupied |
| Less than $5,000 | 213 (1.3%) | 476 (3.8%) |
| $5,000 to $9,999 | 90 (0.5%) | 367 (2.9%) |
| $10,000 to $14,999 | 182 (1.1%) | 789 (6.3%) |
| $15,000 to $19,999 | 283 (1.7%) | 649 (5.2%) |
| $20,000 to $24,999 | 313 (1.9%) | 772 (6.1%) |
| $25,000 to $34,999 | 1,201 (7.4%) | 1,588 (12.7%) |
| $35,000 to $49,999 | 1,689 (10.4%) | 2,148 (17.1%) |
| $50,000 to $74,999 | 3,216 (19.8%) | 3,104 (24.7%) |
| $75,000 to $99,999 | 2,323 (14.3%) | 1,313 (10.5%) |
| $100,000 to $149,999 | 3,868 (23.8%) | 1,105 (8.8%) |
| $150,000 or more | 2,903 (17.8%) | 240 (1.9%) |
| Total | 16,281 (100.0%) | 12,551 (100.0%) |
Monthly Housing Cost Tiers in Eau Claire
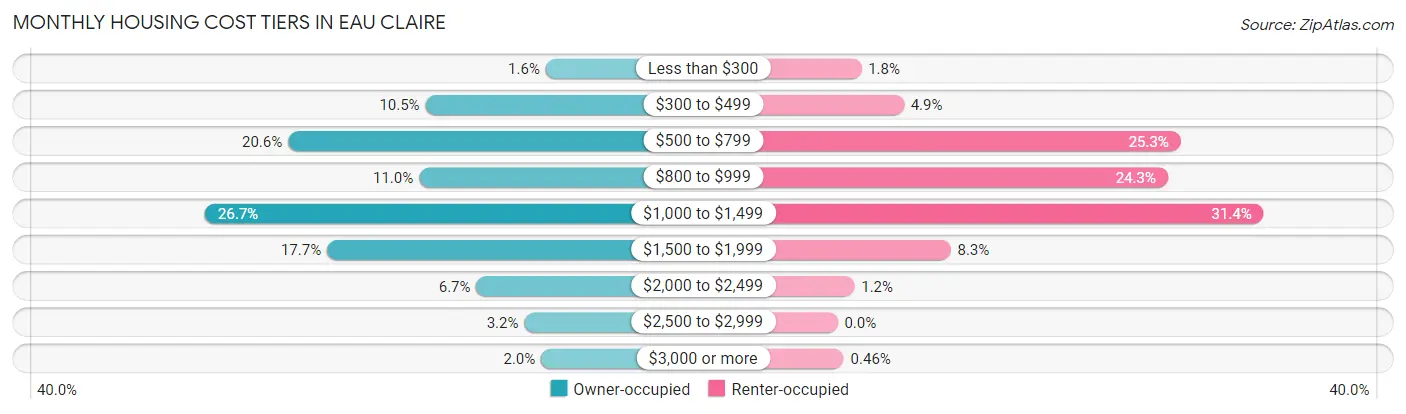
| Monthly Cost | Owner-occupied | Renter-occupied |
| Less than $300 | 264 (1.6%) | 220 (1.8%) |
| $300 to $499 | 1,706 (10.5%) | 613 (4.9%) |
| $500 to $799 | 3,354 (20.6%) | 3,173 (25.3%) |
| $800 to $999 | 1,783 (11.0%) | 3,054 (24.3%) |
| $1,000 to $1,499 | 4,351 (26.7%) | 3,940 (31.4%) |
| $1,500 to $1,999 | 2,887 (17.7%) | 1,045 (8.3%) |
| $2,000 to $2,499 | 1,096 (6.7%) | 156 (1.2%) |
| $2,500 to $2,999 | 521 (3.2%) | 0 (0.0%) |
| $3,000 or more | 319 (2.0%) | 58 (0.5%) |
| Total | 16,281 (100.0%) | 12,551 (100.0%) |
Physical Housing Characteristics in Eau Claire
Housing Structures in Eau Claire
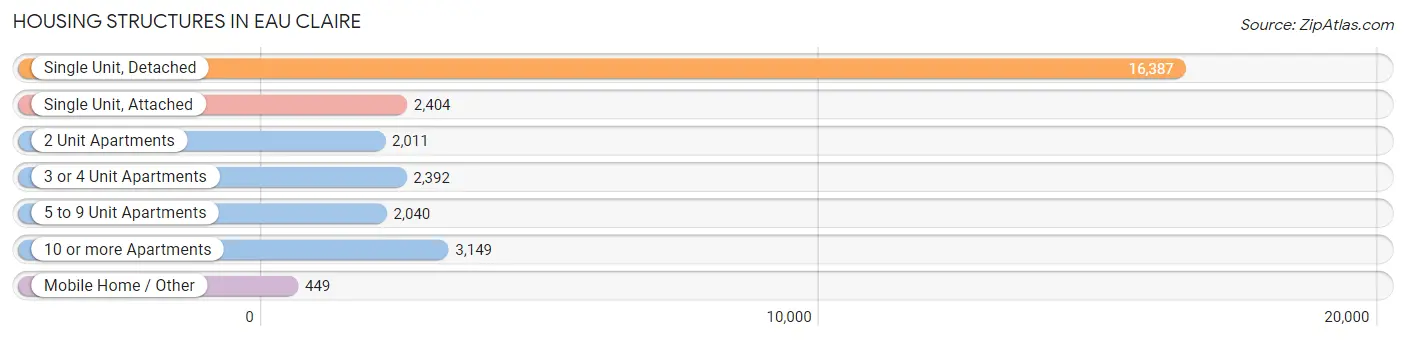
| Structure Type | # Housing Units | % Housing Units |
| Single Unit, Detached | 16,387 | 56.8% |
| Single Unit, Attached | 2,404 | 8.3% |
| 2 Unit Apartments | 2,011 | 7.0% |
| 3 or 4 Unit Apartments | 2,392 | 8.3% |
| 5 to 9 Unit Apartments | 2,040 | 7.1% |
| 10 or more Apartments | 3,149 | 10.9% |
| Mobile Home / Other | 449 | 1.6% |
| Total | 28,832 | 100.0% |
Housing Structures by Occupancy in Eau Claire
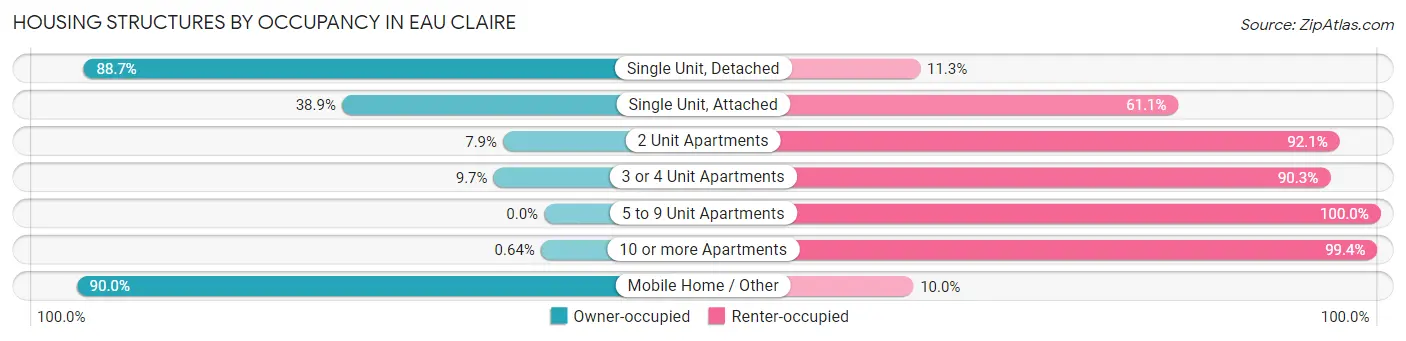
| Structure Type | Owner-occupied | Renter-occupied |
| Single Unit, Detached | 14,529 (88.7%) | 1,858 (11.3%) |
| Single Unit, Attached | 936 (38.9%) | 1,468 (61.1%) |
| 2 Unit Apartments | 159 (7.9%) | 1,852 (92.1%) |
| 3 or 4 Unit Apartments | 233 (9.7%) | 2,159 (90.3%) |
| 5 to 9 Unit Apartments | 0 (0.0%) | 2,040 (100.0%) |
| 10 or more Apartments | 20 (0.6%) | 3,129 (99.4%) |
| Mobile Home / Other | 404 (90.0%) | 45 (10.0%) |
| Total | 16,281 (56.5%) | 12,551 (43.5%) |
Housing Structures by Number of Rooms in Eau Claire
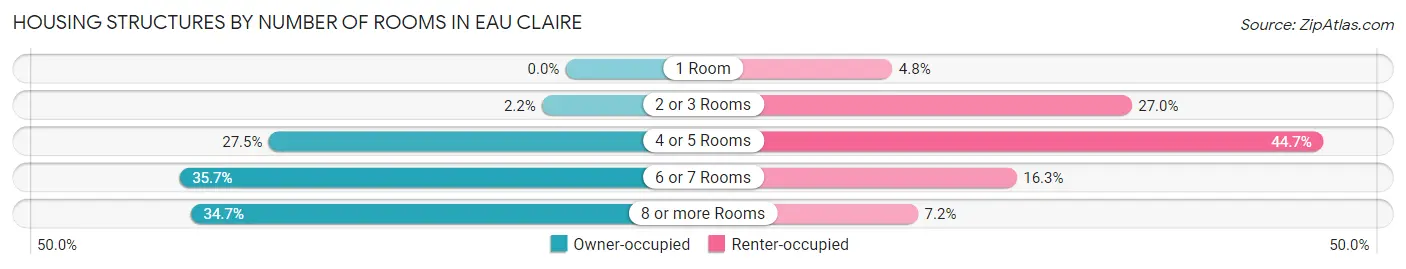
| Number of Rooms | Owner-occupied | Renter-occupied |
| 1 Room | 0 (0.0%) | 604 (4.8%) |
| 2 or 3 Rooms | 357 (2.2%) | 3,383 (27.0%) |
| 4 or 5 Rooms | 4,470 (27.5%) | 5,614 (44.7%) |
| 6 or 7 Rooms | 5,813 (35.7%) | 2,047 (16.3%) |
| 8 or more Rooms | 5,641 (34.6%) | 903 (7.2%) |
| Total | 16,281 (100.0%) | 12,551 (100.0%) |
Housing Structure by Heating Type in Eau Claire
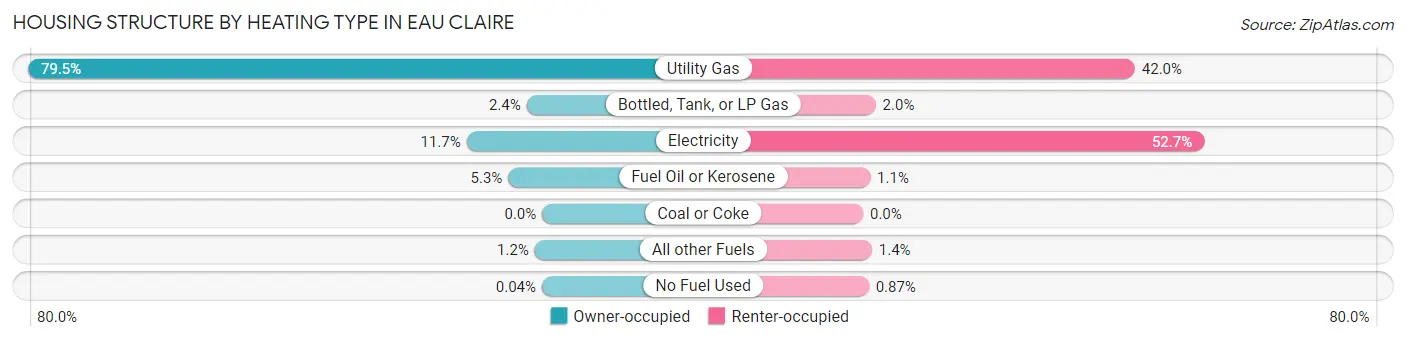
| Heating Type | Owner-occupied | Renter-occupied |
| Utility Gas | 12,942 (79.5%) | 5,274 (42.0%) |
| Bottled, Tank, or LP Gas | 389 (2.4%) | 245 (1.9%) |
| Electricity | 1,902 (11.7%) | 6,614 (52.7%) |
| Fuel Oil or Kerosene | 854 (5.2%) | 138 (1.1%) |
| Coal or Coke | 0 (0.0%) | 0 (0.0%) |
| All other Fuels | 188 (1.1%) | 171 (1.4%) |
| No Fuel Used | 6 (0.0%) | 109 (0.9%) |
| Total | 16,281 (100.0%) | 12,551 (100.0%) |
Household Vehicle Usage in Eau Claire
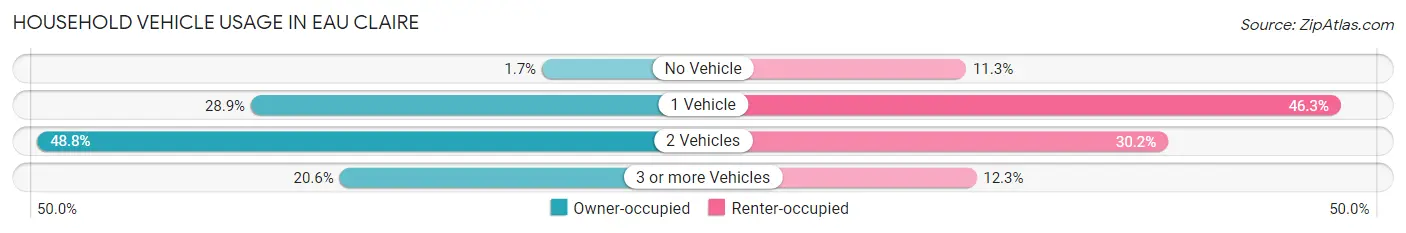
| Vehicles per Household | Owner-occupied | Renter-occupied |
| No Vehicle | 278 (1.7%) | 1,418 (11.3%) |
| 1 Vehicle | 4,700 (28.9%) | 5,809 (46.3%) |
| 2 Vehicles | 7,949 (48.8%) | 3,785 (30.2%) |
| 3 or more Vehicles | 3,354 (20.6%) | 1,539 (12.3%) |
| Total | 16,281 (100.0%) | 12,551 (100.0%) |
Real Estate & Mortgages in Eau Claire
Real Estate and Mortgage Overview in Eau Claire
| Characteristic | Without Mortgage | With Mortgage |
| Housing Units | 6,053 | 10,228 |
| Median Property Value | $199,400 | $214,200 |
| Median Household Income | $65,037 | $1,935 |
| Monthly Housing Costs | $593 | $313 |
| Real Estate Taxes | $3,339 | $30 |
Property Value by Mortgage Status in Eau Claire
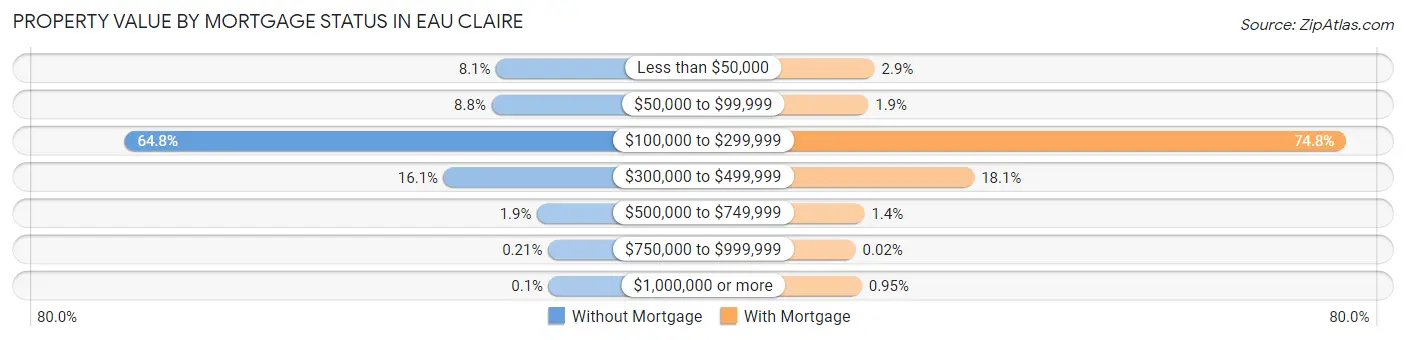
| Property Value | Without Mortgage | With Mortgage |
| Less than $50,000 | 491 (8.1%) | 297 (2.9%) |
| $50,000 to $99,999 | 534 (8.8%) | 198 (1.9%) |
| $100,000 to $299,999 | 3,920 (64.8%) | 7,646 (74.8%) |
| $300,000 to $499,999 | 975 (16.1%) | 1,849 (18.1%) |
| $500,000 to $749,999 | 114 (1.9%) | 139 (1.4%) |
| $750,000 to $999,999 | 13 (0.2%) | 2 (0.0%) |
| $1,000,000 or more | 6 (0.1%) | 97 (0.9%) |
| Total | 6,053 (100.0%) | 10,228 (100.0%) |
Household Income by Mortgage Status in Eau Claire
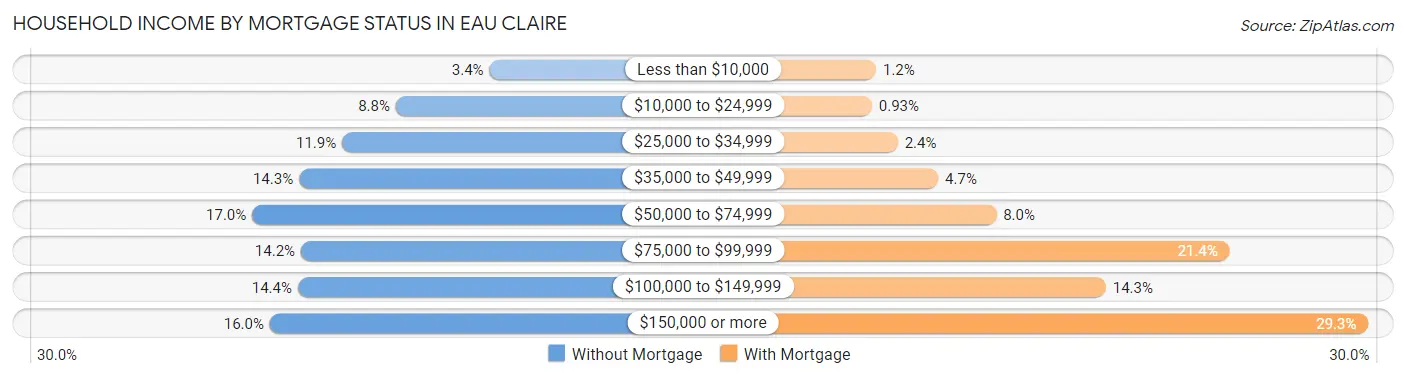
| Household Income | Without Mortgage | With Mortgage |
| Less than $10,000 | 208 (3.4%) | 120 (1.2%) |
| $10,000 to $24,999 | 532 (8.8%) | 95 (0.9%) |
| $25,000 to $34,999 | 718 (11.9%) | 246 (2.4%) |
| $35,000 to $49,999 | 867 (14.3%) | 483 (4.7%) |
| $50,000 to $74,999 | 1,029 (17.0%) | 822 (8.0%) |
| $75,000 to $99,999 | 860 (14.2%) | 2,187 (21.4%) |
| $100,000 to $149,999 | 871 (14.4%) | 1,463 (14.3%) |
| $150,000 or more | 968 (16.0%) | 2,997 (29.3%) |
| Total | 6,053 (100.0%) | 10,228 (100.0%) |
Property Value to Household Income Ratio in Eau Claire
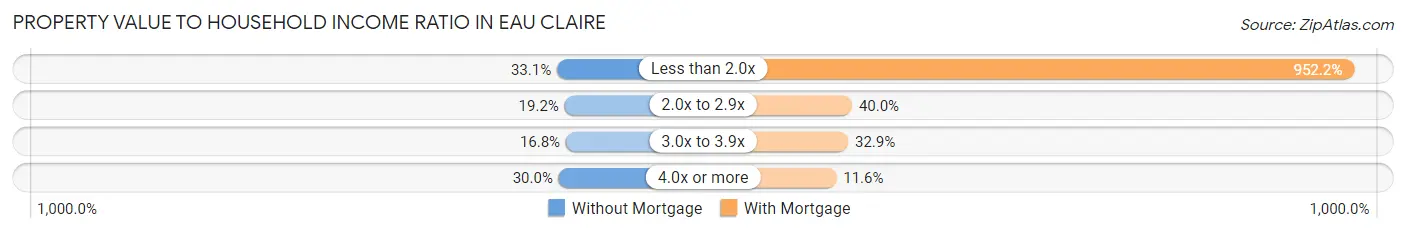
| Value-to-Income Ratio | Without Mortgage | With Mortgage |
| Less than 2.0x | 2,005 (33.1%) | 97,386 (952.1%) |
| 2.0x to 2.9x | 1,161 (19.2%) | 4,094 (40.0%) |
| 3.0x to 3.9x | 1,019 (16.8%) | 3,368 (32.9%) |
| 4.0x or more | 1,813 (29.9%) | 1,187 (11.6%) |
| Total | 6,053 (100.0%) | 10,228 (100.0%) |
Real Estate Taxes by Mortgage Status in Eau Claire
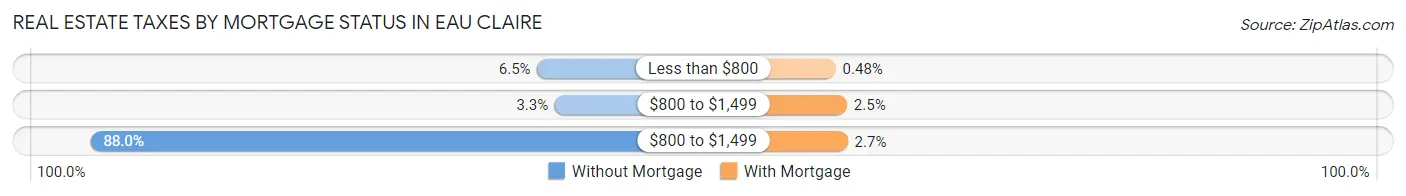
| Property Taxes | Without Mortgage | With Mortgage |
| Less than $800 | 394 (6.5%) | 49 (0.5%) |
| $800 to $1,499 | 199 (3.3%) | 259 (2.5%) |
| $800 to $1,499 | 5,324 (88.0%) | 273 (2.7%) |
| Total | 6,053 (100.0%) | 10,228 (100.0%) |
Health & Disability in Eau Claire
Health Insurance Coverage by Age in Eau Claire
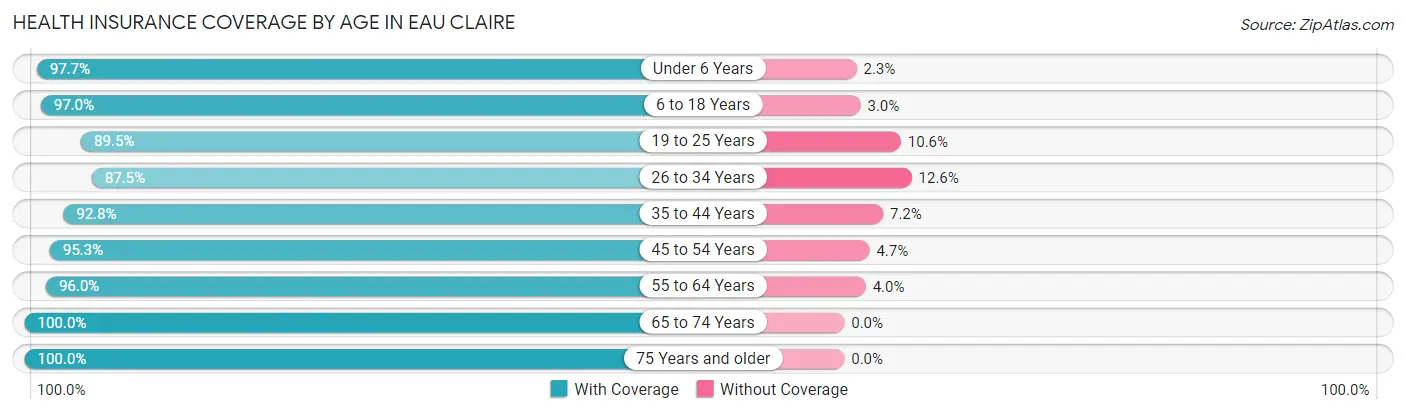
| Age Bracket | With Coverage | Without Coverage |
| Under 6 Years | 4,078 (97.7%) | 95 (2.3%) |
| 6 to 18 Years | 9,671 (97.0%) | 302 (3.0%) |
| 19 to 25 Years | 11,612 (89.4%) | 1,370 (10.5%) |
| 26 to 34 Years | 8,073 (87.5%) | 1,159 (12.6%) |
| 35 to 44 Years | 7,197 (92.8%) | 560 (7.2%) |
| 45 to 54 Years | 6,326 (95.3%) | 312 (4.7%) |
| 55 to 64 Years | 6,712 (96.0%) | 279 (4.0%) |
| 65 to 74 Years | 6,444 (100.0%) | 0 (0.0%) |
| 75 Years and older | 4,482 (100.0%) | 0 (0.0%) |
| Total | 64,595 (94.1%) | 4,077 (5.9%) |
Health Insurance Coverage by Citizenship Status in Eau Claire
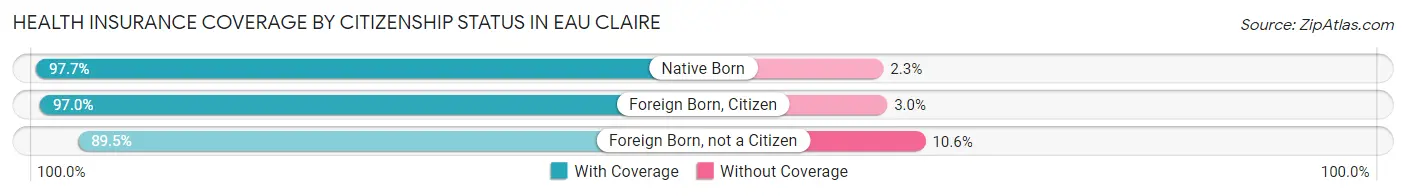
| Citizenship Status | With Coverage | Without Coverage |
| Native Born | 4,078 (97.7%) | 95 (2.3%) |
| Foreign Born, Citizen | 9,671 (97.0%) | 302 (3.0%) |
| Foreign Born, not a Citizen | 11,612 (89.4%) | 1,370 (10.5%) |
Health Insurance Coverage by Household Income in Eau Claire
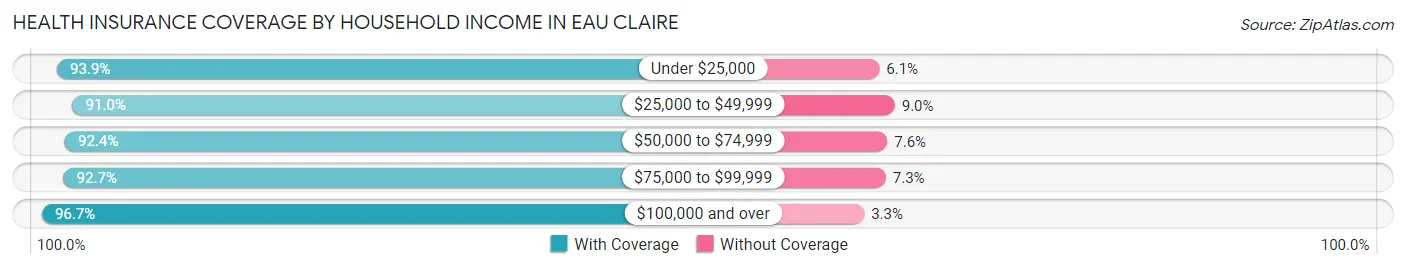
| Household Income | With Coverage | Without Coverage |
| Under $25,000 | 6,676 (93.9%) | 434 (6.1%) |
| $25,000 to $49,999 | 10,067 (91.0%) | 995 (9.0%) |
| $50,000 to $74,999 | 12,768 (92.4%) | 1,050 (7.6%) |
| $75,000 to $99,999 | 7,927 (92.7%) | 626 (7.3%) |
| $100,000 and over | 24,092 (96.7%) | 811 (3.3%) |
Public vs Private Health Insurance Coverage by Age in Eau Claire
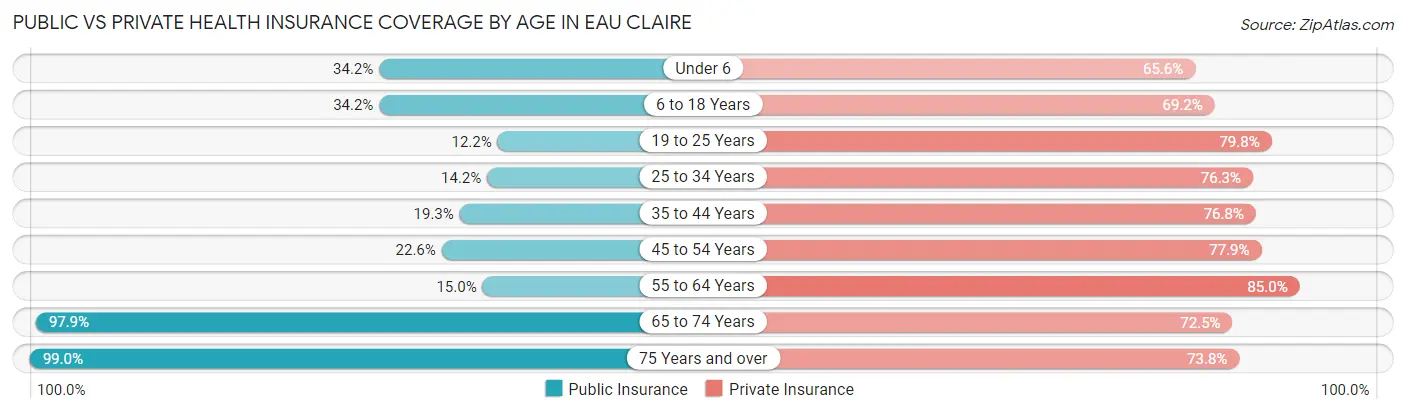
| Age Bracket | Public Insurance | Private Insurance |
| Under 6 | 1,427 (34.2%) | 2,736 (65.6%) |
| 6 to 18 Years | 3,409 (34.2%) | 6,901 (69.2%) |
| 19 to 25 Years | 1,585 (12.2%) | 10,353 (79.7%) |
| 25 to 34 Years | 1,306 (14.1%) | 7,043 (76.3%) |
| 35 to 44 Years | 1,494 (19.3%) | 5,960 (76.8%) |
| 45 to 54 Years | 1,500 (22.6%) | 5,169 (77.9%) |
| 55 to 64 Years | 1,049 (15.0%) | 5,939 (85.0%) |
| 65 to 74 Years | 6,309 (97.9%) | 4,672 (72.5%) |
| 75 Years and over | 4,439 (99.0%) | 3,306 (73.8%) |
| Total | 22,518 (32.8%) | 52,079 (75.8%) |
Disability Status by Sex by Age in Eau Claire
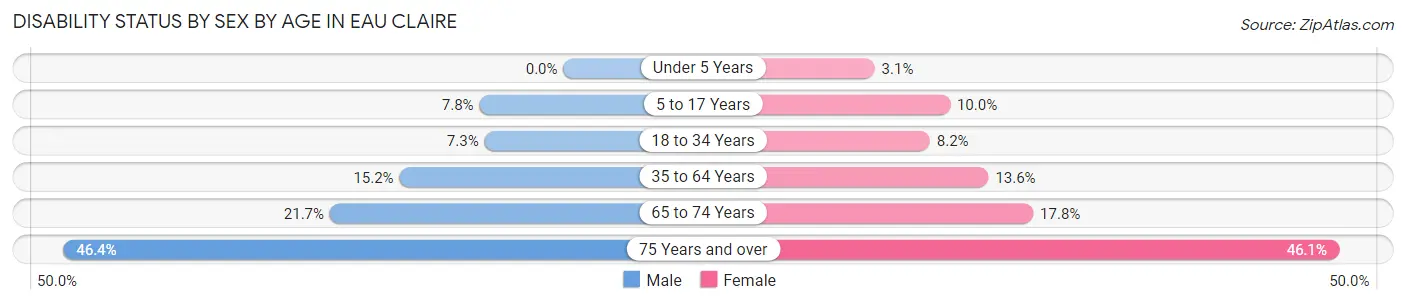
| Age Bracket | Male | Female |
| Under 5 Years | 0 (0.0%) | 51 (3.0%) |
| 5 to 17 Years | 328 (7.8%) | 461 (10.0%) |
| 18 to 34 Years | 844 (7.3%) | 1,037 (8.2%) |
| 35 to 64 Years | 1,628 (15.2%) | 1,454 (13.6%) |
| 65 to 74 Years | 656 (21.7%) | 607 (17.8%) |
| 75 Years and over | 812 (46.4%) | 1,260 (46.1%) |
Disability Class by Sex by Age in Eau Claire
Disability Class: Hearing Difficulty
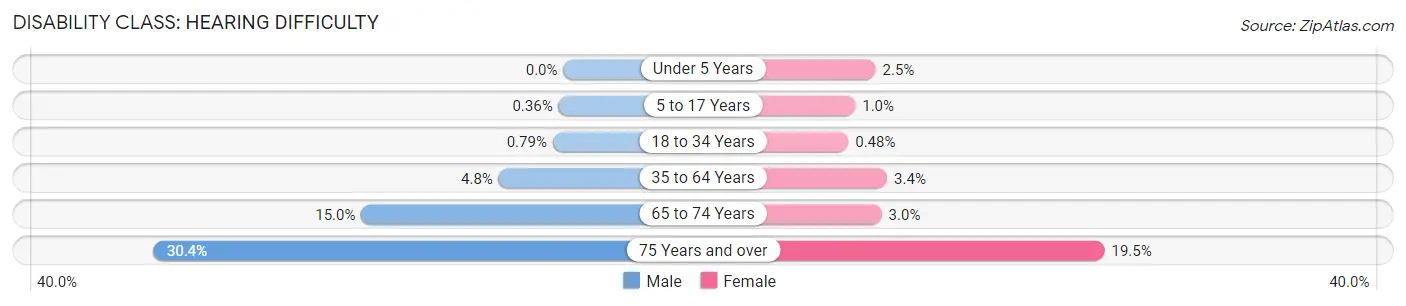
| Age Bracket | Male | Female |
| Under 5 Years | 0 (0.0%) | 42 (2.5%) |
| 5 to 17 Years | 15 (0.4%) | 46 (1.0%) |
| 18 to 34 Years | 91 (0.8%) | 61 (0.5%) |
| 35 to 64 Years | 514 (4.8%) | 360 (3.4%) |
| 65 to 74 Years | 454 (15.0%) | 101 (3.0%) |
| 75 Years and over | 532 (30.4%) | 533 (19.5%) |
Disability Class: Vision Difficulty
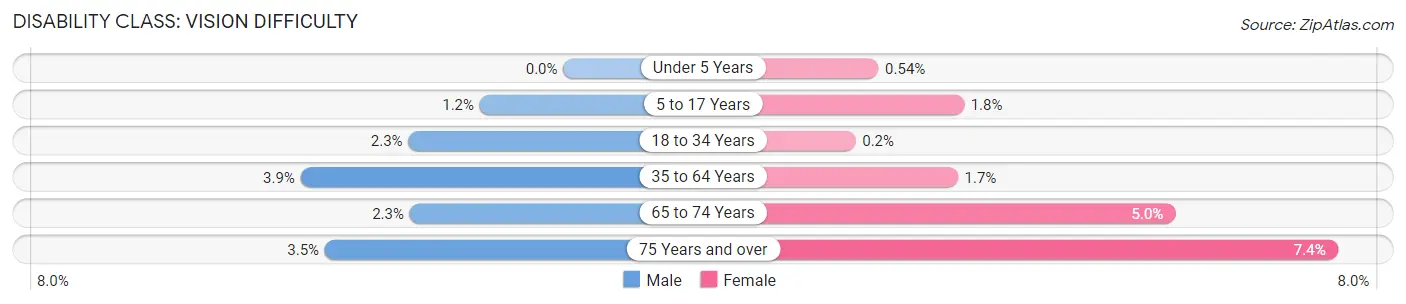
| Age Bracket | Male | Female |
| Under 5 Years | 0 (0.0%) | 9 (0.5%) |
| 5 to 17 Years | 52 (1.2%) | 83 (1.8%) |
| 18 to 34 Years | 265 (2.3%) | 25 (0.2%) |
| 35 to 64 Years | 417 (3.9%) | 184 (1.7%) |
| 65 to 74 Years | 69 (2.3%) | 169 (5.0%) |
| 75 Years and over | 62 (3.5%) | 201 (7.4%) |
Disability Class: Cognitive Difficulty
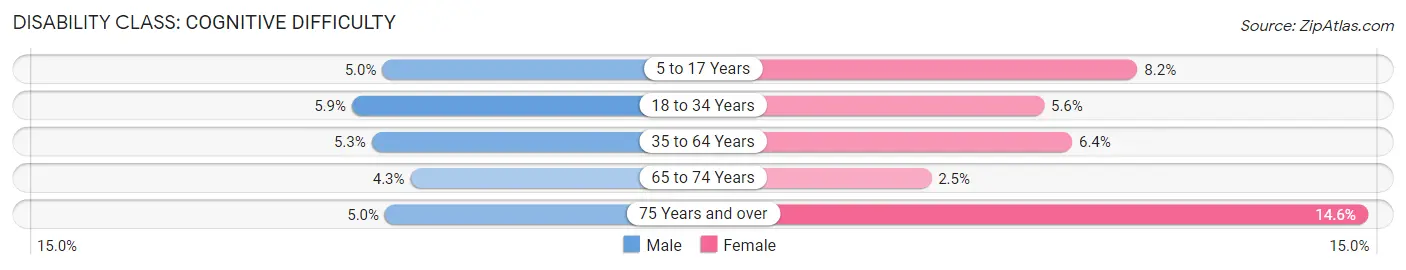
| Age Bracket | Male | Female |
| 5 to 17 Years | 212 (5.0%) | 378 (8.2%) |
| 18 to 34 Years | 680 (5.9%) | 715 (5.6%) |
| 35 to 64 Years | 572 (5.3%) | 685 (6.4%) |
| 65 to 74 Years | 129 (4.3%) | 85 (2.5%) |
| 75 Years and over | 87 (5.0%) | 400 (14.6%) |
Disability Class: Ambulatory Difficulty
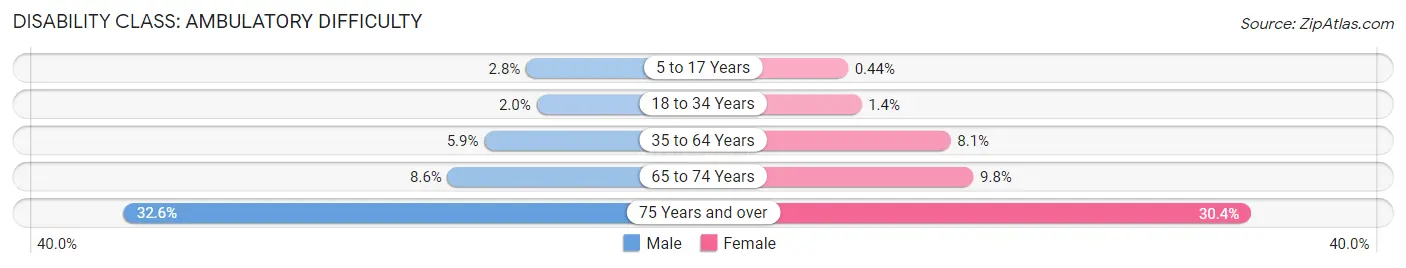
| Age Bracket | Male | Female |
| 5 to 17 Years | 116 (2.8%) | 20 (0.4%) |
| 18 to 34 Years | 230 (2.0%) | 183 (1.4%) |
| 35 to 64 Years | 628 (5.9%) | 861 (8.1%) |
| 65 to 74 Years | 260 (8.6%) | 333 (9.8%) |
| 75 Years and over | 571 (32.6%) | 830 (30.4%) |
Disability Class: Self-Care Difficulty
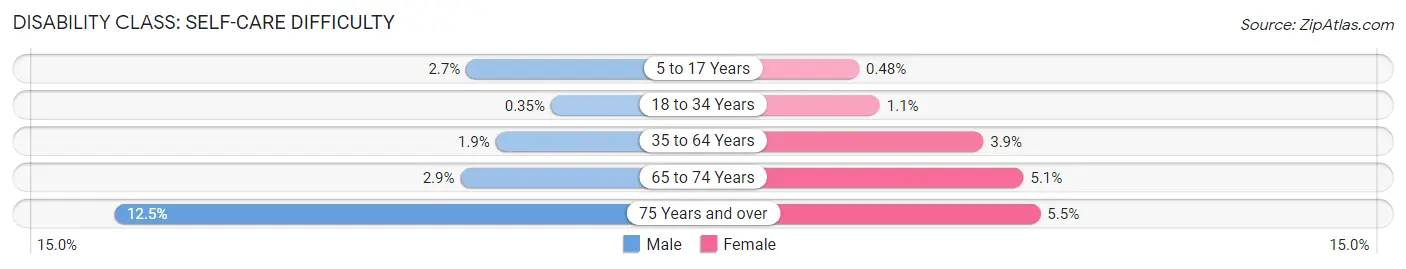
| Age Bracket | Male | Female |
| 5 to 17 Years | 114 (2.7%) | 22 (0.5%) |
| 18 to 34 Years | 40 (0.4%) | 135 (1.1%) |
| 35 to 64 Years | 202 (1.9%) | 421 (3.9%) |
| 65 to 74 Years | 87 (2.9%) | 173 (5.1%) |
| 75 Years and over | 219 (12.5%) | 151 (5.5%) |
Technology Access in Eau Claire
Computing Device Access in Eau Claire
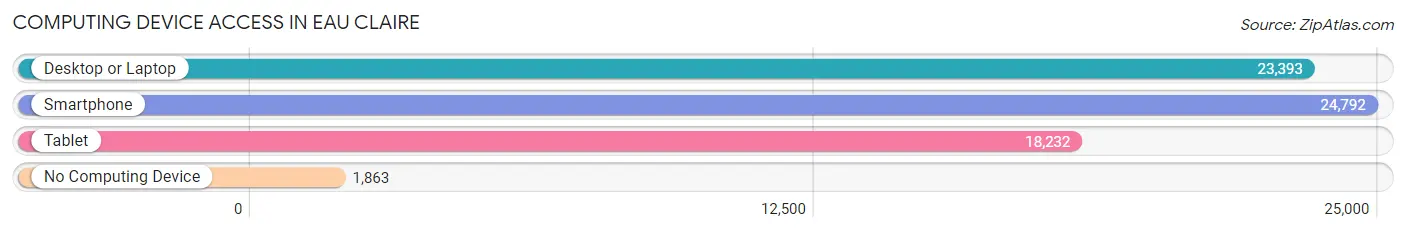
| Device Type | # Households | % Households |
| Desktop or Laptop | 23,393 | 81.1% |
| Smartphone | 24,792 | 86.0% |
| Tablet | 18,232 | 63.2% |
| No Computing Device | 1,863 | 6.5% |
| Total | 28,832 | 100.0% |
Internet Access in Eau Claire
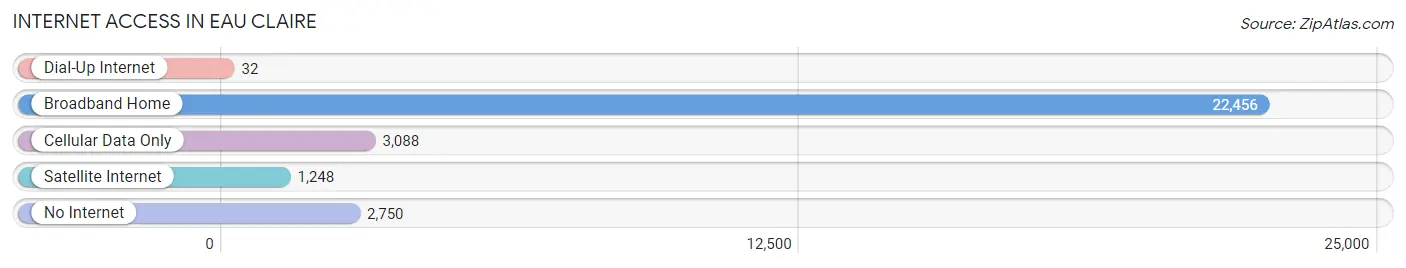
| Internet Type | # Households | % Households |
| Dial-Up Internet | 32 | 0.1% |
| Broadband Home | 22,456 | 77.9% |
| Cellular Data Only | 3,088 | 10.7% |
| Satellite Internet | 1,248 | 4.3% |
| No Internet | 2,750 | 9.5% |
| Total | 28,832 | 100.0% |
Eau Claire Summary
Eau Claire, Wisconsin is a city located in the western part of the state, in Eau Claire County. It is the county seat and the largest city in the county. The city is situated on the Chippewa River, and is home to the University of Wisconsin-Eau Claire. The city has a population of approximately 65,000 people, and is the tenth largest city in the state.
History
The area that is now Eau Claire was first settled in 1845 by French-Canadian fur traders. The city was officially founded in 1872, and was named after the Eau Claire River, which flows through the city. The city was incorporated in 1873, and the first mayor was elected in 1874.
In the late 19th century, Eau Claire was a major lumbering center, and the city was home to several large sawmills. The city was also home to a number of other industries, including a paper mill, a brewery, and a canning factory.
In the early 20th century, the city experienced a period of growth and prosperity. The city was home to several large businesses, including the Chippewa Valley Bank, the Eau Claire Leader-Telegram newspaper, and the Eau Claire Gas Company.
Geography
Eau Claire is located in the western part of Wisconsin, in Eau Claire County. The city is situated on the Chippewa River, and is surrounded by rolling hills and forests. The city is located approximately 90 miles east of Minneapolis, Minnesota, and approximately 150 miles northwest of Milwaukee, Wisconsin.
The city has a total area of 24.3 square miles, of which 24.2 square miles is land and 0.1 square miles is water. The city has a humid continental climate, with cold winters and warm summers.
Economy
Eau Claire’s economy is largely based on healthcare, education, and manufacturing. The city is home to several large employers, including the Mayo Clinic Health System, the University of Wisconsin-Eau Claire, and the Chippewa Valley Technical College.
The city is also home to several large manufacturing companies, including Trane, a manufacturer of heating and cooling systems, and Charter NEX Films, a manufacturer of plastic films. The city is also home to several large retail stores, including Walmart, Target, and Kohl’s.
Demographics
As of the 2010 census, the population of Eau Claire was 65,883. The racial makeup of the city was 90.2% White, 3.3% African American, 0.7% Native American, 2.3% Asian, 0.2% Pacific Islander, 1.3% from other races, and 2.2% from two or more races. Hispanic or Latino of any race were 4.2% of the population.
The median household income in the city was $41,945, and the median family income was $54,817. The per capita income in the city was $22,845. About 11.2% of the population was below the poverty line.
Common Questions
What is Per Capita Income in Eau Claire?
Per Capita income in Eau Claire is $35,925.
What is the Median Family Income in Eau Claire?
Median Family Income in Eau Claire is $93,916.
What is the Median Household income in Eau Claire?
Median Household Income in Eau Claire is $63,882.
What is Income or Wage Gap in Eau Claire?
Income or Wage Gap in Eau Claire is 35.1%.
Women in Eau Claire earn 64.9 cents for every dollar earned by a man.
What is Family Income Deficit in Eau Claire?
Family Income Deficit in Eau Claire is $10,473.
Families that are below poverty line in Eau Claire earn $10,473 less on average than the poverty threshold level.
What is Inequality or Gini Index in Eau Claire?
Inequality or Gini Index in Eau Claire is 0.43.
What is the Total Population of Eau Claire?
Total Population of Eau Claire is 69,098.
What is the Total Male Population of Eau Claire?
Total Male Population of Eau Claire is 33,133.
What is the Total Female Population of Eau Claire?
Total Female Population of Eau Claire is 35,965.
What is the Ratio of Males per 100 Females in Eau Claire?
There are 92.13 Males per 100 Females in Eau Claire.
What is the Ratio of Females per 100 Males in Eau Claire?
There are 108.55 Females per 100 Males in Eau Claire.
What is the Median Population Age in Eau Claire?
Median Population Age in Eau Claire is 32.8 Years.
What is the Average Family Size in Eau Claire
Average Family Size in Eau Claire is 2.9 People.
What is the Average Household Size in Eau Claire
Average Household Size in Eau Claire is 2.3 People.
How Large is the Labor Force in Eau Claire?
There are 40,468 People in the Labor Forcein in Eau Claire.
What is the Percentage of People in the Labor Force in Eau Claire?
69.5% of People are in the Labor Force in Eau Claire.
What is the Unemployment Rate in Eau Claire?
Unemployment Rate in Eau Claire is 3.6%.