Sun Prairie, WI Map & Demographics
Sun Prairie Map
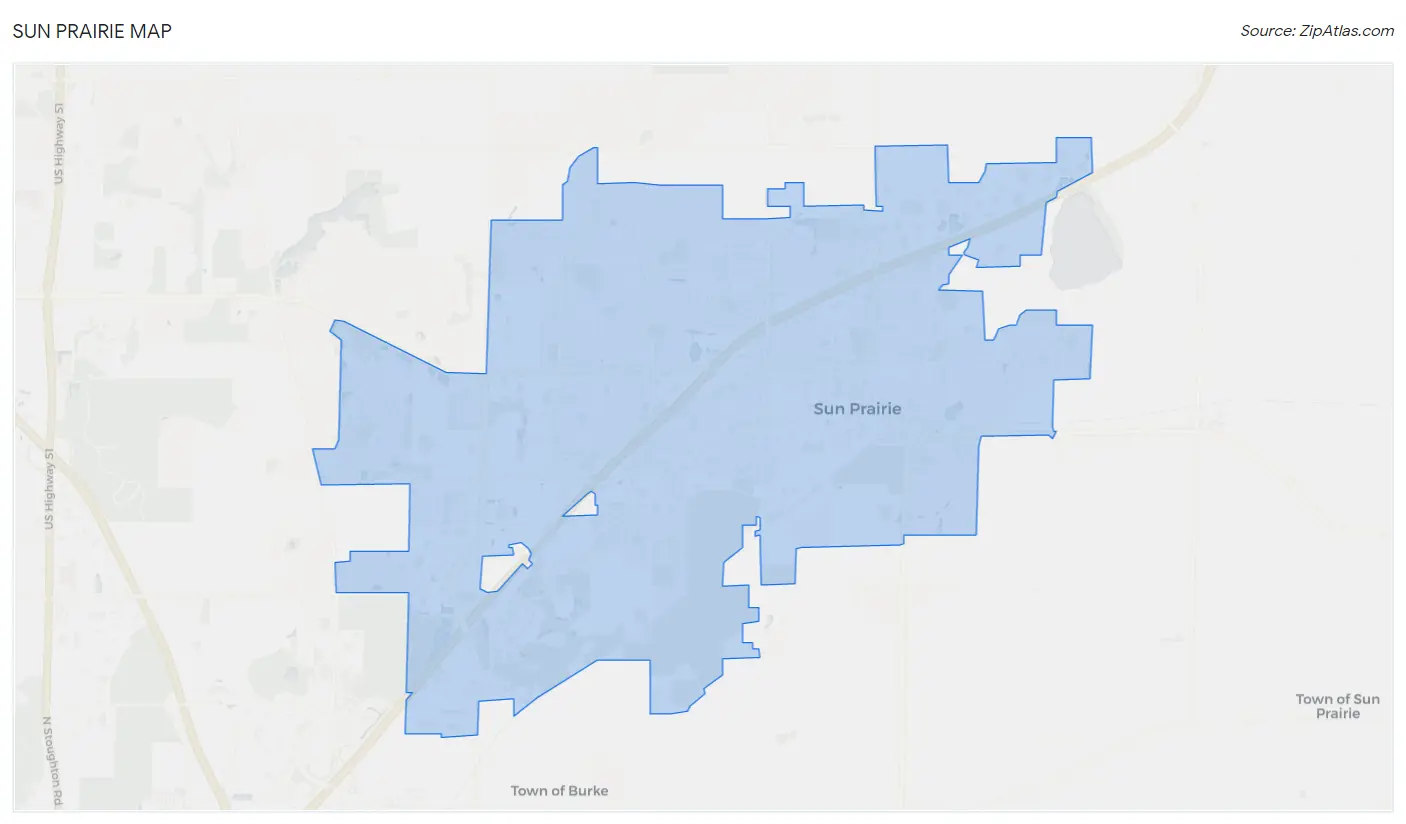
Sun Prairie Overview
$44,260
PER CAPITA INCOME
$112,828
AVG FAMILY INCOME
$90,384
AVG HOUSEHOLD INCOME
25.4%
WAGE / INCOME GAP [ % ]
74.6¢/ $1
WAGE / INCOME GAP [ $ ]
0.37
INEQUALITY / GINI INDEX
35,847
TOTAL POPULATION
17,523
MALE POPULATION
18,324
FEMALE POPULATION
95.63
MALES / 100 FEMALES
104.57
FEMALES / 100 MALES
37.7
MEDIAN AGE
3.0
AVG FAMILY SIZE
2.4
AVG HOUSEHOLD SIZE
20,438
LABOR FORCE [ PEOPLE ]
72.4%
PERCENT IN LABOR FORCE
1.6%
UNEMPLOYMENT RATE
Sun Prairie Zip Codes
Sun Prairie Area Codes
Income in Sun Prairie
Income Overview in Sun Prairie
Per Capita Income in Sun Prairie is $44,260, while median incomes of families and households are $112,828 and $90,384 respectively.
| Characteristic | Number | Measure |
| Per Capita Income | 35,847 | $44,260 |
| Median Family Income | 9,146 | $112,828 |
| Mean Family Income | 9,146 | $126,156 |
| Median Household Income | 14,697 | $90,384 |
| Mean Household Income | 14,697 | $106,786 |
| Income Deficit | 9,146 | $0 |
| Wage / Income Gap (%) | 35,847 | 25.39% |
| Wage / Income Gap ($) | 35,847 | 74.61¢ per $1 |
| Gini / Inequality Index | 35,847 | 0.37 |
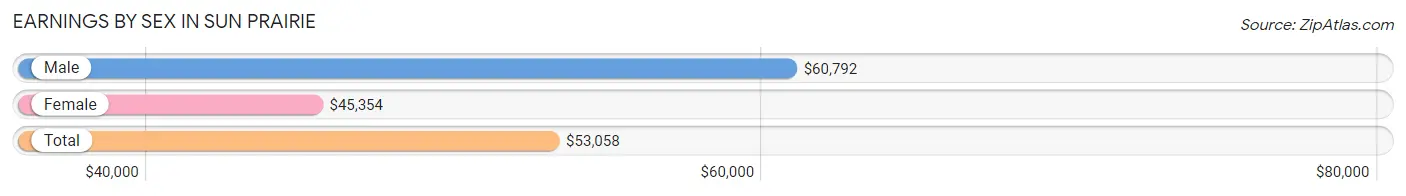
Earnings by Sex in Sun Prairie
Average Earnings in Sun Prairie are $53,058, $60,792 for men and $45,354 for women, a difference of 25.4%.
| Sex | Number | Average Earnings |
| Male | 10,929 (52.0%) | $60,792 |
| Female | 10,101 (48.0%) | $45,354 |
| Total | 21,030 (100.0%) | $53,058 |
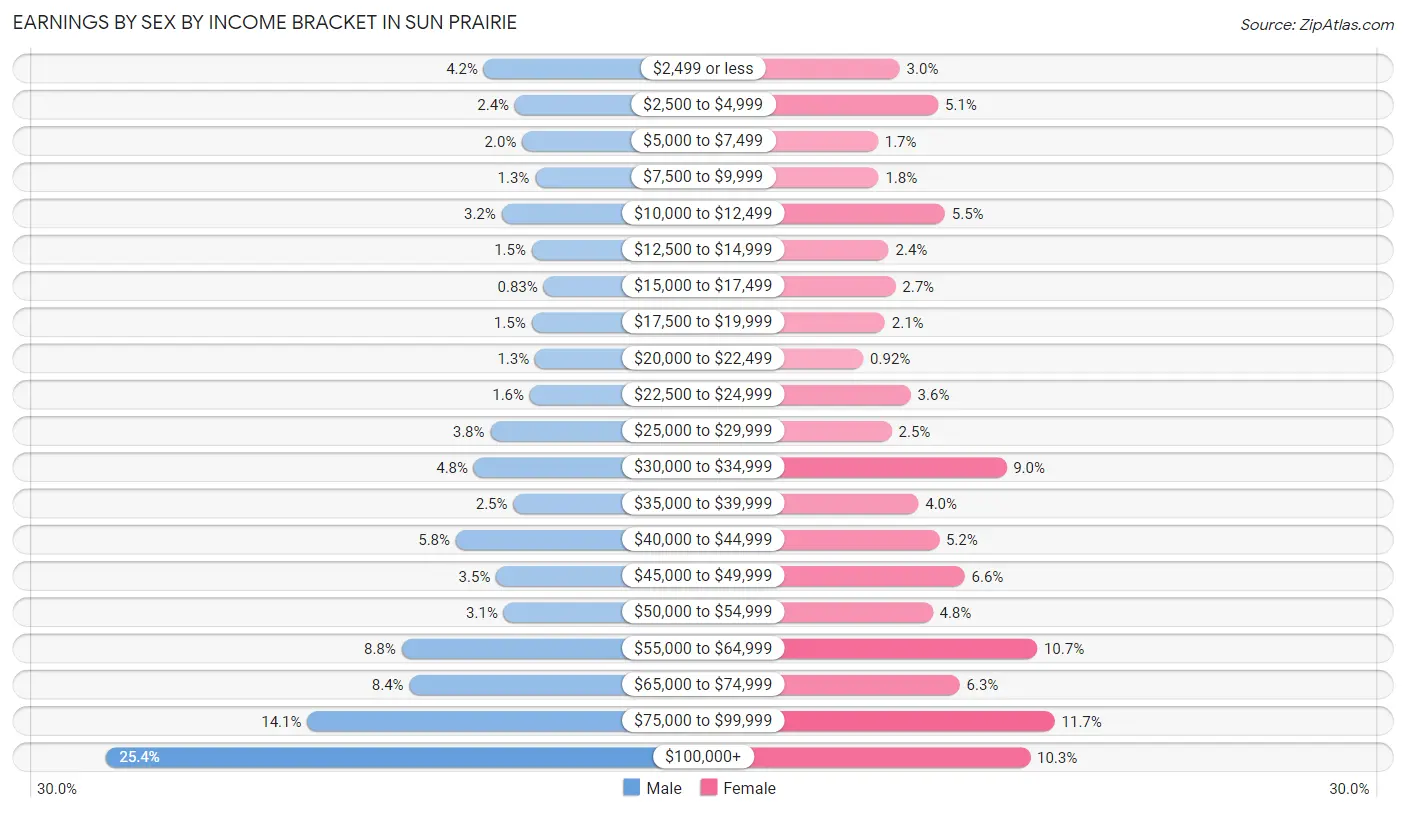
Earnings by Sex by Income Bracket in Sun Prairie
The most common earnings brackets in Sun Prairie are $100,000+ for men (2,776 | 25.4%) and $75,000 to $99,999 for women (1,180 | 11.7%).
| Income | Male | Female |
| $2,499 or less | 458 (4.2%) | 300 (3.0%) |
| $2,500 to $4,999 | 267 (2.4%) | 518 (5.1%) |
| $5,000 to $7,499 | 222 (2.0%) | 176 (1.7%) |
| $7,500 to $9,999 | 142 (1.3%) | 180 (1.8%) |
| $10,000 to $12,499 | 349 (3.2%) | 557 (5.5%) |
| $12,500 to $14,999 | 163 (1.5%) | 237 (2.4%) |
| $15,000 to $17,499 | 91 (0.8%) | 276 (2.7%) |
| $17,500 to $19,999 | 165 (1.5%) | 216 (2.1%) |
| $20,000 to $22,499 | 143 (1.3%) | 93 (0.9%) |
| $22,500 to $24,999 | 175 (1.6%) | 363 (3.6%) |
| $25,000 to $29,999 | 417 (3.8%) | 255 (2.5%) |
| $30,000 to $34,999 | 519 (4.8%) | 905 (9.0%) |
| $35,000 to $39,999 | 276 (2.5%) | 406 (4.0%) |
| $40,000 to $44,999 | 630 (5.8%) | 523 (5.2%) |
| $45,000 to $49,999 | 381 (3.5%) | 669 (6.6%) |
| $50,000 to $54,999 | 335 (3.1%) | 487 (4.8%) |
| $55,000 to $64,999 | 963 (8.8%) | 1,080 (10.7%) |
| $65,000 to $74,999 | 915 (8.4%) | 640 (6.3%) |
| $75,000 to $99,999 | 1,542 (14.1%) | 1,180 (11.7%) |
| $100,000+ | 2,776 (25.4%) | 1,040 (10.3%) |
| Total | 10,929 (100.0%) | 10,101 (100.0%) |
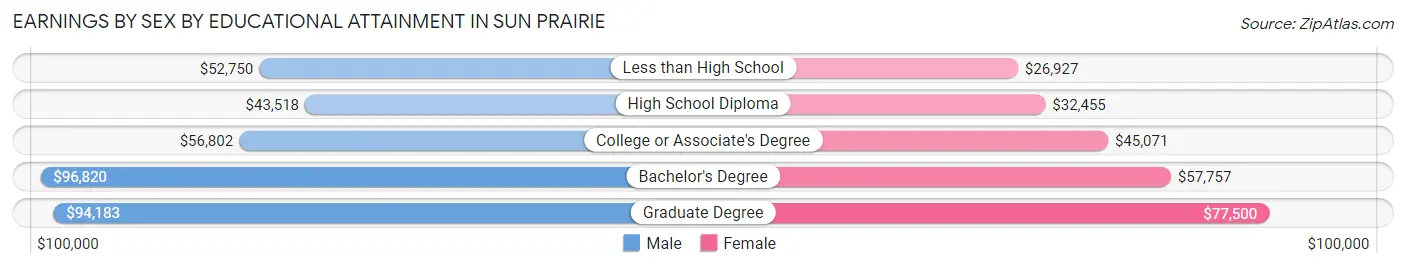
Earnings by Sex by Educational Attainment in Sun Prairie
Average earnings in Sun Prairie are $69,427 for men and $50,797 for women, a difference of 26.8%. Men with an educational attainment of bachelor's degree enjoy the highest average annual earnings of $96,820, while those with high school diploma education earn the least with $43,518. Women with an educational attainment of graduate degree earn the most with the average annual earnings of $77,500, while those with less than high school education have the smallest earnings of $26,927.
| Educational Attainment | Male Income | Female Income |
| Less than High School | $52,750 | $26,927 |
| High School Diploma | $43,518 | $32,455 |
| College or Associate's Degree | $56,802 | $45,071 |
| Bachelor's Degree | $96,820 | $57,757 |
| Graduate Degree | $94,183 | $77,500 |
| Total | $69,427 | $50,797 |
Family Income in Sun Prairie
Family Income Brackets in Sun Prairie
According to the Sun Prairie family income data, there are 2,341 families falling into the $100,000 to $149,999 income range, which is the most common income bracket and makes up 25.6% of all families. Conversely, the $10,000 to $14,999 income bracket is the least frequent group with only 9 families (0.1%) belonging to this category.
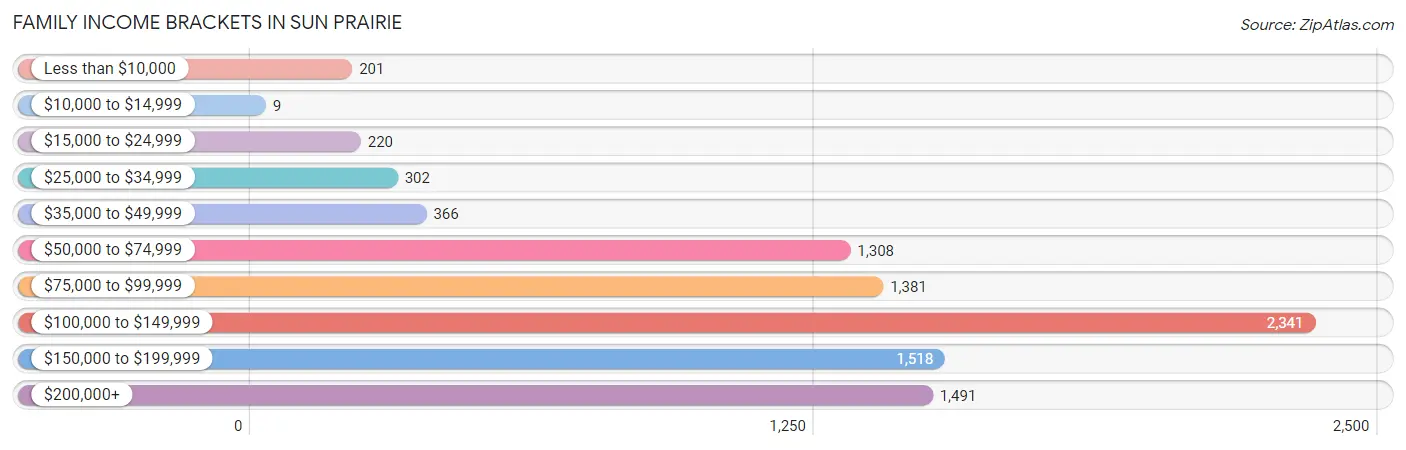
| Income Bracket | # Families | % Families |
| Less than $10,000 | 201 | 2.2% |
| $10,000 to $14,999 | 9 | 0.1% |
| $15,000 to $24,999 | 220 | 2.4% |
| $25,000 to $34,999 | 302 | 3.3% |
| $35,000 to $49,999 | 366 | 4.0% |
| $50,000 to $74,999 | 1,308 | 14.3% |
| $75,000 to $99,999 | 1,381 | 15.1% |
| $100,000 to $149,999 | 2,341 | 25.6% |
| $150,000 to $199,999 | 1,518 | 16.6% |
| $200,000+ | 1,491 | 16.3% |
Family Income by Famaliy Size in Sun Prairie
6-person families (177 | 1.9%) account for the highest median family income in Sun Prairie with $154,729 per family, while 2-person families (4,152 | 45.4%) have the highest median income of $46,984 per family member.
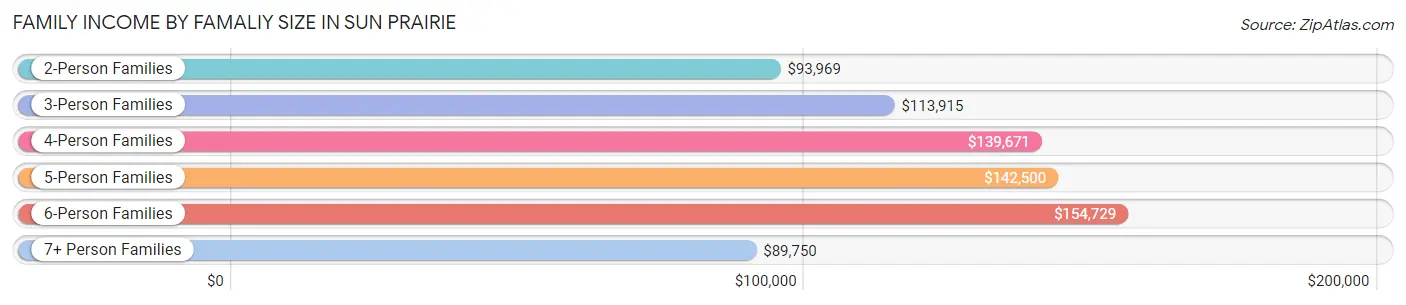
| Income Bracket | # Families | Median Income |
| 2-Person Families | 4,152 (45.4%) | $93,969 |
| 3-Person Families | 2,155 (23.6%) | $113,915 |
| 4-Person Families | 1,632 (17.8%) | $139,671 |
| 5-Person Families | 946 (10.3%) | $142,500 |
| 6-Person Families | 177 (1.9%) | $154,729 |
| 7+ Person Families | 84 (0.9%) | $89,750 |
| Total | 9,146 (100.0%) | $112,828 |
Family Income by Number of Earners in Sun Prairie
The median family income in Sun Prairie is $112,828, with families comprising 3+ earners (1,459) having the highest median family income of $153,143, while families with no earners (1,444) have the lowest median family income of $61,994, accounting for 16.0% and 15.8% of families, respectively.
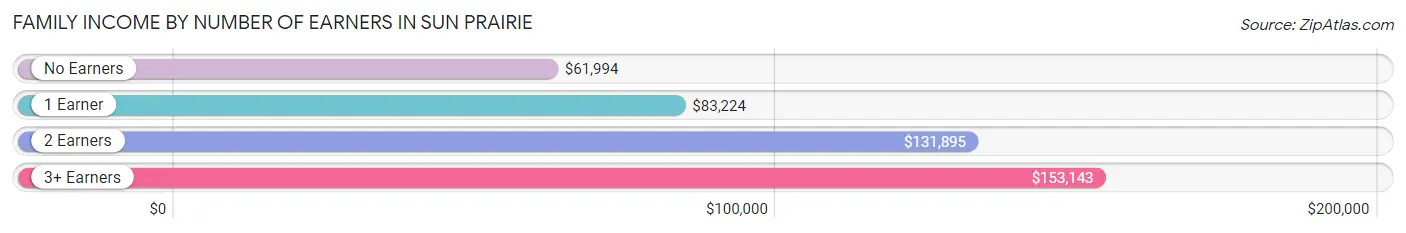
| Number of Earners | # Families | Median Income |
| No Earners | 1,444 (15.8%) | $61,994 |
| 1 Earner | 1,861 (20.3%) | $83,224 |
| 2 Earners | 4,382 (47.9%) | $131,895 |
| 3+ Earners | 1,459 (16.0%) | $153,143 |
| Total | 9,146 (100.0%) | $112,828 |
Household Income in Sun Prairie
Household Income Brackets in Sun Prairie
With 2,822 households falling in the category, the $50,000 to $74,999 income range is the most frequent in Sun Prairie, accounting for 19.2% of all households. In contrast, only 220 households (1.5%) fall into the $10,000 to $14,999 income bracket, making it the least populous group.
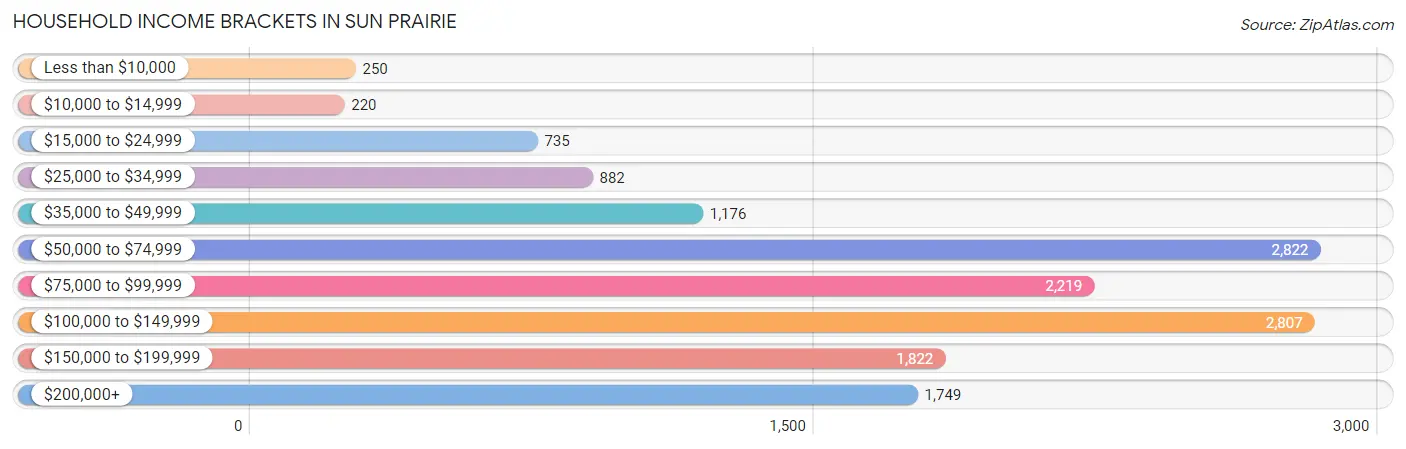
| Income Bracket | # Households | % Households |
| Less than $10,000 | 250 | 1.7% |
| $10,000 to $14,999 | 220 | 1.5% |
| $15,000 to $24,999 | 735 | 5.0% |
| $25,000 to $34,999 | 882 | 6.0% |
| $35,000 to $49,999 | 1,176 | 8.0% |
| $50,000 to $74,999 | 2,822 | 19.2% |
| $75,000 to $99,999 | 2,219 | 15.1% |
| $100,000 to $149,999 | 2,807 | 19.1% |
| $150,000 to $199,999 | 1,822 | 12.4% |
| $200,000+ | 1,749 | 11.9% |
Household Income by Householder Age in Sun Prairie
The median household income in Sun Prairie is $90,384, with the highest median household income of $114,290 found in the 45 to 64 years age bracket for the primary householder. A total of 4,834 households (32.9%) fall into this category. Meanwhile, the 15 to 24 years age bracket for the primary householder has the lowest median household income of $44,594, with 577 households (3.9%) in this group.
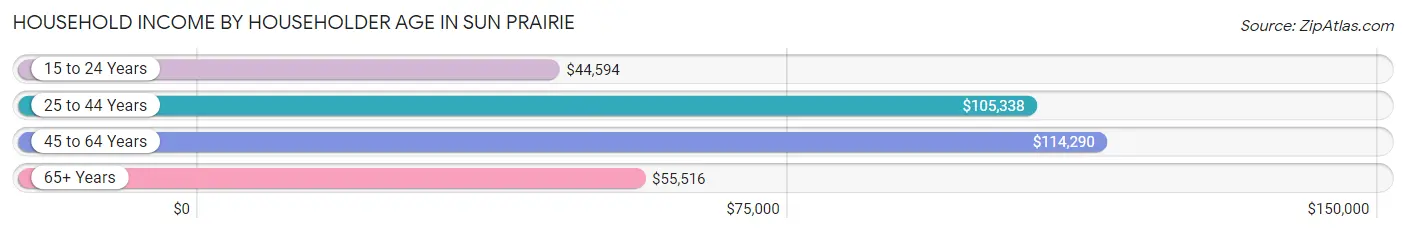
| Income Bracket | # Households | Median Income |
| 15 to 24 Years | 577 (3.9%) | $44,594 |
| 25 to 44 Years | 5,776 (39.3%) | $105,338 |
| 45 to 64 Years | 4,834 (32.9%) | $114,290 |
| 65+ Years | 3,510 (23.9%) | $55,516 |
| Total | 14,697 (100.0%) | $90,384 |
Poverty in Sun Prairie
Income Below Poverty by Sex and Age in Sun Prairie
With 5.6% poverty level for males and 6.4% for females among the residents of Sun Prairie, 15 year old males and 18 to 24 year old females are the most vulnerable to poverty, with 62 males (17.8%) and 225 females (15.2%) in their respective age groups living below the poverty level.
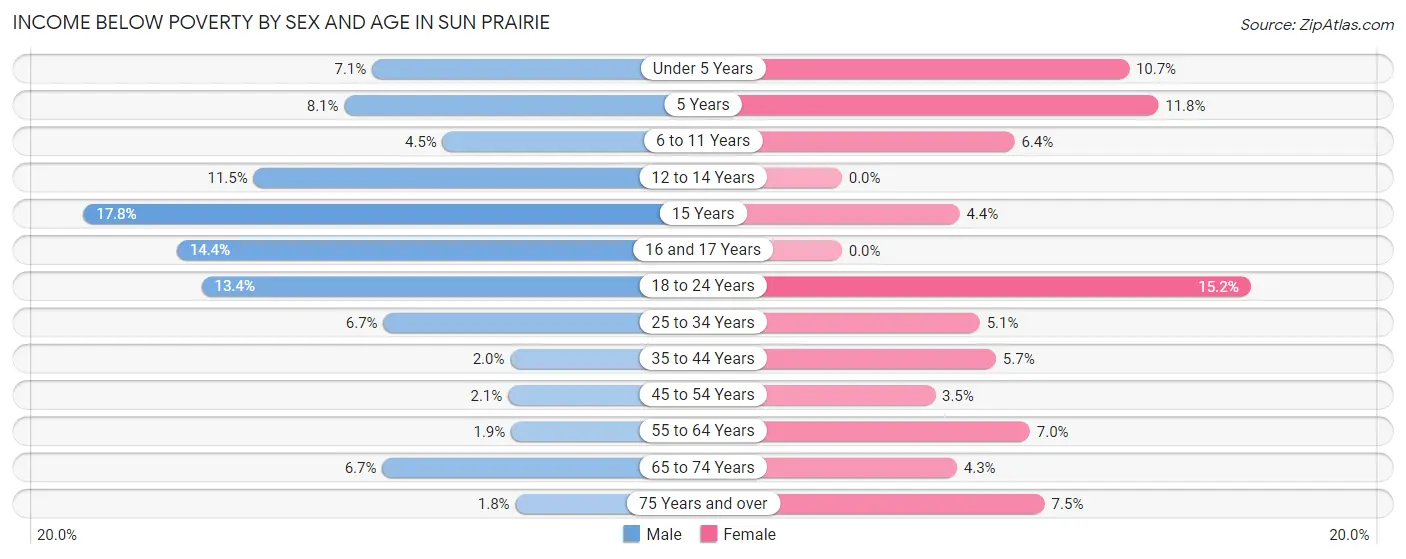
| Age Bracket | Male | Female |
| Under 5 Years | 77 (7.1%) | 98 (10.7%) |
| 5 Years | 23 (8.1%) | 41 (11.7%) |
| 6 to 11 Years | 70 (4.5%) | 77 (6.4%) |
| 12 to 14 Years | 93 (11.5%) | 0 (0.0%) |
| 15 Years | 62 (17.8%) | 10 (4.4%) |
| 16 and 17 Years | 93 (14.3%) | 0 (0.0%) |
| 18 to 24 Years | 165 (13.4%) | 225 (15.2%) |
| 25 to 34 Years | 165 (6.7%) | 128 (5.1%) |
| 35 to 44 Years | 59 (2.0%) | 166 (5.7%) |
| 45 to 54 Years | 41 (2.1%) | 74 (3.5%) |
| 55 to 64 Years | 40 (1.9%) | 153 (7.0%) |
| 65 to 74 Years | 76 (6.7%) | 65 (4.3%) |
| 75 Years and over | 13 (1.8%) | 125 (7.5%) |
| Total | 977 (5.6%) | 1,162 (6.4%) |
Income Above Poverty by Sex and Age in Sun Prairie
According to the poverty statistics in Sun Prairie, males aged 75 years and over and females aged 12 to 14 years are the age groups that are most secure financially, with 98.2% of males and 100.0% of females in these age groups living above the poverty line.
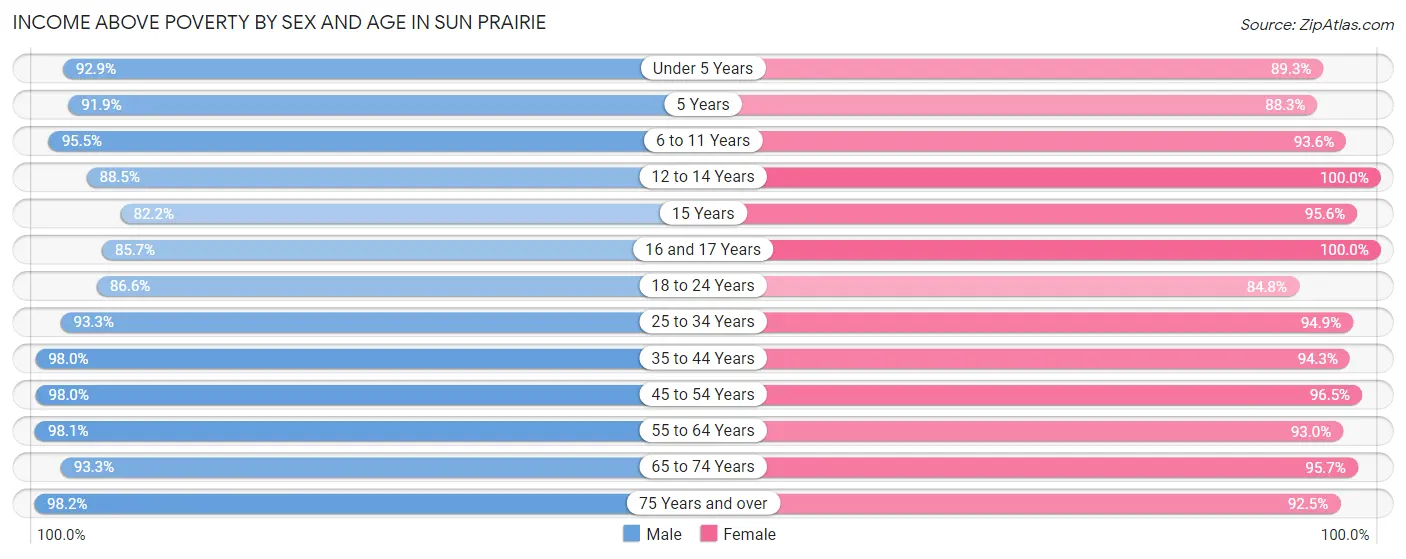
| Age Bracket | Male | Female |
| Under 5 Years | 1,008 (92.9%) | 821 (89.3%) |
| 5 Years | 260 (91.9%) | 308 (88.2%) |
| 6 to 11 Years | 1,493 (95.5%) | 1,124 (93.6%) |
| 12 to 14 Years | 716 (88.5%) | 682 (100.0%) |
| 15 Years | 286 (82.2%) | 219 (95.6%) |
| 16 and 17 Years | 555 (85.7%) | 440 (100.0%) |
| 18 to 24 Years | 1,064 (86.6%) | 1,258 (84.8%) |
| 25 to 34 Years | 2,305 (93.3%) | 2,372 (94.9%) |
| 35 to 44 Years | 2,938 (98.0%) | 2,737 (94.3%) |
| 45 to 54 Years | 1,956 (98.0%) | 2,066 (96.5%) |
| 55 to 64 Years | 2,018 (98.1%) | 2,039 (93.0%) |
| 65 to 74 Years | 1,055 (93.3%) | 1,457 (95.7%) |
| 75 Years and over | 718 (98.2%) | 1,534 (92.5%) |
| Total | 16,372 (94.4%) | 17,057 (93.6%) |
Income Below Poverty Among Married-Couple Families in Sun Prairie
The poverty statistics for married-couple families in Sun Prairie show that 1.9% or 142 of the total 7,332 families live below the poverty line. Families with 3 or 4 children have the highest poverty rate of 2.1%, comprising of 16 families. On the other hand, families with 5 or more children have the lowest poverty rate of 0.0%, which includes 0 families.
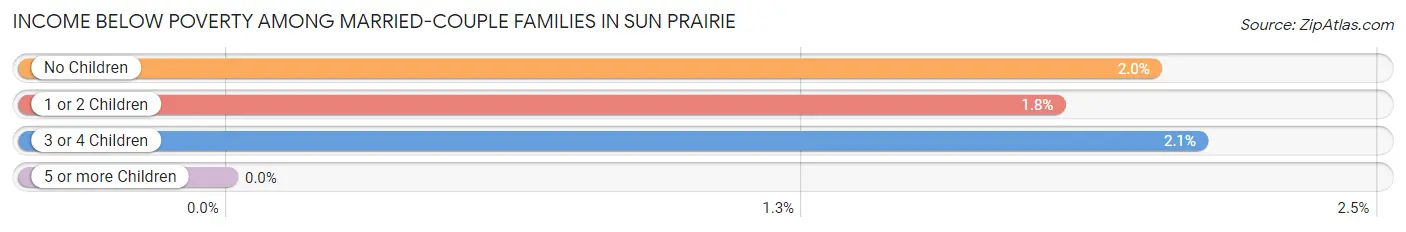
| Children | Above Poverty | Below Poverty |
| No Children | 3,953 (98.0%) | 81 (2.0%) |
| 1 or 2 Children | 2,454 (98.2%) | 45 (1.8%) |
| 3 or 4 Children | 743 (97.9%) | 16 (2.1%) |
| 5 or more Children | 40 (100.0%) | 0 (0.0%) |
| Total | 7,190 (98.1%) | 142 (1.9%) |
Income Below Poverty Among Single-Parent Households in Sun Prairie
According to the poverty data in Sun Prairie, 5.8% or 34 single-father households and 17.0% or 208 single-mother households are living below the poverty line. Among single-father households, those with 3 or 4 children have the highest poverty rate, with 34 households (25.6%) experiencing poverty. Likewise, among single-mother households, those with 5 or more children have the highest poverty rate, with 6 households (100.0%) falling below the poverty line.
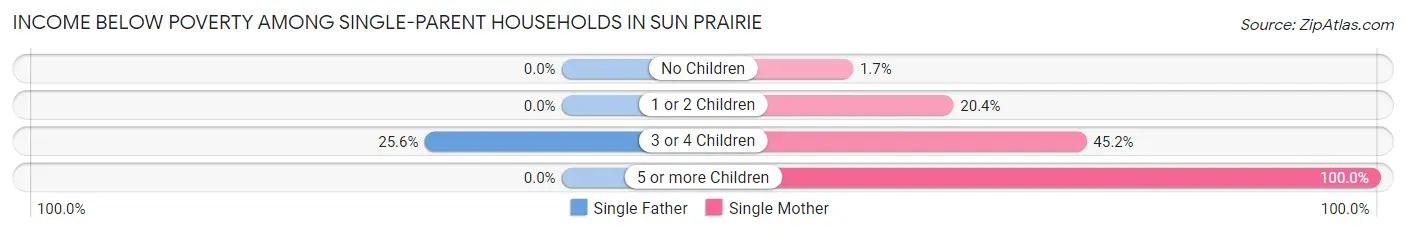
| Children | Single Father | Single Mother |
| No Children | 0 (0.0%) | 6 (1.7%) |
| 1 or 2 Children | 0 (0.0%) | 163 (20.4%) |
| 3 or 4 Children | 34 (25.6%) | 33 (45.2%) |
| 5 or more Children | 0 (0.0%) | 6 (100.0%) |
| Total | 34 (5.8%) | 208 (17.0%) |
Income Below Poverty Among Married-Couple vs Single-Parent Households in Sun Prairie
The poverty data for Sun Prairie shows that 142 of the married-couple family households (1.9%) and 242 of the single-parent households (13.3%) are living below the poverty level. Within the married-couple family households, those with 3 or 4 children have the highest poverty rate, with 16 households (2.1%) falling below the poverty line. Among the single-parent households, those with 5 or more children have the highest poverty rate, with 6 household (100.0%) living below poverty.
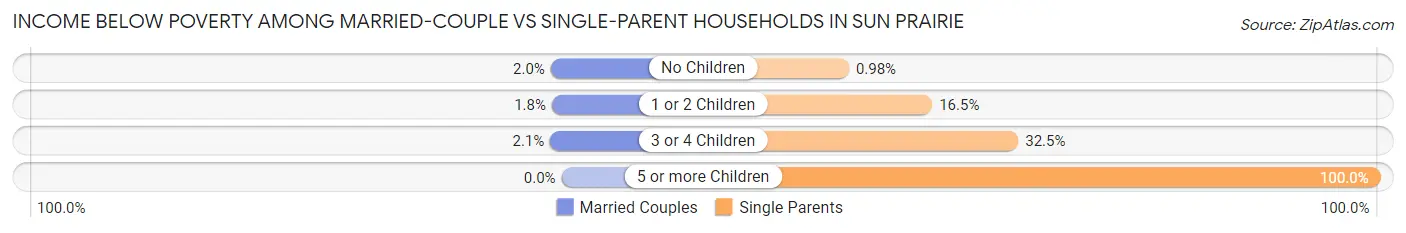
| Children | Married-Couple Families | Single-Parent Households |
| No Children | 81 (2.0%) | 6 (1.0%) |
| 1 or 2 Children | 45 (1.8%) | 163 (16.5%) |
| 3 or 4 Children | 16 (2.1%) | 67 (32.5%) |
| 5 or more Children | 0 (0.0%) | 6 (100.0%) |
| Total | 142 (1.9%) | 242 (13.3%) |
Race in Sun Prairie
The most populous races in Sun Prairie are White / Caucasian (28,219 | 78.7%), Black / African American (2,750 | 7.7%), and Asian (2,454 | 6.9%).
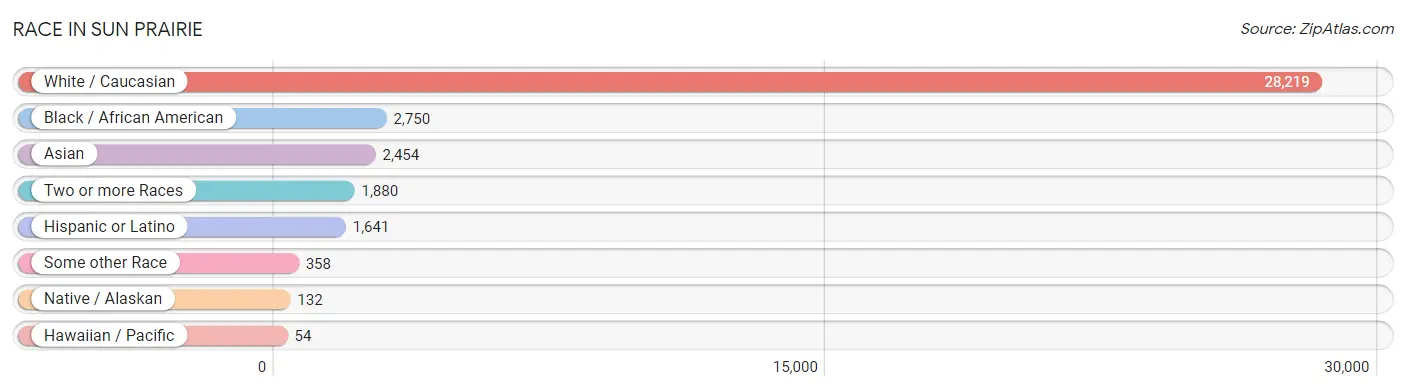
| Race | # Population | % Population |
| Asian | 2,454 | 6.9% |
| Black / African American | 2,750 | 7.7% |
| Hawaiian / Pacific | 54 | 0.2% |
| Hispanic or Latino | 1,641 | 4.6% |
| Native / Alaskan | 132 | 0.4% |
| White / Caucasian | 28,219 | 78.7% |
| Two or more Races | 1,880 | 5.2% |
| Some other Race | 358 | 1.0% |
| Total | 35,847 | 100.0% |
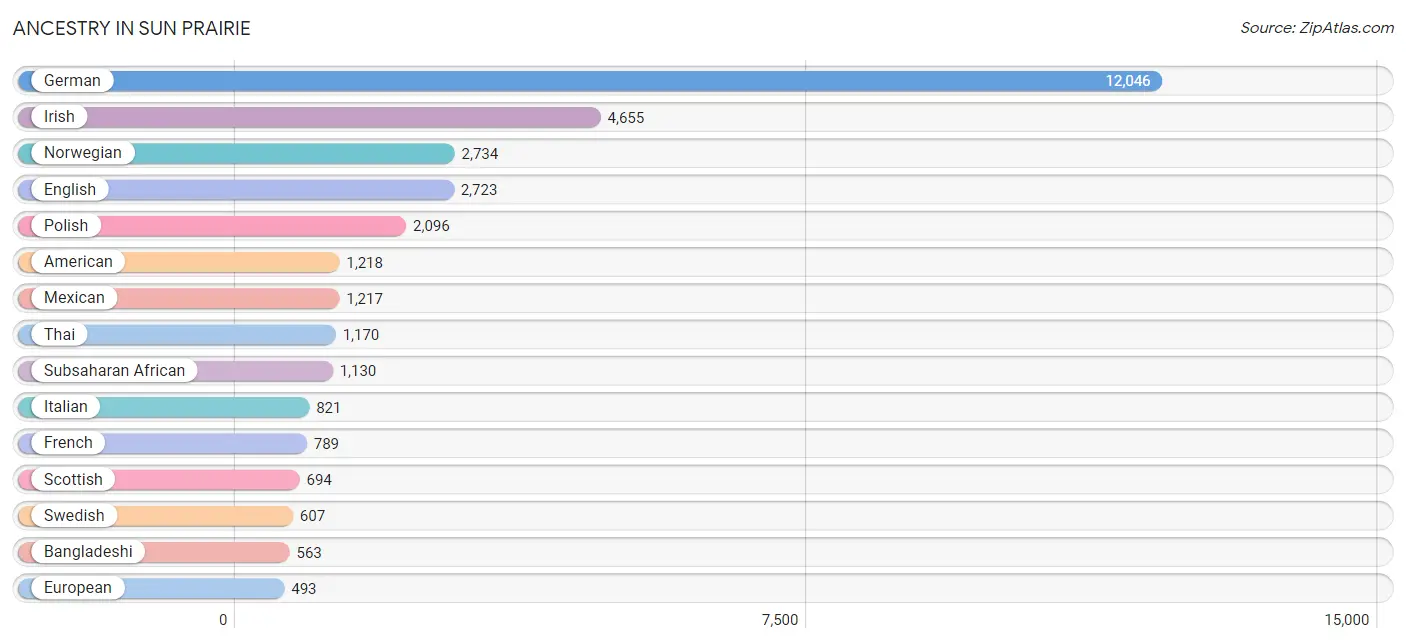
Ancestry in Sun Prairie
The most populous ancestries reported in Sun Prairie are German (12,046 | 33.6%), Irish (4,655 | 13.0%), Norwegian (2,734 | 7.6%), English (2,723 | 7.6%), and Polish (2,096 | 5.9%), together accounting for 67.7% of all Sun Prairie residents.
| Ancestry | # Population | % Population |
| African | 361 | 1.0% |
| Albanian | 29 | 0.1% |
| American | 1,218 | 3.4% |
| Arab | 73 | 0.2% |
| Armenian | 21 | 0.1% |
| Austrian | 56 | 0.2% |
| Bangladeshi | 563 | 1.6% |
| Belgian | 110 | 0.3% |
| Bhutanese | 88 | 0.3% |
| Blackfeet | 43 | 0.1% |
| British | 44 | 0.1% |
| Burmese | 166 | 0.5% |
| Cambodian | 26 | 0.1% |
| Central American | 10 | 0.0% |
| Central American Indian | 134 | 0.4% |
| Cherokee | 48 | 0.1% |
| Chippewa | 13 | 0.0% |
| Colombian | 19 | 0.1% |
| Croatian | 184 | 0.5% |
| Czech | 258 | 0.7% |
| Danish | 123 | 0.3% |
| Dutch | 487 | 1.4% |
| Eastern European | 121 | 0.3% |
| Egyptian | 51 | 0.1% |
| English | 2,723 | 7.6% |
| Estonian | 8 | 0.0% |
| European | 493 | 1.4% |
| Finnish | 49 | 0.1% |
| French | 789 | 2.2% |
| French Canadian | 159 | 0.4% |
| German | 12,046 | 33.6% |
| Greek | 98 | 0.3% |
| Guamanian / Chamorro | 42 | 0.1% |
| Hungarian | 121 | 0.3% |
| Icelander | 16 | 0.0% |
| Indian (Asian) | 352 | 1.0% |
| Irish | 4,655 | 13.0% |
| Iroquois | 48 | 0.1% |
| Italian | 821 | 2.3% |
| Jamaican | 40 | 0.1% |
| Japanese | 74 | 0.2% |
| Kenyan | 140 | 0.4% |
| Korean | 131 | 0.4% |
| Lebanese | 22 | 0.1% |
| Liberian | 33 | 0.1% |
| Lithuanian | 91 | 0.3% |
| Luxembourger | 32 | 0.1% |
| Maltese | 16 | 0.0% |
| Mexican | 1,217 | 3.4% |
| Mexican American Indian | 35 | 0.1% |
| Native Hawaiian | 3 | 0.0% |
| Navajo | 50 | 0.1% |
| Nicaraguan | 10 | 0.0% |
| Nigerian | 10 | 0.0% |
| Northern European | 451 | 1.3% |
| Norwegian | 2,734 | 7.6% |
| Pennsylvania German | 18 | 0.1% |
| Polish | 2,096 | 5.9% |
| Portuguese | 84 | 0.2% |
| Puerto Rican | 242 | 0.7% |
| Russian | 244 | 0.7% |
| Samoan | 9 | 0.0% |
| Scandinavian | 161 | 0.4% |
| Scotch-Irish | 137 | 0.4% |
| Scottish | 694 | 1.9% |
| Serbian | 3 | 0.0% |
| Sioux | 39 | 0.1% |
| Slavic | 15 | 0.0% |
| Slovak | 32 | 0.1% |
| Slovene | 25 | 0.1% |
| South American | 19 | 0.1% |
| Spanish | 136 | 0.4% |
| Sri Lankan | 80 | 0.2% |
| Subsaharan African | 1,130 | 3.2% |
| Swedish | 607 | 1.7% |
| Swiss | 246 | 0.7% |
| Thai | 1,170 | 3.3% |
| Ukrainian | 128 | 0.4% |
| Welsh | 158 | 0.4% |
| Yaqui | 14 | 0.0% | View All 80 Rows |
Immigrants in Sun Prairie
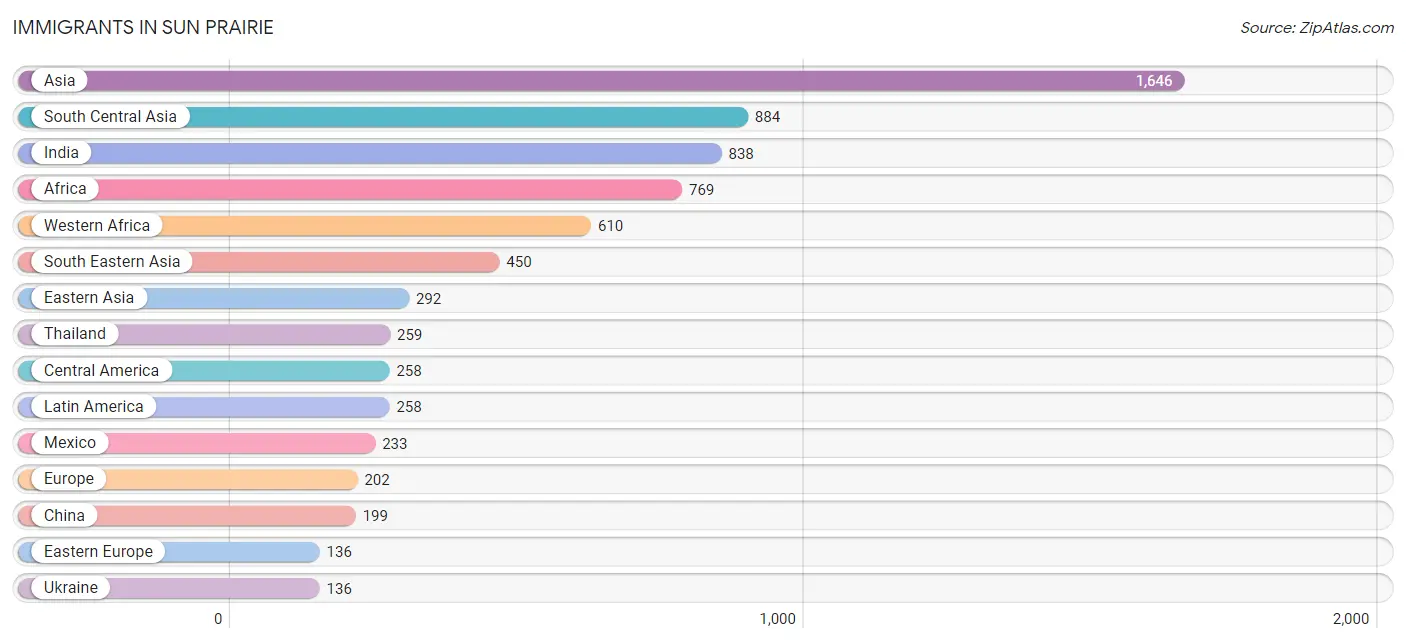
The most numerous immigrant groups reported in Sun Prairie came from Asia (1,646 | 4.6%), South Central Asia (884 | 2.5%), India (838 | 2.3%), Africa (769 | 2.1%), and Western Africa (610 | 1.7%), together accounting for 13.3% of all Sun Prairie residents.
| Immigration Origin | # Population | % Population |
| Africa | 769 | 2.1% |
| Asia | 1,646 | 4.6% |
| Canada | 9 | 0.0% |
| Central America | 258 | 0.7% |
| China | 199 | 0.6% |
| Eastern Africa | 118 | 0.3% |
| Eastern Asia | 292 | 0.8% |
| Eastern Europe | 136 | 0.4% |
| Egypt | 8 | 0.0% |
| England | 15 | 0.0% |
| Europe | 202 | 0.6% |
| France | 3 | 0.0% |
| Germany | 48 | 0.1% |
| Ghana | 36 | 0.1% |
| Hong Kong | 8 | 0.0% |
| India | 838 | 2.3% |
| Japan | 27 | 0.1% |
| Kenya | 80 | 0.2% |
| Korea | 55 | 0.2% |
| Laos | 125 | 0.4% |
| Latin America | 258 | 0.7% |
| Liberia | 48 | 0.1% |
| Mexico | 233 | 0.6% |
| Middle Africa | 15 | 0.0% |
| Nepal | 46 | 0.1% |
| Nicaragua | 25 | 0.1% |
| Nigeria | 10 | 0.0% |
| Northern Africa | 26 | 0.1% |
| Northern Europe | 15 | 0.0% |
| Philippines | 43 | 0.1% |
| Saudi Arabia | 20 | 0.1% |
| South Central Asia | 884 | 2.5% |
| South Eastern Asia | 450 | 1.3% |
| Thailand | 259 | 0.7% |
| Ukraine | 136 | 0.4% |
| Vietnam | 23 | 0.1% |
| Western Africa | 610 | 1.7% |
| Western Asia | 20 | 0.1% |
| Western Europe | 51 | 0.1% |
| Zaire | 15 | 0.0% | View All 40 Rows |
Sex and Age in Sun Prairie
Sex and Age in Sun Prairie
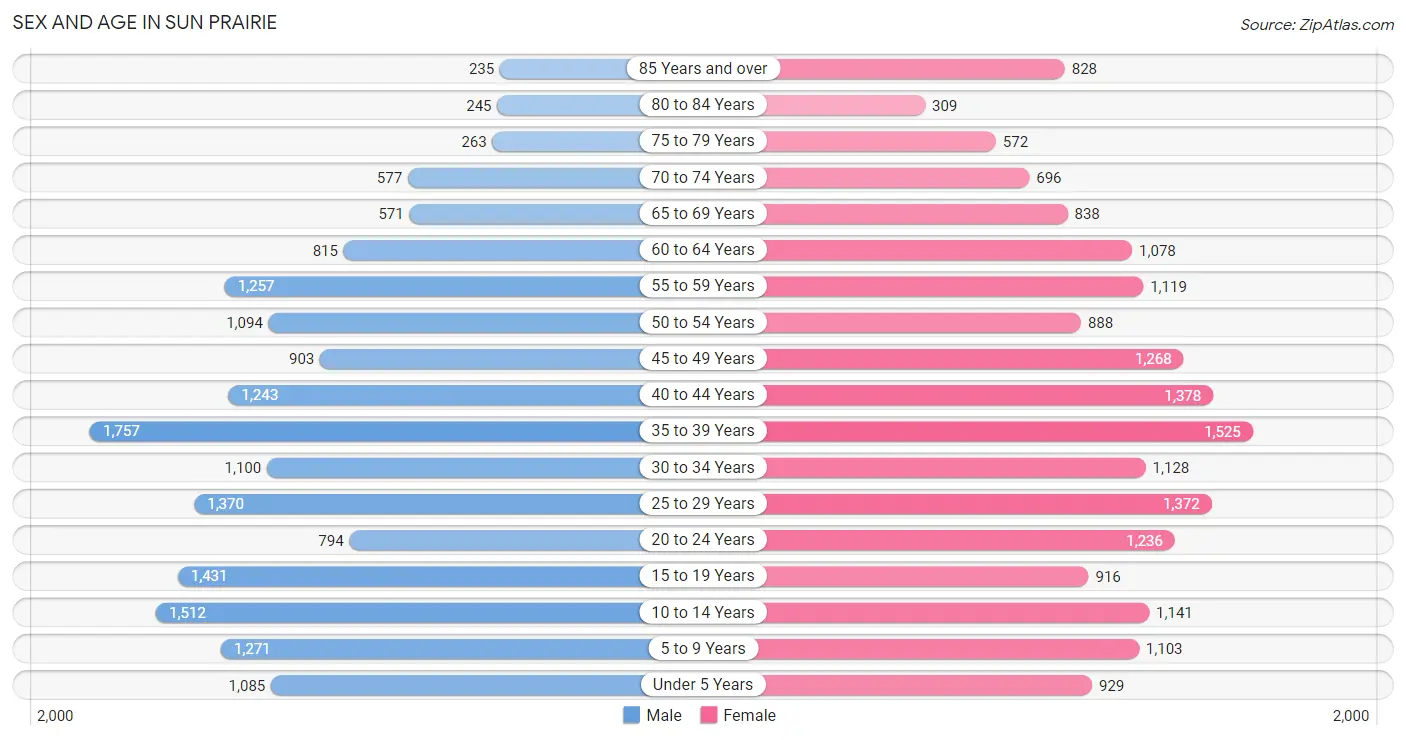
The most populous age groups in Sun Prairie are 35 to 39 Years (1,757 | 10.0%) for men and 35 to 39 Years (1,525 | 8.3%) for women.
| Age Bracket | Male | Female |
| Under 5 Years | 1,085 (6.2%) | 929 (5.1%) |
| 5 to 9 Years | 1,271 (7.2%) | 1,103 (6.0%) |
| 10 to 14 Years | 1,512 (8.6%) | 1,141 (6.2%) |
| 15 to 19 Years | 1,431 (8.2%) | 916 (5.0%) |
| 20 to 24 Years | 794 (4.5%) | 1,236 (6.8%) |
| 25 to 29 Years | 1,370 (7.8%) | 1,372 (7.5%) |
| 30 to 34 Years | 1,100 (6.3%) | 1,128 (6.2%) |
| 35 to 39 Years | 1,757 (10.0%) | 1,525 (8.3%) |
| 40 to 44 Years | 1,243 (7.1%) | 1,378 (7.5%) |
| 45 to 49 Years | 903 (5.1%) | 1,268 (6.9%) |
| 50 to 54 Years | 1,094 (6.2%) | 888 (4.9%) |
| 55 to 59 Years | 1,257 (7.2%) | 1,119 (6.1%) |
| 60 to 64 Years | 815 (4.6%) | 1,078 (5.9%) |
| 65 to 69 Years | 571 (3.3%) | 838 (4.6%) |
| 70 to 74 Years | 577 (3.3%) | 696 (3.8%) |
| 75 to 79 Years | 263 (1.5%) | 572 (3.1%) |
| 80 to 84 Years | 245 (1.4%) | 309 (1.7%) |
| 85 Years and over | 235 (1.3%) | 828 (4.5%) |
| Total | 17,523 (100.0%) | 18,324 (100.0%) |
Families and Households in Sun Prairie
Median Family Size in Sun Prairie
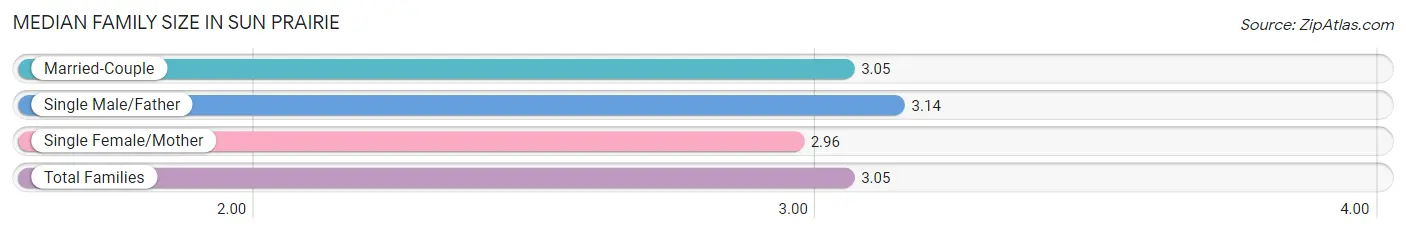
The median family size in Sun Prairie is 3.05 persons per family, with single male/father families (591 | 6.5%) accounting for the largest median family size of 3.14 persons per family. On the other hand, single female/mother families (1,223 | 13.4%) represent the smallest median family size with 2.96 persons per family.
| Family Type | # Families | Family Size |
| Married-Couple | 7,332 (80.2%) | 3.05 |
| Single Male/Father | 591 (6.5%) | 3.14 |
| Single Female/Mother | 1,223 (13.4%) | 2.96 |
| Total Families | 9,146 (100.0%) | 3.05 |
Median Household Size in Sun Prairie
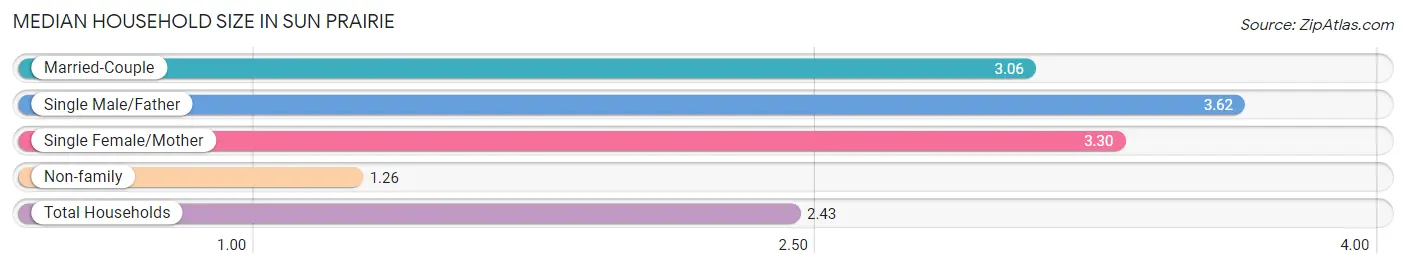
The median household size in Sun Prairie is 2.43 persons per household, with single male/father households (591 | 4.0%) accounting for the largest median household size of 3.62 persons per household. non-family households (5,551 | 37.8%) represent the smallest median household size with 1.26 persons per household.
| Household Type | # Households | Household Size |
| Married-Couple | 7,332 (49.9%) | 3.06 |
| Single Male/Father | 591 (4.0%) | 3.62 |
| Single Female/Mother | 1,223 (8.3%) | 3.30 |
| Non-family | 5,551 (37.8%) | 1.26 |
| Total Households | 14,697 (100.0%) | 2.43 |
Household Size by Marriage Status in Sun Prairie
Out of a total of 14,697 households in Sun Prairie, 9,146 (62.2%) are family households, while 5,551 (37.8%) are nonfamily households. The most numerous type of family households are 2-person households, comprising 3,821, and the most common type of nonfamily households are 1-person households, comprising 4,595.
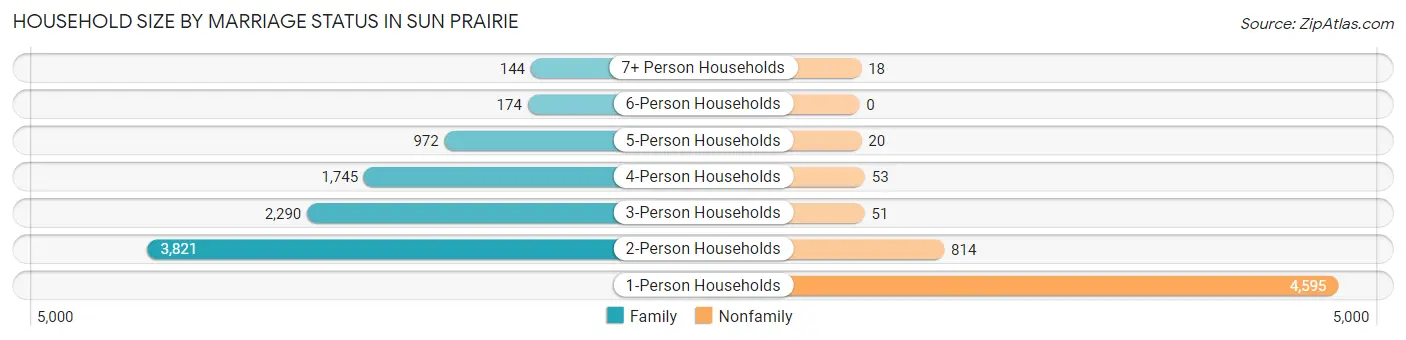
| Household Size | Family Households | Nonfamily Households |
| 1-Person Households | - | 4,595 (31.3%) |
| 2-Person Households | 3,821 (26.0%) | 814 (5.5%) |
| 3-Person Households | 2,290 (15.6%) | 51 (0.4%) |
| 4-Person Households | 1,745 (11.9%) | 53 (0.4%) |
| 5-Person Households | 972 (6.6%) | 20 (0.1%) |
| 6-Person Households | 174 (1.2%) | 0 (0.0%) |
| 7+ Person Households | 144 (1.0%) | 18 (0.1%) |
| Total | 9,146 (62.2%) | 5,551 (37.8%) |
Female Fertility in Sun Prairie
Fertility by Age in Sun Prairie
Average fertility rate in Sun Prairie is 39.0 births per 1,000 women. Women in the age bracket of 20 to 34 years have the highest fertility rate with 59.0 births per 1,000 women. Women in the age bracket of 20 to 34 years acount for 62.2% of all women with births.
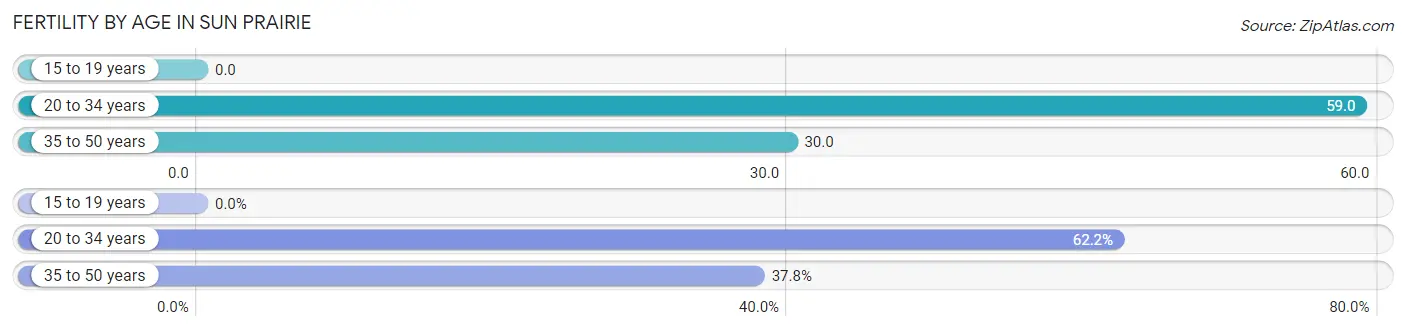
| Age Bracket | Women with Births | Births / 1,000 Women |
| 15 to 19 years | 0 (0.0%) | 0.0 |
| 20 to 34 years | 219 (62.2%) | 59.0 |
| 35 to 50 years | 133 (37.8%) | 30.0 |
| Total | 352 (100.0%) | 39.0 |
Fertility by Age by Marriage Status in Sun Prairie
84.9% of women with births (352) in Sun Prairie are married. The highest percentage of unmarried women with births falls into 20 to 34 years age bracket with 24.2% of them unmarried at the time of birth, while the lowest percentage of unmarried women with births belong to 35 to 50 years age bracket with 0.0% of them unmarried.
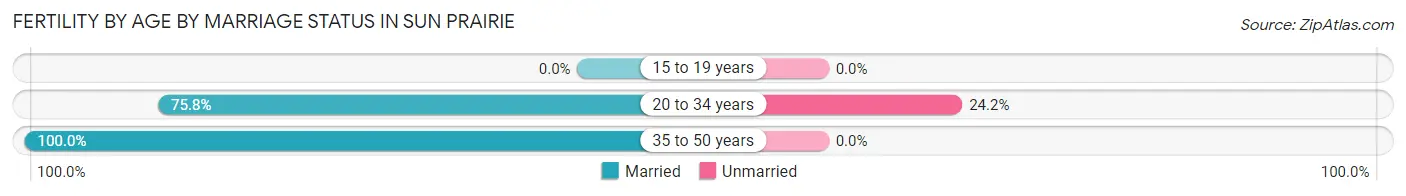
| Age Bracket | Married | Unmarried |
| 15 to 19 years | 0 (0.0%) | 0 (0.0%) |
| 20 to 34 years | 166 (75.8%) | 53 (24.2%) |
| 35 to 50 years | 133 (100.0%) | 0 (0.0%) |
| Total | 299 (84.9%) | 53 (15.1%) |
Fertility by Education in Sun Prairie
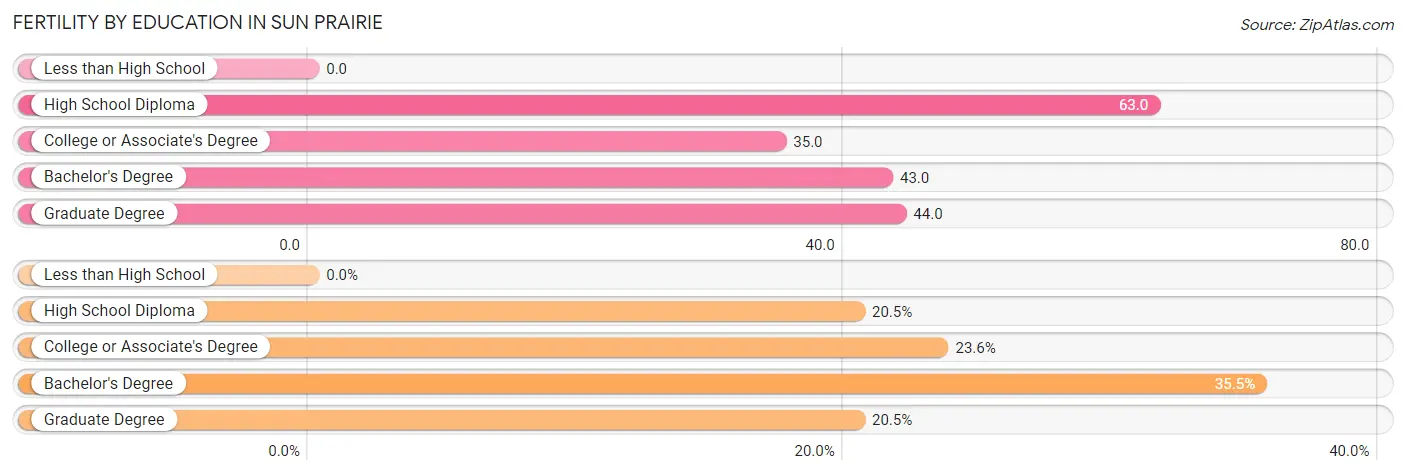
| Educational Attainment | Women with Births | Births / 1,000 Women |
| Less than High School | 0 (0.0%) | 0.0 |
| High School Diploma | 72 (20.4%) | 63.0 |
| College or Associate's Degree | 83 (23.6%) | 35.0 |
| Bachelor's Degree | 125 (35.5%) | 43.0 |
| Graduate Degree | 72 (20.4%) | 44.0 |
| Total | 352 (100.0%) | 39.0 |
Fertility by Education by Marriage Status in Sun Prairie
15.1% of women with births in Sun Prairie are unmarried. Women with the educational attainment of high school diploma are most likely to be married with 100.0% of them married at childbirth, while women with the educational attainment of college or associate's degree are least likely to be married with 63.9% of them unmarried at childbirth.
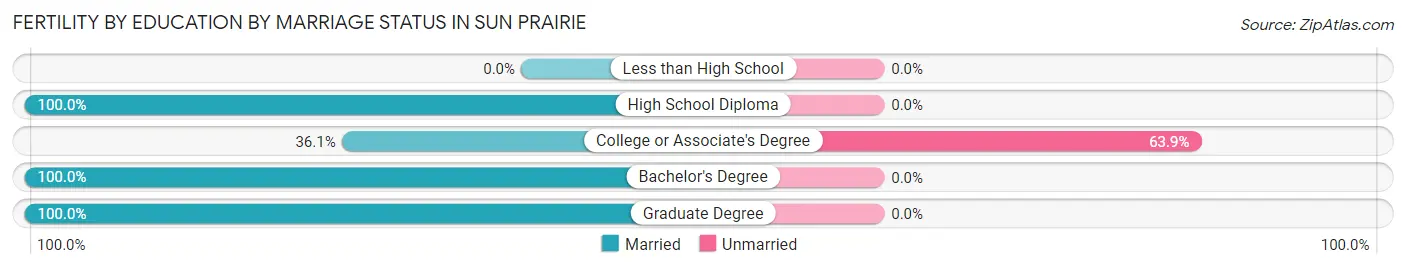
| Educational Attainment | Married | Unmarried |
| Less than High School | 0 (0.0%) | 0 (0.0%) |
| High School Diploma | 72 (100.0%) | 0 (0.0%) |
| College or Associate's Degree | 30 (36.1%) | 53 (63.9%) |
| Bachelor's Degree | 125 (100.0%) | 0 (0.0%) |
| Graduate Degree | 72 (100.0%) | 0 (0.0%) |
| Total | 299 (84.9%) | 53 (15.1%) |
Employment Characteristics in Sun Prairie
Employment by Class of Employer in Sun Prairie
Among the 19,904 employed individuals in Sun Prairie, private company employees (13,785 | 69.3%), state government employees (1,532 | 7.7%), and local government employees (1,469 | 7.4%) make up the most common classes of employment.
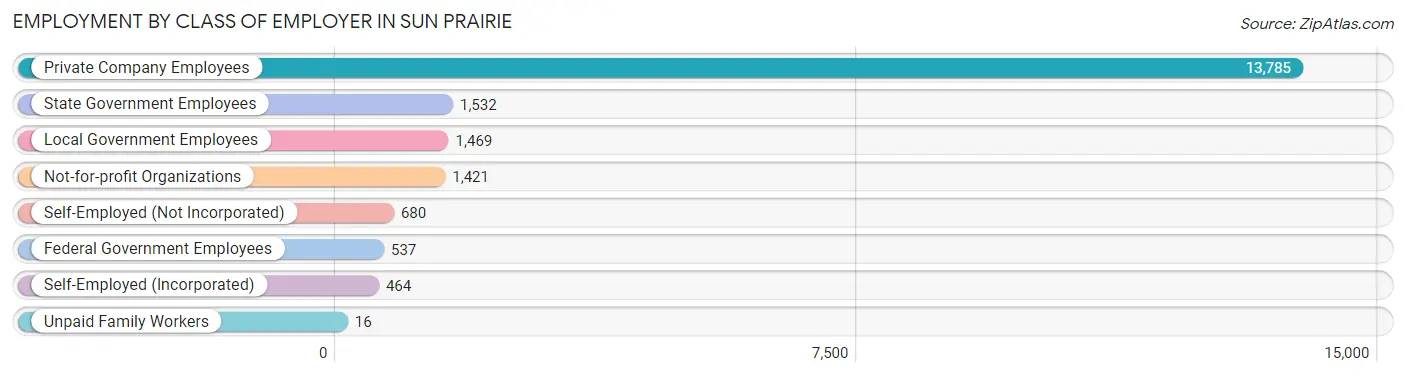
| Employer Class | # Employees | % Employees |
| Private Company Employees | 13,785 | 69.3% |
| Self-Employed (Incorporated) | 464 | 2.3% |
| Self-Employed (Not Incorporated) | 680 | 3.4% |
| Not-for-profit Organizations | 1,421 | 7.1% |
| Local Government Employees | 1,469 | 7.4% |
| State Government Employees | 1,532 | 7.7% |
| Federal Government Employees | 537 | 2.7% |
| Unpaid Family Workers | 16 | 0.1% |
| Total | 19,904 | 100.0% |
Employment Status by Age in Sun Prairie
According to the labor force statistics for Sun Prairie, out of the total population over 16 years of age (28,229), 72.4% or 20,438 individuals are in the labor force, with 1.6% or 327 of them unemployed. The age group with the highest labor force participation rate is 45 to 54 years, with 94.9% or 3,941 individuals in the labor force. Within the labor force, the 65 to 74 years age range has the highest percentage of unemployed individuals, with 4.1% or 18 of them being unemployed.
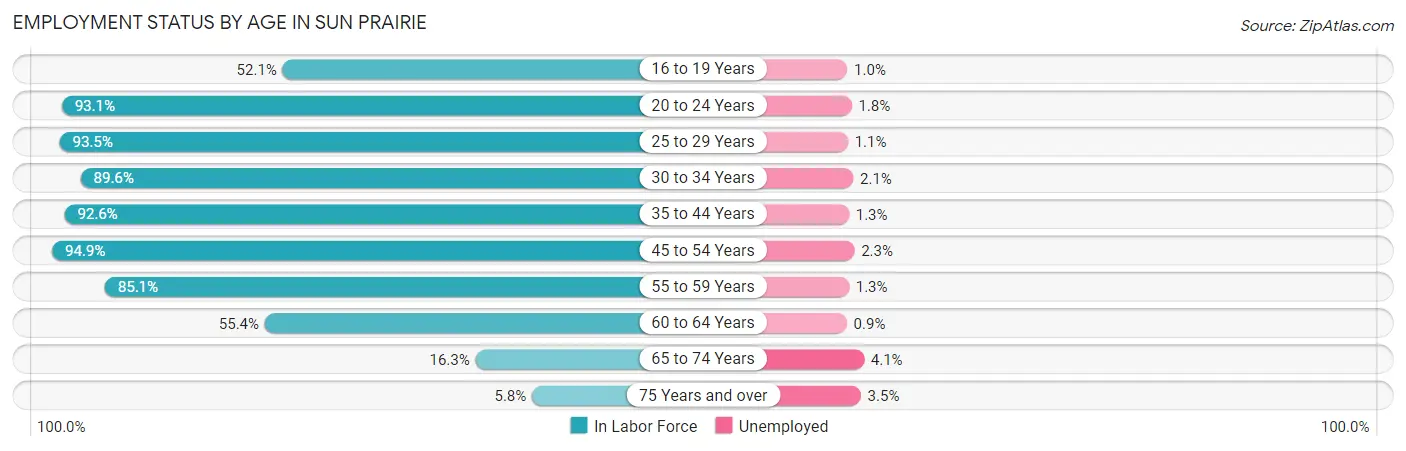
| Age Bracket | In Labor Force | Unemployed |
| 16 to 19 Years | 922 (52.1%) | 9 (1.0%) |
| 20 to 24 Years | 1,890 (93.1%) | 34 (1.8%) |
| 25 to 29 Years | 2,564 (93.5%) | 28 (1.1%) |
| 30 to 34 Years | 1,996 (89.6%) | 42 (2.1%) |
| 35 to 44 Years | 5,466 (92.6%) | 71 (1.3%) |
| 45 to 54 Years | 3,941 (94.9%) | 91 (2.3%) |
| 55 to 59 Years | 2,022 (85.1%) | 26 (1.3%) |
| 60 to 64 Years | 1,049 (55.4%) | 9 (0.9%) |
| 65 to 74 Years | 437 (16.3%) | 18 (4.1%) |
| 75 Years and over | 142 (5.8%) | 5 (3.5%) |
| Total | 20,438 (72.4%) | 327 (1.6%) |
Employment Status by Educational Attainment in Sun Prairie
According to labor force statistics for Sun Prairie, 88.3% of individuals (17,037) out of the total population between 25 and 64 years of age (19,295) are in the labor force, with 1.6% or 273 of them being unemployed. The group with the highest labor force participation rate are those with the educational attainment of college / associate degree, with 92.0% or 4,285 individuals in the labor force. Within the labor force, individuals with less than high school education have the highest percentage of unemployment, with 13.2% or 54 of them being unemployed.
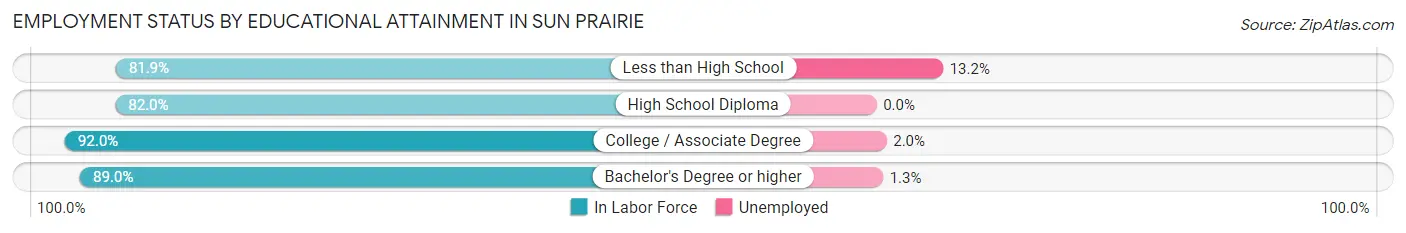
| Educational Attainment | In Labor Force | Unemployed |
| Less than High School | 408 (81.9%) | 66 (13.2%) |
| High School Diploma | 2,863 (82.0%) | 0 (0.0%) |
| College / Associate Degree | 4,285 (92.0%) | 93 (2.0%) |
| Bachelor's Degree or higher | 9,476 (89.0%) | 138 (1.3%) |
| Total | 17,037 (88.3%) | 309 (1.6%) |
Employment Occupations by Sex in Sun Prairie
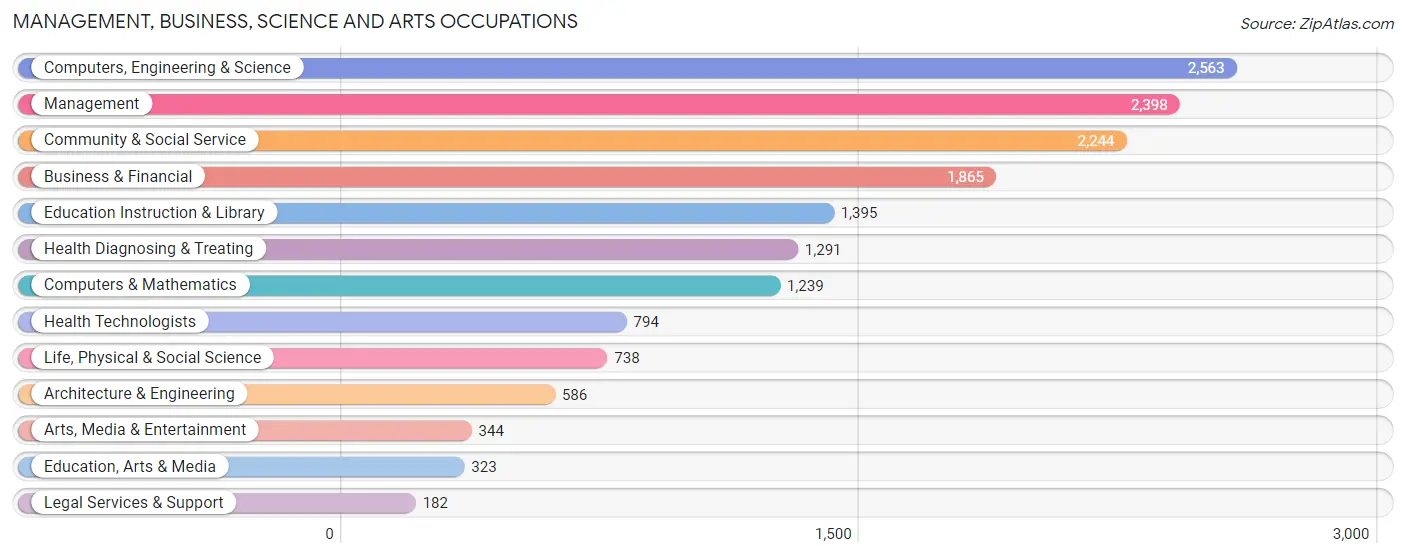
Management, Business, Science and Arts Occupations
The most common Management, Business, Science and Arts occupations in Sun Prairie are Computers, Engineering & Science (2,563 | 12.8%), Management (2,398 | 12.0%), Community & Social Service (2,244 | 11.2%), Business & Financial (1,865 | 9.3%), and Education Instruction & Library (1,395 | 7.0%).
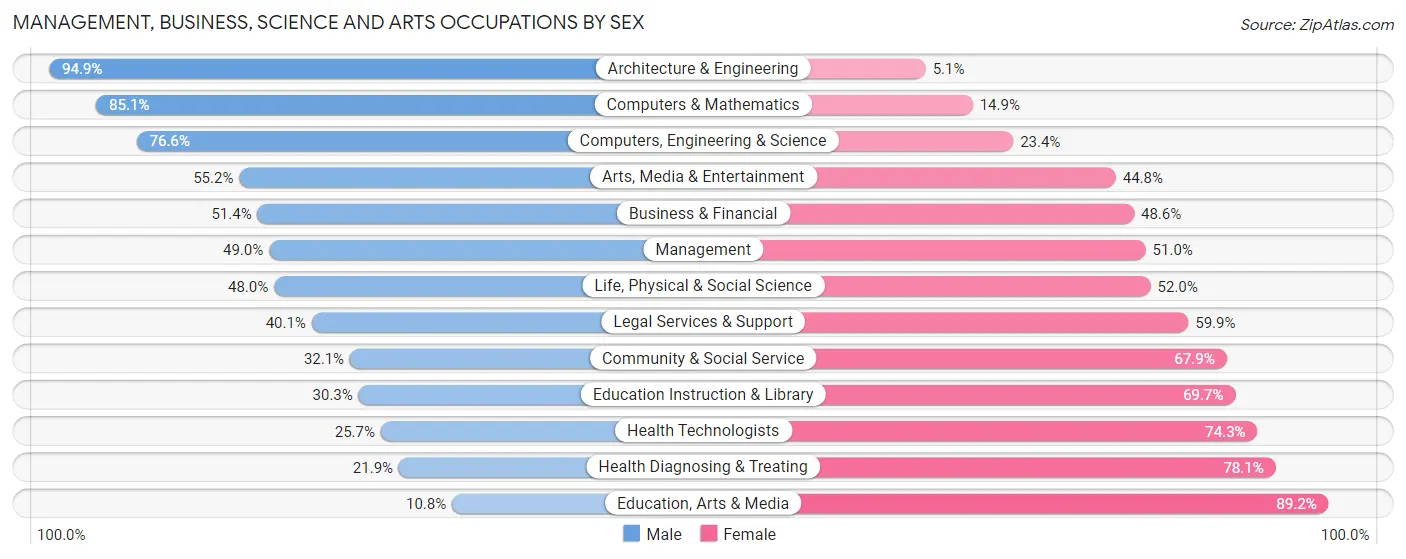
Management, Business, Science and Arts Occupations by Sex
Within the Management, Business, Science and Arts occupations in Sun Prairie, the most male-oriented occupations are Architecture & Engineering (94.9%), Computers & Mathematics (85.1%), and Computers, Engineering & Science (76.6%), while the most female-oriented occupations are Education, Arts & Media (89.2%), Health Diagnosing & Treating (78.1%), and Health Technologists (74.3%).
| Occupation | Male | Female |
| Management | 1,175 (49.0%) | 1,223 (51.0%) |
| Business & Financial | 959 (51.4%) | 906 (48.6%) |
| Computers, Engineering & Science | 1,964 (76.6%) | 599 (23.4%) |
| Computers & Mathematics | 1,054 (85.1%) | 185 (14.9%) |
| Architecture & Engineering | 556 (94.9%) | 30 (5.1%) |
| Life, Physical & Social Science | 354 (48.0%) | 384 (52.0%) |
| Community & Social Service | 721 (32.1%) | 1,523 (67.9%) |
| Education, Arts & Media | 35 (10.8%) | 288 (89.2%) |
| Legal Services & Support | 73 (40.1%) | 109 (59.9%) |
| Education Instruction & Library | 423 (30.3%) | 972 (69.7%) |
| Arts, Media & Entertainment | 190 (55.2%) | 154 (44.8%) |
| Health Diagnosing & Treating | 283 (21.9%) | 1,008 (78.1%) |
| Health Technologists | 204 (25.7%) | 590 (74.3%) |
| Total (Category) | 5,102 (49.2%) | 5,259 (50.8%) |
| Total (Overall) | 10,375 (51.8%) | 9,648 (48.2%) |
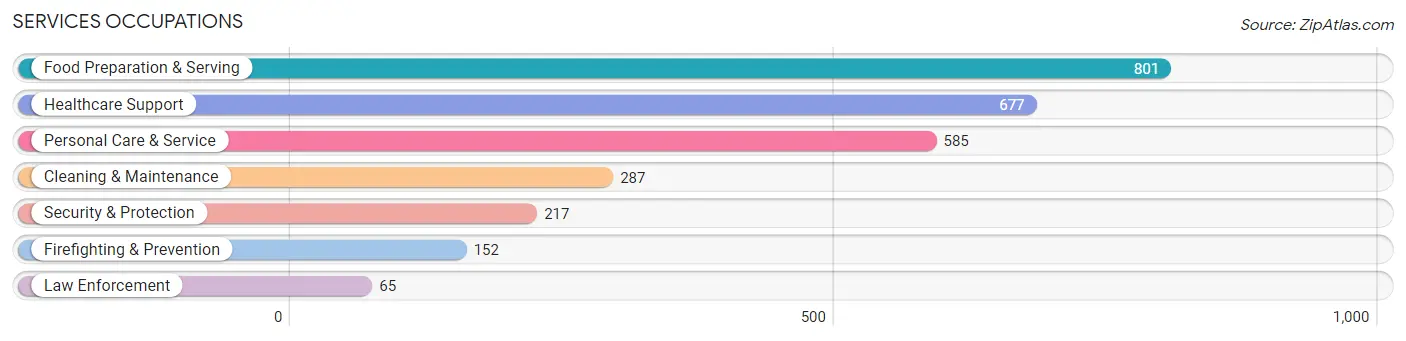
Services Occupations
The most common Services occupations in Sun Prairie are Food Preparation & Serving (801 | 4.0%), Healthcare Support (677 | 3.4%), Personal Care & Service (585 | 2.9%), Cleaning & Maintenance (287 | 1.4%), and Security & Protection (217 | 1.1%).
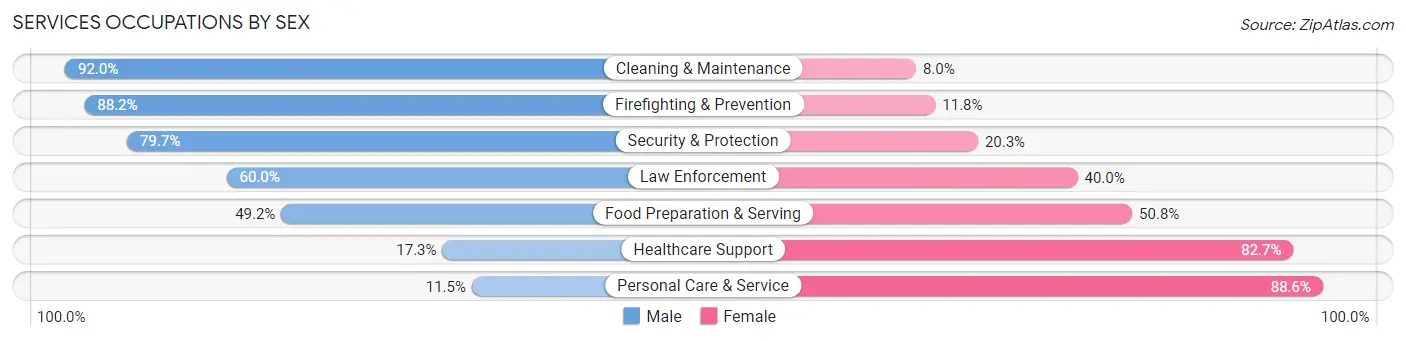
Services Occupations by Sex
Within the Services occupations in Sun Prairie, the most male-oriented occupations are Cleaning & Maintenance (92.0%), Firefighting & Prevention (88.2%), and Security & Protection (79.7%), while the most female-oriented occupations are Personal Care & Service (88.5%), Healthcare Support (82.7%), and Food Preparation & Serving (50.8%).
| Occupation | Male | Female |
| Healthcare Support | 117 (17.3%) | 560 (82.7%) |
| Security & Protection | 173 (79.7%) | 44 (20.3%) |
| Firefighting & Prevention | 134 (88.2%) | 18 (11.8%) |
| Law Enforcement | 39 (60.0%) | 26 (40.0%) |
| Food Preparation & Serving | 394 (49.2%) | 407 (50.8%) |
| Cleaning & Maintenance | 264 (92.0%) | 23 (8.0%) |
| Personal Care & Service | 67 (11.5%) | 518 (88.5%) |
| Total (Category) | 1,015 (39.5%) | 1,552 (60.5%) |
| Total (Overall) | 10,375 (51.8%) | 9,648 (48.2%) |
Sales and Office Occupations
The most common Sales and Office occupations in Sun Prairie are Sales & Related (2,066 | 10.3%), and Office & Administration (1,625 | 8.1%).

Sales and Office Occupations by Sex

| Occupation | Male | Female |
| Sales & Related | 1,140 (55.2%) | 926 (44.8%) |
| Office & Administration | 324 (19.9%) | 1,301 (80.1%) |
| Total (Category) | 1,464 (39.7%) | 2,227 (60.3%) |
| Total (Overall) | 10,375 (51.8%) | 9,648 (48.2%) |
Natural Resources, Construction and Maintenance Occupations
The most common Natural Resources, Construction and Maintenance occupations in Sun Prairie are Construction & Extraction (502 | 2.5%), Installation, Maintenance & Repair (462 | 2.3%), and Farming, Fishing & Forestry (62 | 0.3%).
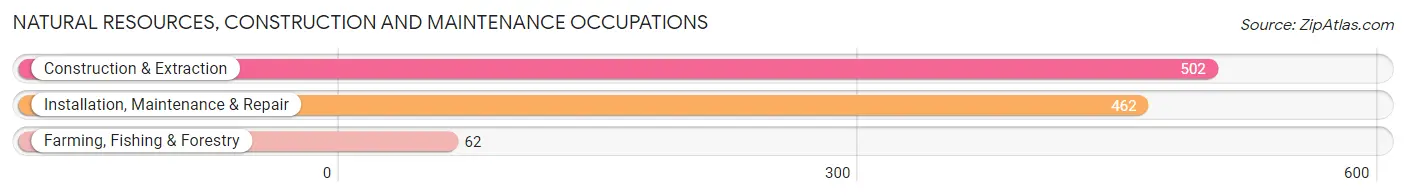
Natural Resources, Construction and Maintenance Occupations by Sex
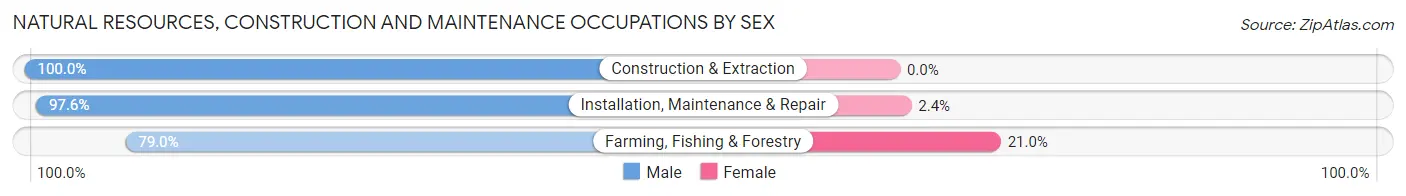
| Occupation | Male | Female |
| Farming, Fishing & Forestry | 49 (79.0%) | 13 (21.0%) |
| Construction & Extraction | 502 (100.0%) | 0 (0.0%) |
| Installation, Maintenance & Repair | 451 (97.6%) | 11 (2.4%) |
| Total (Category) | 1,002 (97.7%) | 24 (2.3%) |
| Total (Overall) | 10,375 (51.8%) | 9,648 (48.2%) |
Production, Transportation and Moving Occupations
The most common Production, Transportation and Moving occupations in Sun Prairie are Production (985 | 4.9%), Material Moving (806 | 4.0%), and Transportation (587 | 2.9%).
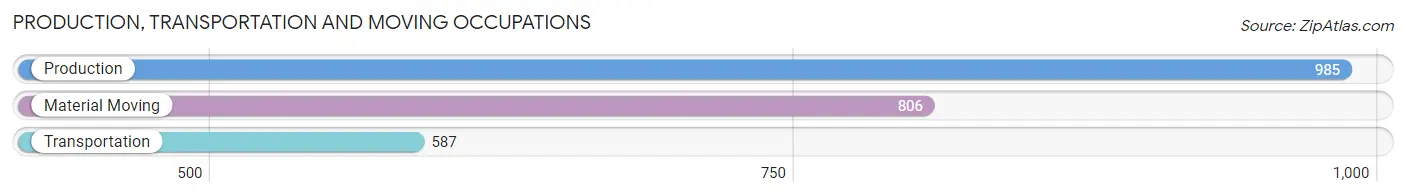
Production, Transportation and Moving Occupations by Sex
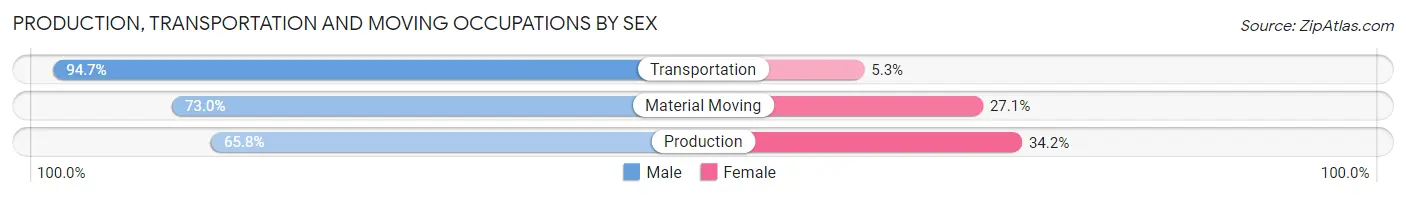
| Occupation | Male | Female |
| Production | 648 (65.8%) | 337 (34.2%) |
| Transportation | 556 (94.7%) | 31 (5.3%) |
| Material Moving | 588 (73.0%) | 218 (27.1%) |
| Total (Category) | 1,792 (75.4%) | 586 (24.6%) |
| Total (Overall) | 10,375 (51.8%) | 9,648 (48.2%) |
Employment Industries by Sex in Sun Prairie
Employment Industries in Sun Prairie
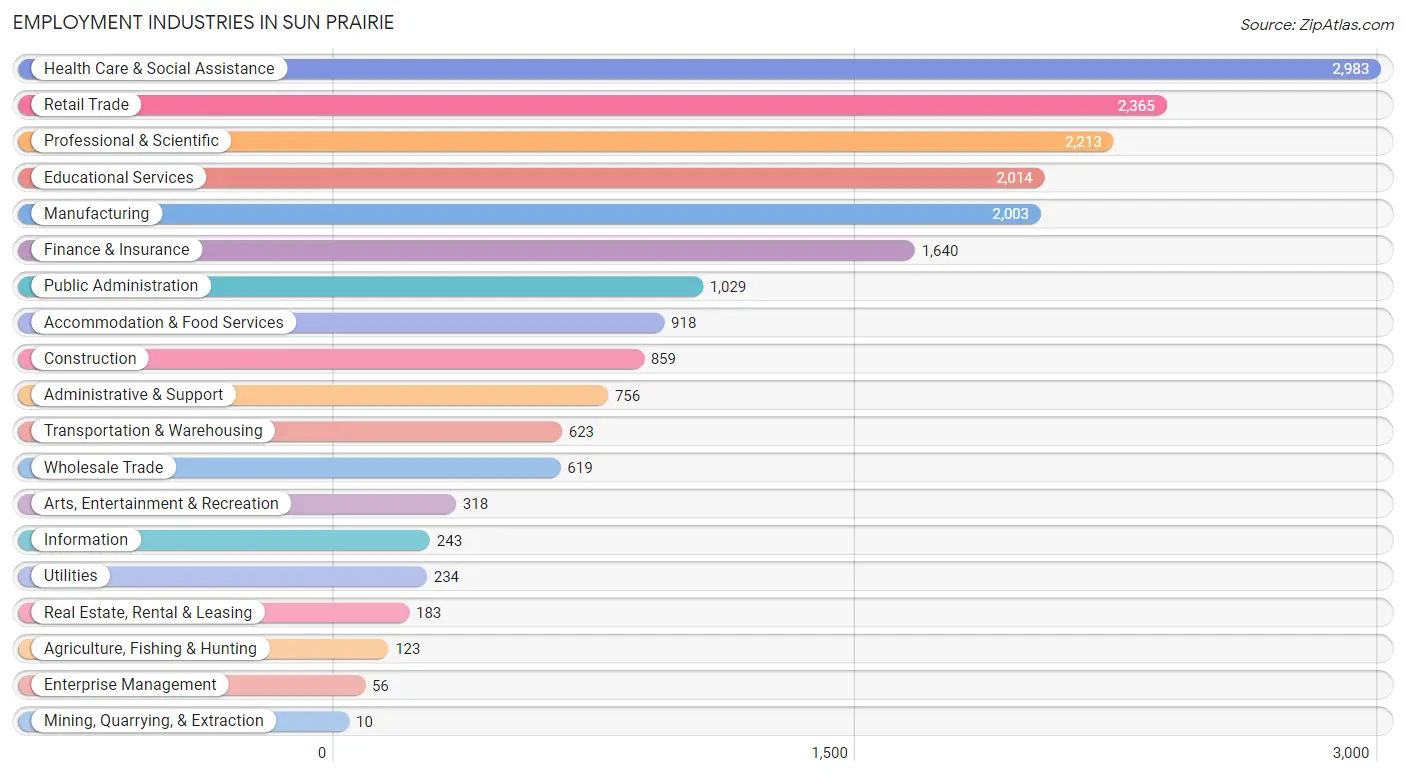
The major employment industries in Sun Prairie include Health Care & Social Assistance (2,983 | 14.9%), Retail Trade (2,365 | 11.8%), Professional & Scientific (2,213 | 11.1%), Educational Services (2,014 | 10.1%), and Manufacturing (2,003 | 10.0%).
Employment Industries by Sex in Sun Prairie
The Sun Prairie industries that see more men than women are Mining, Quarrying, & Extraction (100.0%), Enterprise Management (100.0%), and Construction (93.2%), whereas the industries that tend to have a higher number of women are Arts, Entertainment & Recreation (78.6%), Health Care & Social Assistance (74.1%), and Educational Services (69.7%).
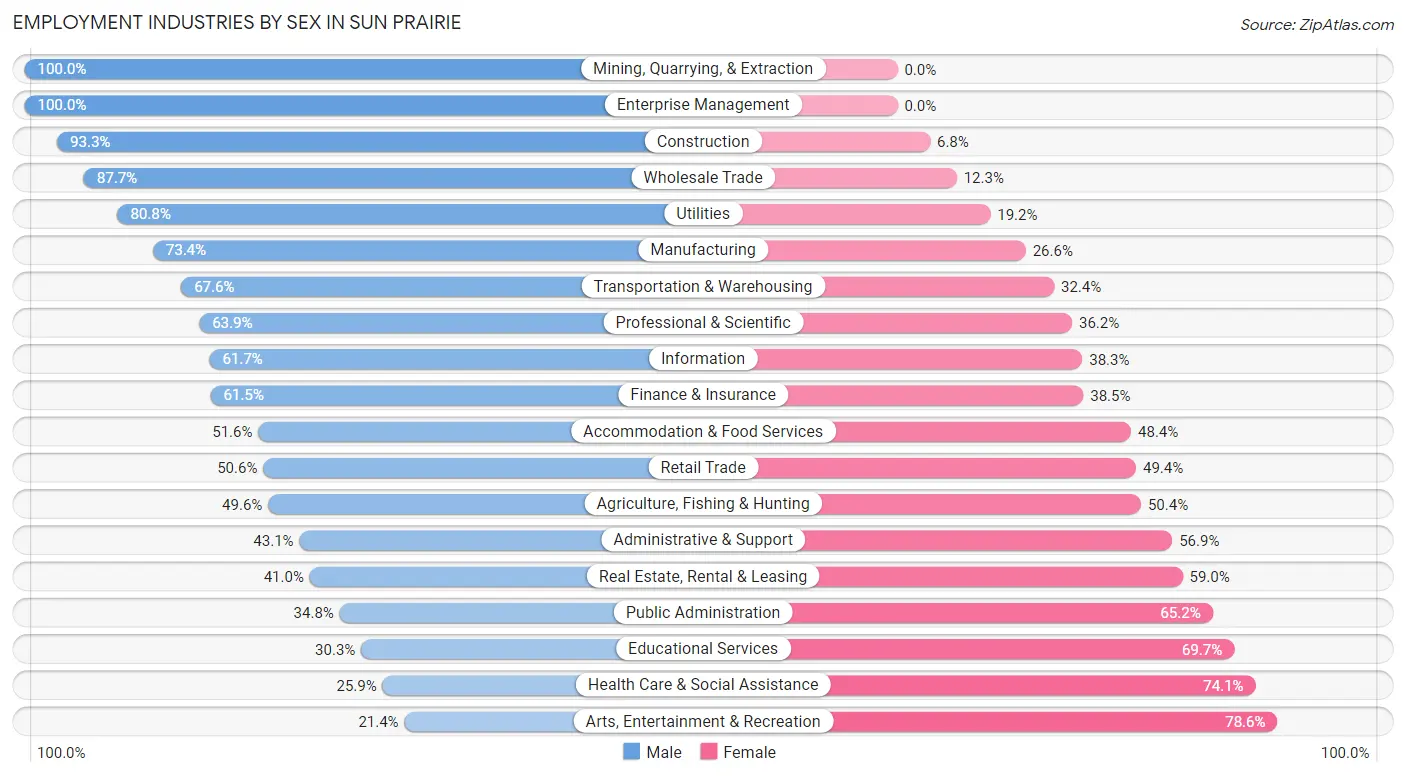
| Industry | Male | Female |
| Agriculture, Fishing & Hunting | 61 (49.6%) | 62 (50.4%) |
| Mining, Quarrying, & Extraction | 10 (100.0%) | 0 (0.0%) |
| Construction | 801 (93.2%) | 58 (6.8%) |
| Manufacturing | 1,471 (73.4%) | 532 (26.6%) |
| Wholesale Trade | 543 (87.7%) | 76 (12.3%) |
| Retail Trade | 1,197 (50.6%) | 1,168 (49.4%) |
| Transportation & Warehousing | 421 (67.6%) | 202 (32.4%) |
| Utilities | 189 (80.8%) | 45 (19.2%) |
| Information | 150 (61.7%) | 93 (38.3%) |
| Finance & Insurance | 1,009 (61.5%) | 631 (38.5%) |
| Real Estate, Rental & Leasing | 75 (41.0%) | 108 (59.0%) |
| Professional & Scientific | 1,413 (63.8%) | 800 (36.1%) |
| Enterprise Management | 56 (100.0%) | 0 (0.0%) |
| Administrative & Support | 326 (43.1%) | 430 (56.9%) |
| Educational Services | 611 (30.3%) | 1,403 (69.7%) |
| Health Care & Social Assistance | 773 (25.9%) | 2,210 (74.1%) |
| Arts, Entertainment & Recreation | 68 (21.4%) | 250 (78.6%) |
| Accommodation & Food Services | 474 (51.6%) | 444 (48.4%) |
| Public Administration | 358 (34.8%) | 671 (65.2%) |
| Total | 10,375 (51.8%) | 9,648 (48.2%) |
Education in Sun Prairie
School Enrollment in Sun Prairie
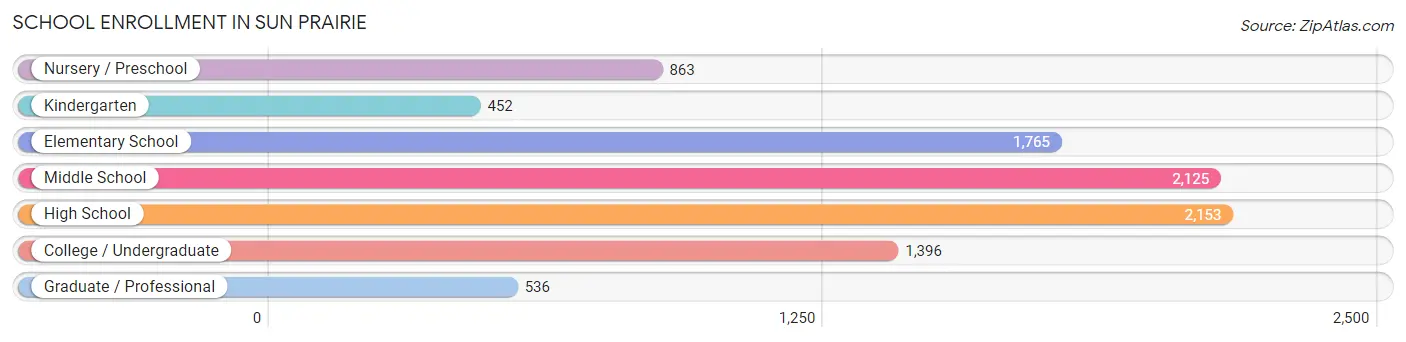
The most common levels of schooling among the 9,290 students in Sun Prairie are high school (2,153 | 23.2%), middle school (2,125 | 22.9%), and elementary school (1,765 | 19.0%).
| School Level | # Students | % Students |
| Nursery / Preschool | 863 | 9.3% |
| Kindergarten | 452 | 4.9% |
| Elementary School | 1,765 | 19.0% |
| Middle School | 2,125 | 22.9% |
| High School | 2,153 | 23.2% |
| College / Undergraduate | 1,396 | 15.0% |
| Graduate / Professional | 536 | 5.8% |
| Total | 9,290 | 100.0% |
School Enrollment by Age by Funding Source in Sun Prairie
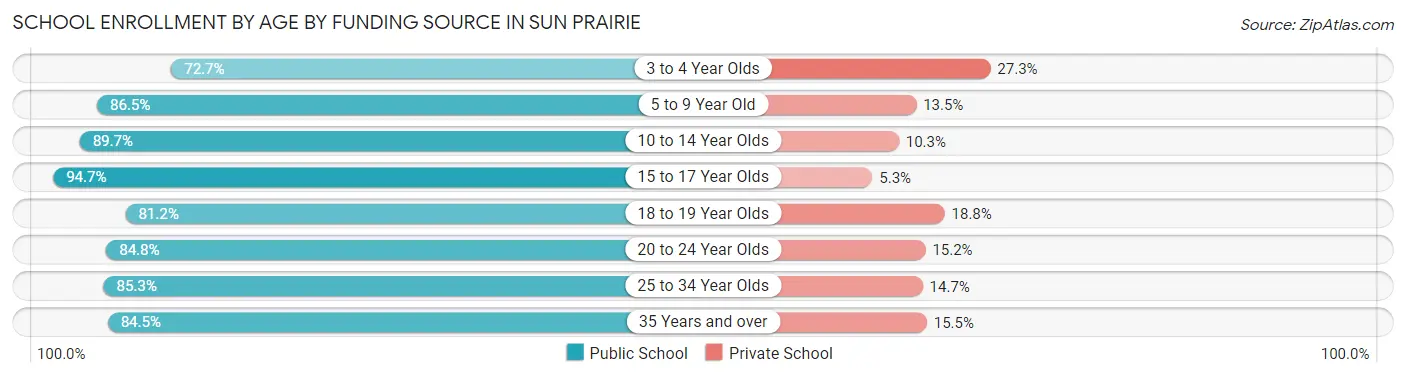
Out of a total of 9,290 students who are enrolled in schools in Sun Prairie, 1,161 (12.5%) attend a private institution, while the remaining 8,129 (87.5%) are enrolled in public schools. The age group of 3 to 4 year olds has the highest likelihood of being enrolled in private schools, with 135 (27.3% in the age bracket) enrolled. Conversely, the age group of 15 to 17 year olds has the lowest likelihood of being enrolled in a private school, with 1,543 (94.7% in the age bracket) attending a public institution.
| Age Bracket | Public School | Private School |
| 3 to 4 Year Olds | 359 (72.7%) | 135 (27.3%) |
| 5 to 9 Year Old | 2,036 (86.5%) | 318 (13.5%) |
| 10 to 14 Year Olds | 2,350 (89.7%) | 269 (10.3%) |
| 15 to 17 Year Olds | 1,543 (94.7%) | 87 (5.3%) |
| 18 to 19 Year Olds | 337 (81.2%) | 78 (18.8%) |
| 20 to 24 Year Olds | 874 (84.8%) | 157 (15.2%) |
| 25 to 34 Year Olds | 290 (85.3%) | 50 (14.7%) |
| 35 Years and over | 344 (84.5%) | 63 (15.5%) |
| Total | 8,129 (87.5%) | 1,161 (12.5%) |
Educational Attainment by Field of Study in Sun Prairie
Business (2,872 | 21.2%), education (1,723 | 12.7%), science & technology (1,559 | 11.5%), social sciences (1,026 | 7.6%), and computers & mathematics (884 | 6.5%) are the most common fields of study among 13,562 individuals in Sun Prairie who have obtained a bachelor's degree or higher.
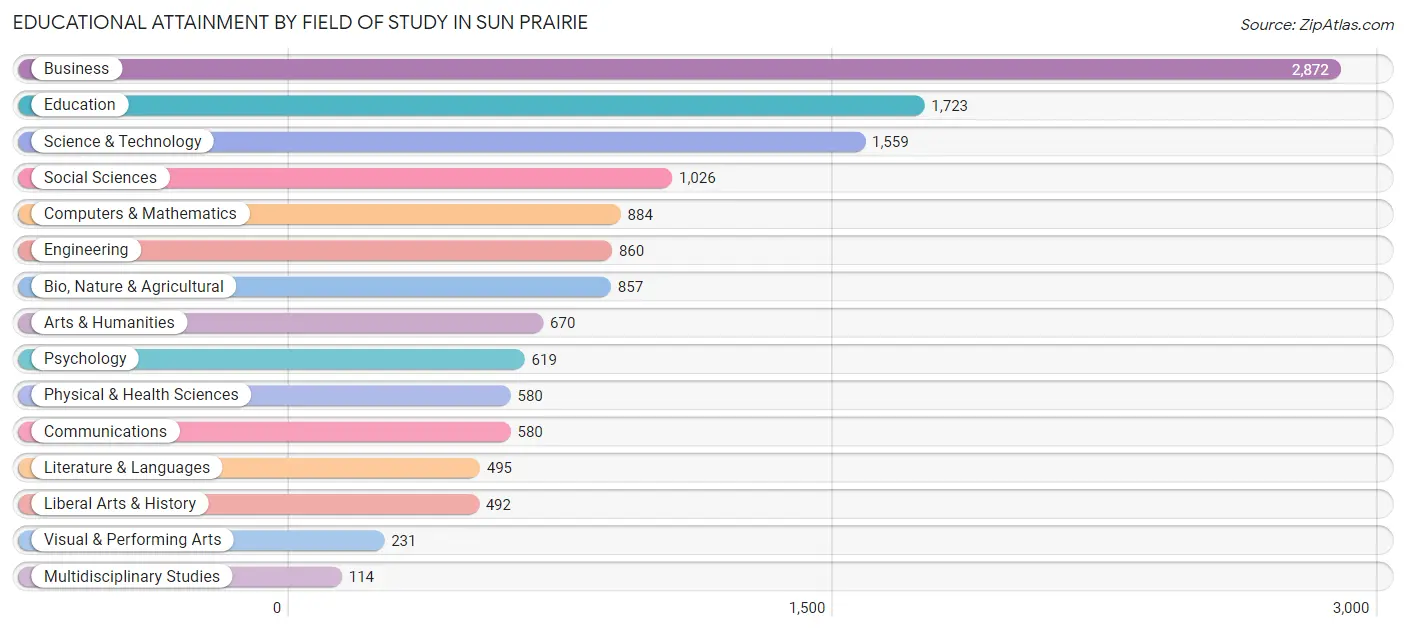
| Field of Study | # Graduates | % Graduates |
| Computers & Mathematics | 884 | 6.5% |
| Bio, Nature & Agricultural | 857 | 6.3% |
| Physical & Health Sciences | 580 | 4.3% |
| Psychology | 619 | 4.6% |
| Social Sciences | 1,026 | 7.6% |
| Engineering | 860 | 6.3% |
| Multidisciplinary Studies | 114 | 0.8% |
| Science & Technology | 1,559 | 11.5% |
| Business | 2,872 | 21.2% |
| Education | 1,723 | 12.7% |
| Literature & Languages | 495 | 3.6% |
| Liberal Arts & History | 492 | 3.6% |
| Visual & Performing Arts | 231 | 1.7% |
| Communications | 580 | 4.3% |
| Arts & Humanities | 670 | 4.9% |
| Total | 13,562 | 100.0% |
Transportation & Commute in Sun Prairie
Vehicle Availability by Sex in Sun Prairie
The most prevalent vehicle ownership categories in Sun Prairie are males with 2 vehicles (5,540, accounting for 53.4%) and females with 2 vehicles (4,836, making up 58.2%).
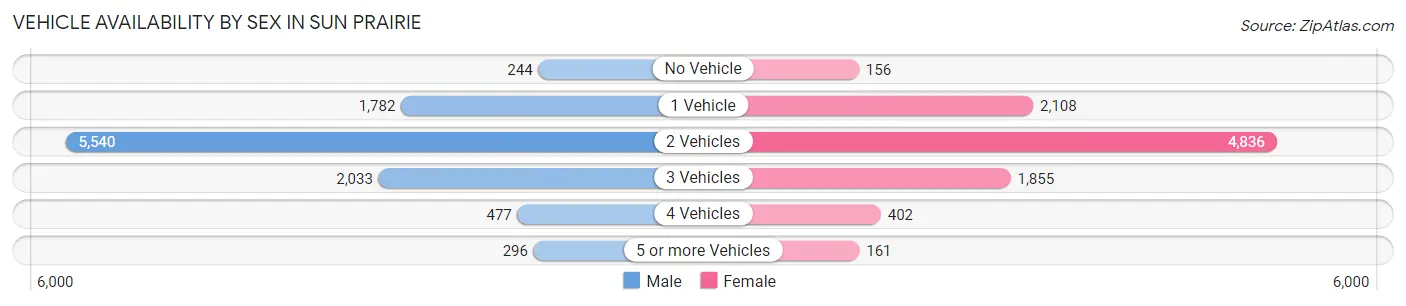
| Vehicles Available | Male | Female |
| No Vehicle | 244 (2.4%) | 156 (1.6%) |
| 1 Vehicle | 1,782 (17.2%) | 2,108 (22.2%) |
| 2 Vehicles | 5,540 (53.4%) | 4,836 (50.8%) |
| 3 Vehicles | 2,033 (19.6%) | 1,855 (19.5%) |
| 4 Vehicles | 477 (4.6%) | 402 (4.2%) |
| 5 or more Vehicles | 296 (2.9%) | 161 (1.7%) |
| Total | 10,372 (100.0%) | 9,518 (100.0%) |
Commute Time in Sun Prairie
The most frequently occuring commute durations in Sun Prairie are 15 to 19 minutes (2,754 commuters, 16.6%), 10 to 14 minutes (2,510 commuters, 15.2%), and 5 to 9 minutes (2,444 commuters, 14.8%).
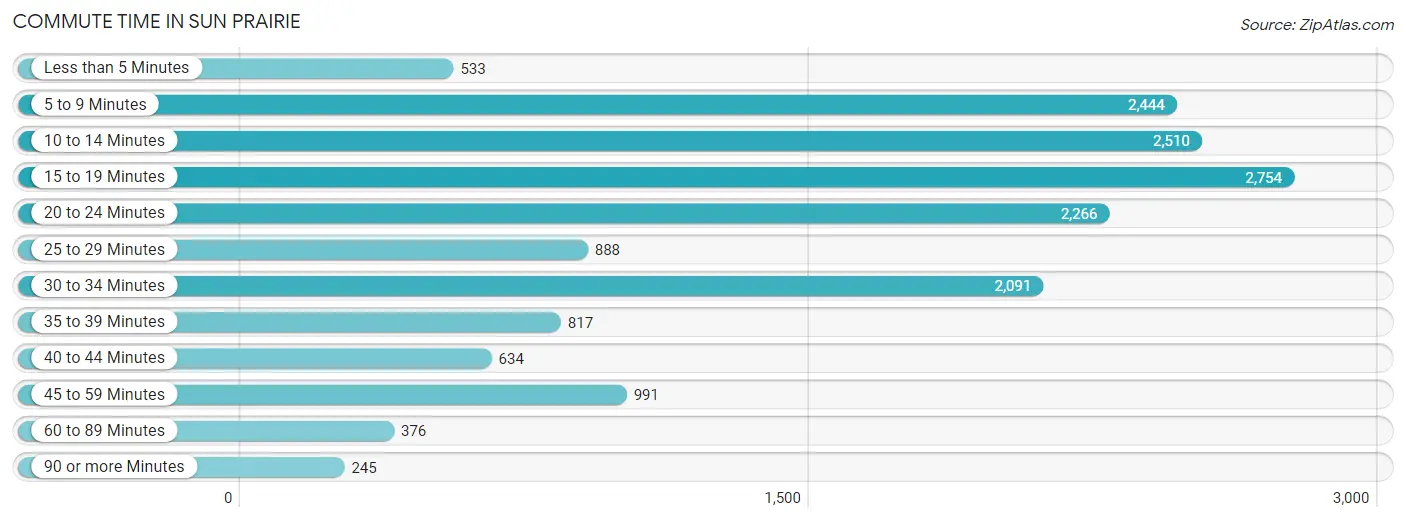
| Commute Time | # Commuters | % Commuters |
| Less than 5 Minutes | 533 | 3.2% |
| 5 to 9 Minutes | 2,444 | 14.8% |
| 10 to 14 Minutes | 2,510 | 15.2% |
| 15 to 19 Minutes | 2,754 | 16.6% |
| 20 to 24 Minutes | 2,266 | 13.7% |
| 25 to 29 Minutes | 888 | 5.4% |
| 30 to 34 Minutes | 2,091 | 12.6% |
| 35 to 39 Minutes | 817 | 4.9% |
| 40 to 44 Minutes | 634 | 3.8% |
| 45 to 59 Minutes | 991 | 6.0% |
| 60 to 89 Minutes | 376 | 2.3% |
| 90 or more Minutes | 245 | 1.5% |
Commute Time by Sex in Sun Prairie
The most common commute times in Sun Prairie are 20 to 24 minutes (1,376 commuters, 15.6%) for males and 15 to 19 minutes (1,512 commuters, 19.6%) for females.
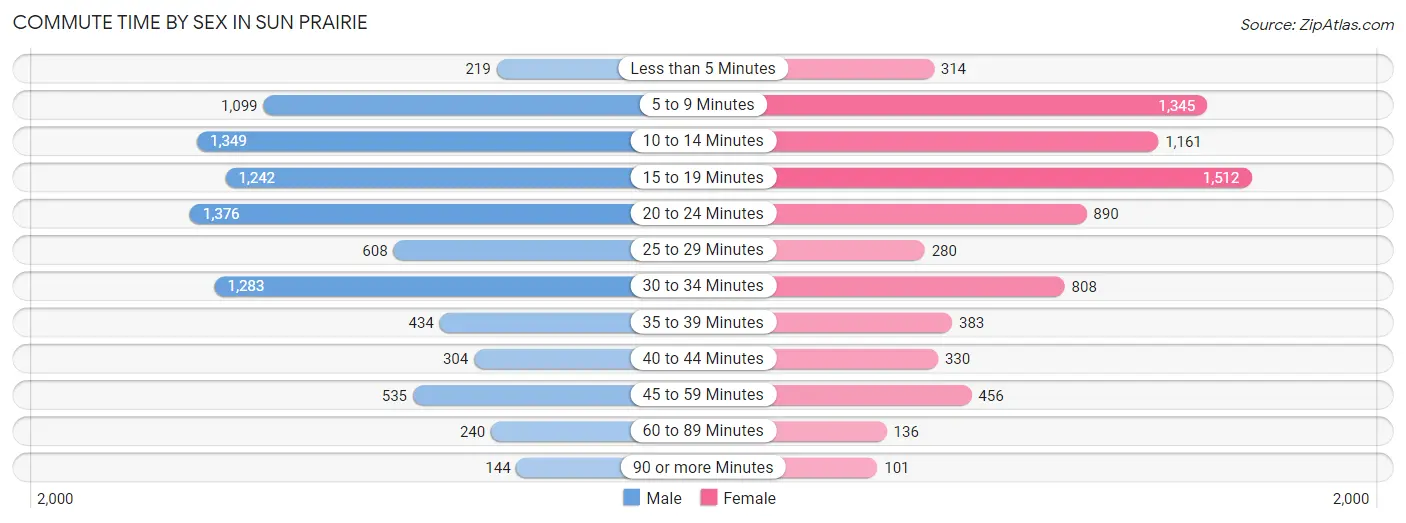
| Commute Time | Male | Female |
| Less than 5 Minutes | 219 (2.5%) | 314 (4.1%) |
| 5 to 9 Minutes | 1,099 (12.4%) | 1,345 (17.4%) |
| 10 to 14 Minutes | 1,349 (15.3%) | 1,161 (15.0%) |
| 15 to 19 Minutes | 1,242 (14.1%) | 1,512 (19.6%) |
| 20 to 24 Minutes | 1,376 (15.6%) | 890 (11.5%) |
| 25 to 29 Minutes | 608 (6.9%) | 280 (3.6%) |
| 30 to 34 Minutes | 1,283 (14.5%) | 808 (10.5%) |
| 35 to 39 Minutes | 434 (4.9%) | 383 (5.0%) |
| 40 to 44 Minutes | 304 (3.4%) | 330 (4.3%) |
| 45 to 59 Minutes | 535 (6.1%) | 456 (5.9%) |
| 60 to 89 Minutes | 240 (2.7%) | 136 (1.8%) |
| 90 or more Minutes | 144 (1.6%) | 101 (1.3%) |
Time of Departure to Work by Sex in Sun Prairie
The most frequent times of departure to work in Sun Prairie are 7:00 AM to 7:29 AM (1,603, 18.1%) for males and 7:30 AM to 7:59 AM (1,585, 20.5%) for females.
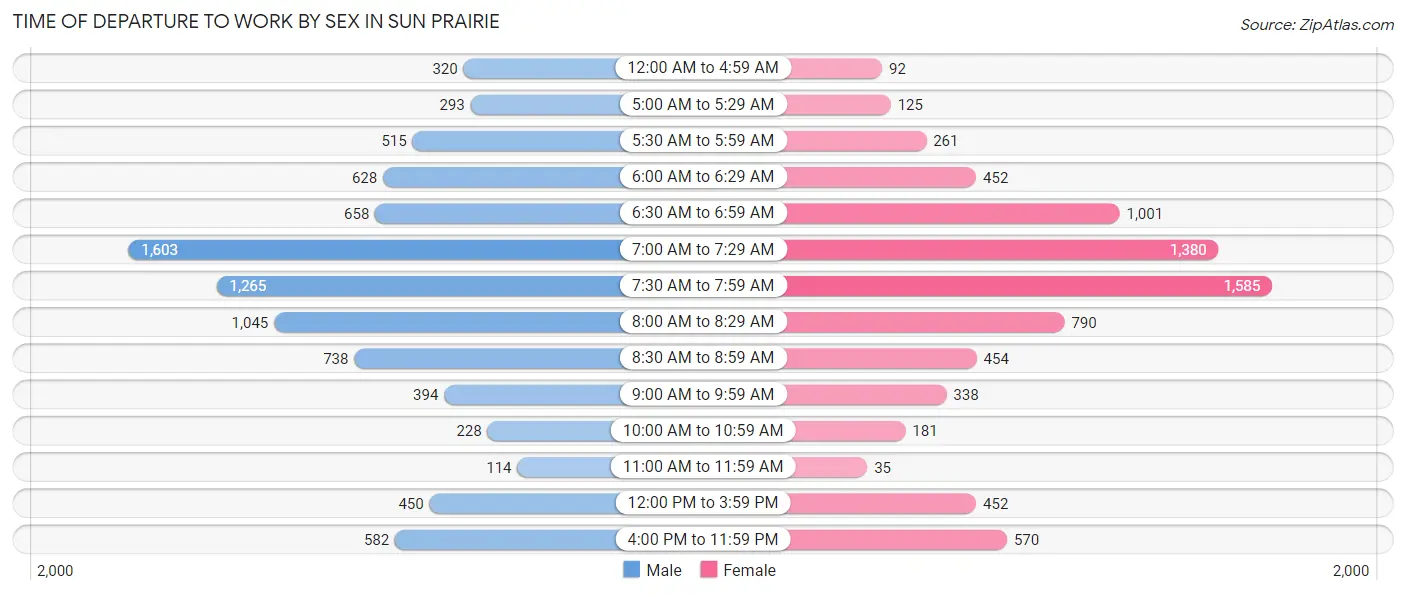
| Time of Departure | Male | Female |
| 12:00 AM to 4:59 AM | 320 (3.6%) | 92 (1.2%) |
| 5:00 AM to 5:29 AM | 293 (3.3%) | 125 (1.6%) |
| 5:30 AM to 5:59 AM | 515 (5.8%) | 261 (3.4%) |
| 6:00 AM to 6:29 AM | 628 (7.1%) | 452 (5.9%) |
| 6:30 AM to 6:59 AM | 658 (7.4%) | 1,001 (13.0%) |
| 7:00 AM to 7:29 AM | 1,603 (18.1%) | 1,380 (17.9%) |
| 7:30 AM to 7:59 AM | 1,265 (14.3%) | 1,585 (20.5%) |
| 8:00 AM to 8:29 AM | 1,045 (11.8%) | 790 (10.2%) |
| 8:30 AM to 8:59 AM | 738 (8.4%) | 454 (5.9%) |
| 9:00 AM to 9:59 AM | 394 (4.5%) | 338 (4.4%) |
| 10:00 AM to 10:59 AM | 228 (2.6%) | 181 (2.4%) |
| 11:00 AM to 11:59 AM | 114 (1.3%) | 35 (0.4%) |
| 12:00 PM to 3:59 PM | 450 (5.1%) | 452 (5.9%) |
| 4:00 PM to 11:59 PM | 582 (6.6%) | 570 (7.4%) |
| Total | 8,833 (100.0%) | 7,716 (100.0%) |
Housing Occupancy in Sun Prairie
Occupancy by Ownership in Sun Prairie
Of the total 14,697 dwellings in Sun Prairie, owner-occupied units account for 9,196 (62.6%), while renter-occupied units make up 5,501 (37.4%).
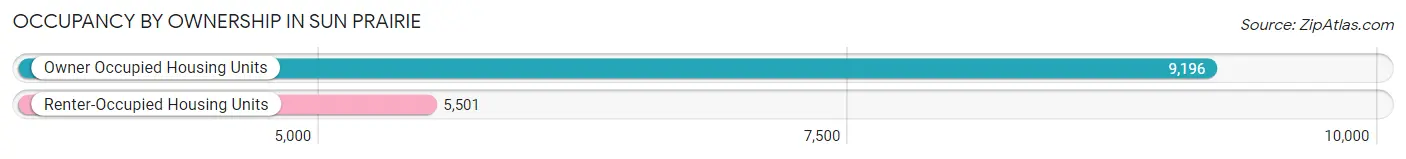
| Occupancy | # Housing Units | % Housing Units |
| Owner Occupied Housing Units | 9,196 | 62.6% |
| Renter-Occupied Housing Units | 5,501 | 37.4% |
| Total Occupied Housing Units | 14,697 | 100.0% |
Occupancy by Household Size in Sun Prairie
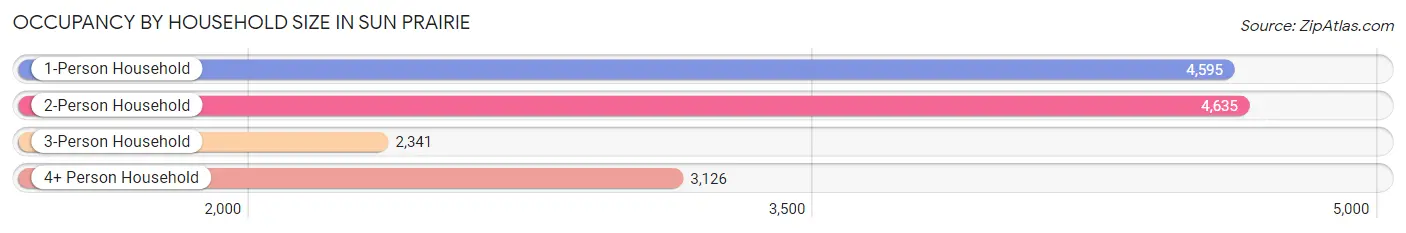
| Household Size | # Housing Units | % Housing Units |
| 1-Person Household | 4,595 | 31.3% |
| 2-Person Household | 4,635 | 31.5% |
| 3-Person Household | 2,341 | 15.9% |
| 4+ Person Household | 3,126 | 21.3% |
| Total Housing Units | 14,697 | 100.0% |
Occupancy by Ownership by Household Size in Sun Prairie
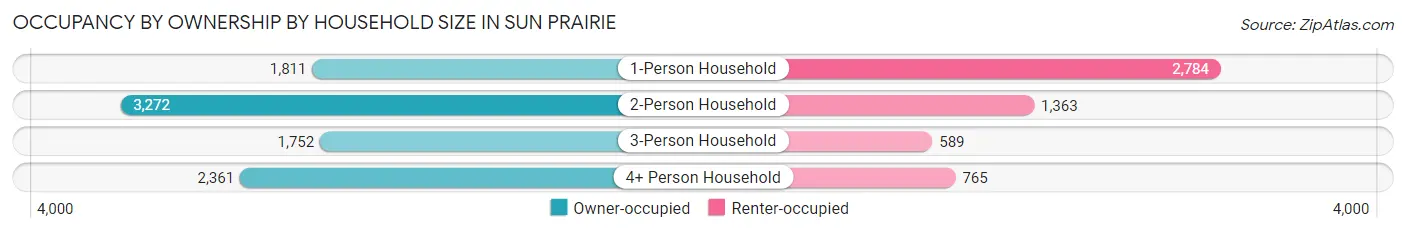
| Household Size | Owner-occupied | Renter-occupied |
| 1-Person Household | 1,811 (39.4%) | 2,784 (60.6%) |
| 2-Person Household | 3,272 (70.6%) | 1,363 (29.4%) |
| 3-Person Household | 1,752 (74.8%) | 589 (25.2%) |
| 4+ Person Household | 2,361 (75.5%) | 765 (24.5%) |
| Total Housing Units | 9,196 (62.6%) | 5,501 (37.4%) |
Occupancy by Educational Attainment in Sun Prairie
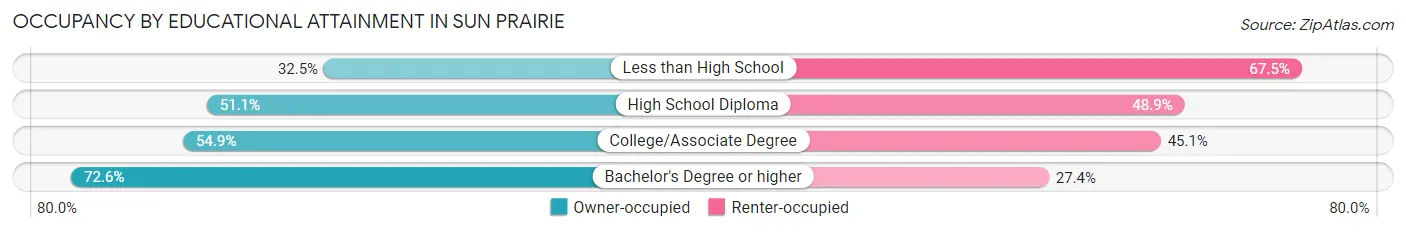
| Household Size | Owner-occupied | Renter-occupied |
| Less than High School | 160 (32.5%) | 332 (67.5%) |
| High School Diploma | 1,444 (51.1%) | 1,382 (48.9%) |
| College/Associate Degree | 2,075 (54.9%) | 1,707 (45.1%) |
| Bachelor's Degree or higher | 5,517 (72.6%) | 2,080 (27.4%) |
Occupancy by Age of Householder in Sun Prairie
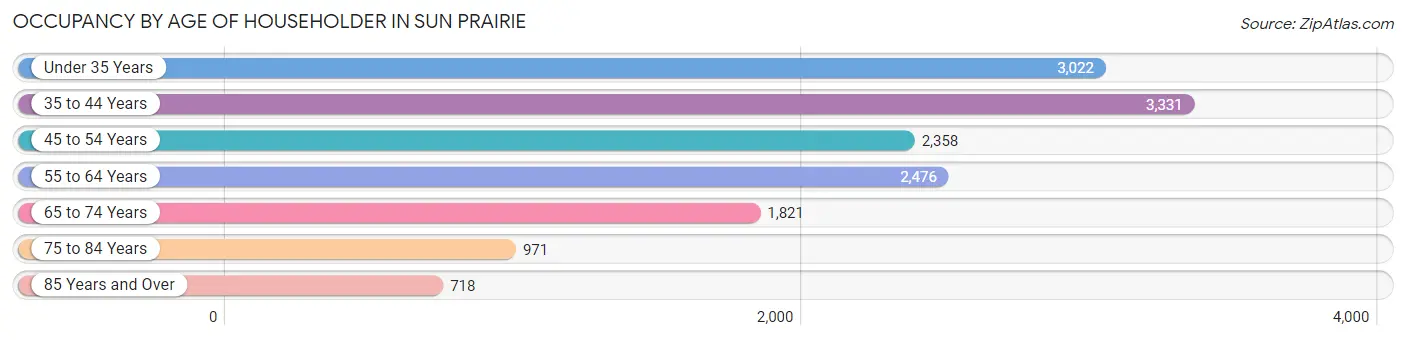
| Age Bracket | # Households | % Households |
| Under 35 Years | 3,022 | 20.6% |
| 35 to 44 Years | 3,331 | 22.7% |
| 45 to 54 Years | 2,358 | 16.0% |
| 55 to 64 Years | 2,476 | 16.9% |
| 65 to 74 Years | 1,821 | 12.4% |
| 75 to 84 Years | 971 | 6.6% |
| 85 Years and Over | 718 | 4.9% |
| Total | 14,697 | 100.0% |
Housing Finances in Sun Prairie
Median Income by Occupancy in Sun Prairie
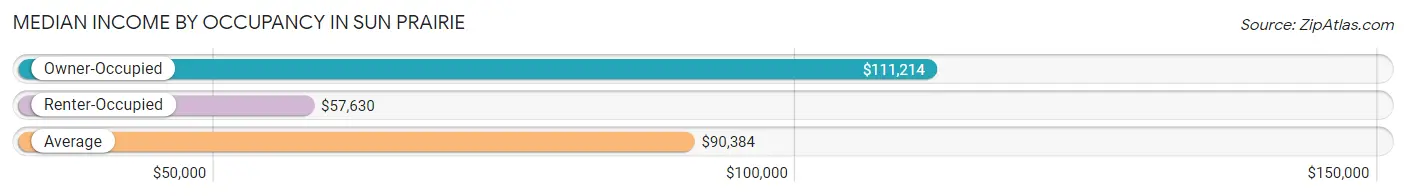
| Occupancy Type | # Households | Median Income |
| Owner-Occupied | 9,196 (62.6%) | $111,214 |
| Renter-Occupied | 5,501 (37.4%) | $57,630 |
| Average | 14,697 (100.0%) | $90,384 |
Occupancy by Householder Income Bracket in Sun Prairie
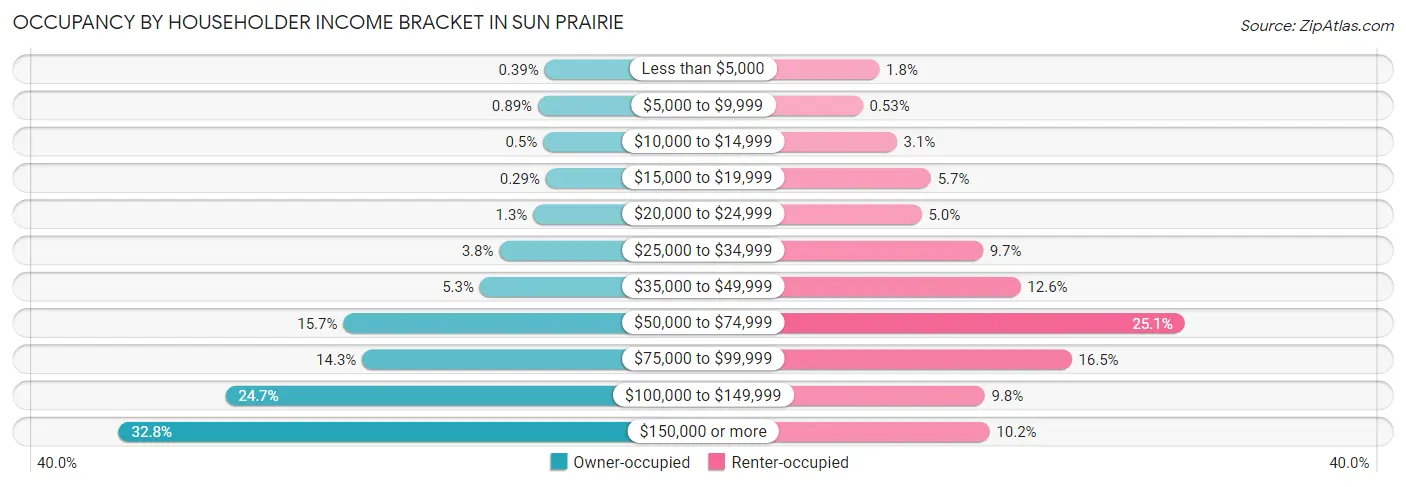
| Income Bracket | Owner-occupied | Renter-occupied |
| Less than $5,000 | 36 (0.4%) | 99 (1.8%) |
| $5,000 to $9,999 | 82 (0.9%) | 29 (0.5%) |
| $10,000 to $14,999 | 46 (0.5%) | 172 (3.1%) |
| $15,000 to $19,999 | 27 (0.3%) | 315 (5.7%) |
| $20,000 to $24,999 | 115 (1.3%) | 276 (5.0%) |
| $25,000 to $34,999 | 352 (3.8%) | 533 (9.7%) |
| $35,000 to $49,999 | 489 (5.3%) | 691 (12.6%) |
| $50,000 to $74,999 | 1,446 (15.7%) | 1,379 (25.1%) |
| $75,000 to $99,999 | 1,313 (14.3%) | 905 (16.5%) |
| $100,000 to $149,999 | 2,271 (24.7%) | 541 (9.8%) |
| $150,000 or more | 3,019 (32.8%) | 561 (10.2%) |
| Total | 9,196 (100.0%) | 5,501 (100.0%) |
Monthly Housing Cost Tiers in Sun Prairie
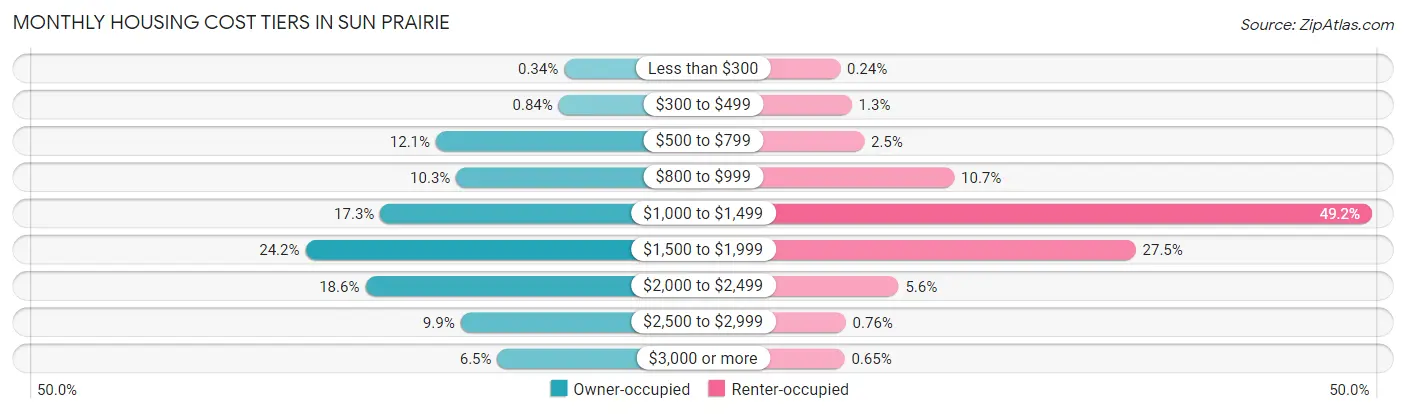
| Monthly Cost | Owner-occupied | Renter-occupied |
| Less than $300 | 31 (0.3%) | 13 (0.2%) |
| $300 to $499 | 77 (0.8%) | 72 (1.3%) |
| $500 to $799 | 1,116 (12.1%) | 135 (2.5%) |
| $800 to $999 | 944 (10.3%) | 591 (10.7%) |
| $1,000 to $1,499 | 1,588 (17.3%) | 2,706 (49.2%) |
| $1,500 to $1,999 | 2,222 (24.2%) | 1,510 (27.5%) |
| $2,000 to $2,499 | 1,714 (18.6%) | 309 (5.6%) |
| $2,500 to $2,999 | 908 (9.9%) | 42 (0.8%) |
| $3,000 or more | 596 (6.5%) | 36 (0.6%) |
| Total | 9,196 (100.0%) | 5,501 (100.0%) |
Physical Housing Characteristics in Sun Prairie
Housing Structures in Sun Prairie
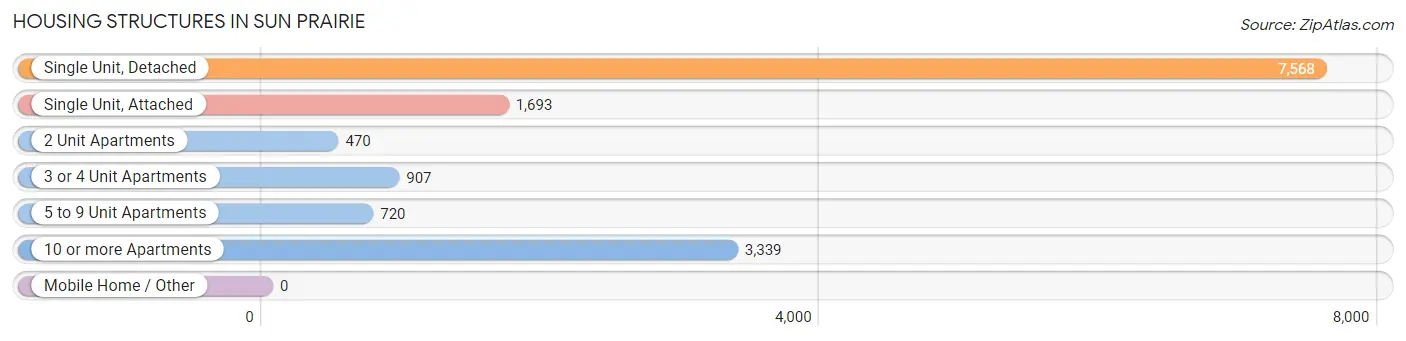
| Structure Type | # Housing Units | % Housing Units |
| Single Unit, Detached | 7,568 | 51.5% |
| Single Unit, Attached | 1,693 | 11.5% |
| 2 Unit Apartments | 470 | 3.2% |
| 3 or 4 Unit Apartments | 907 | 6.2% |
| 5 to 9 Unit Apartments | 720 | 4.9% |
| 10 or more Apartments | 3,339 | 22.7% |
| Mobile Home / Other | 0 | 0.0% |
| Total | 14,697 | 100.0% |
Housing Structures by Occupancy in Sun Prairie
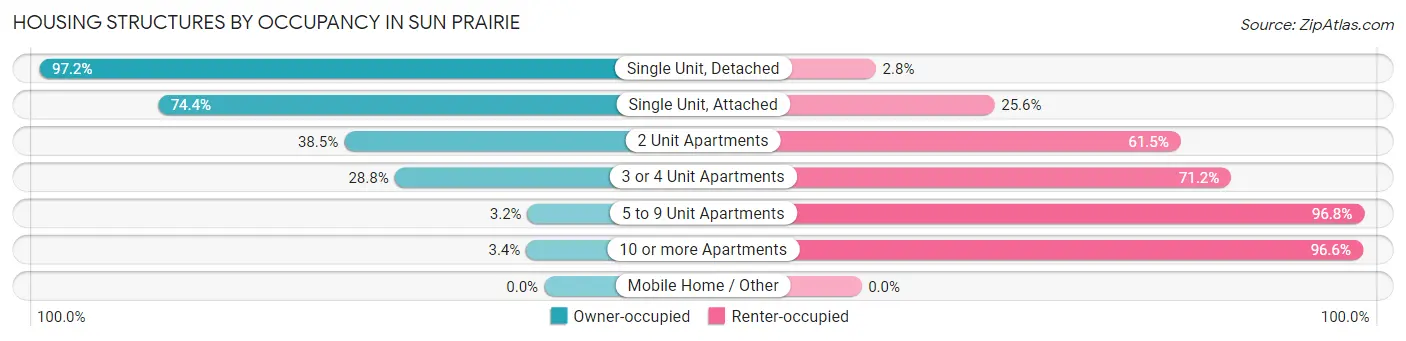
| Structure Type | Owner-occupied | Renter-occupied |
| Single Unit, Detached | 7,357 (97.2%) | 211 (2.8%) |
| Single Unit, Attached | 1,259 (74.4%) | 434 (25.6%) |
| 2 Unit Apartments | 181 (38.5%) | 289 (61.5%) |
| 3 or 4 Unit Apartments | 261 (28.8%) | 646 (71.2%) |
| 5 to 9 Unit Apartments | 23 (3.2%) | 697 (96.8%) |
| 10 or more Apartments | 115 (3.4%) | 3,224 (96.6%) |
| Mobile Home / Other | 0 (0.0%) | 0 (0.0%) |
| Total | 9,196 (62.6%) | 5,501 (37.4%) |
Housing Structures by Number of Rooms in Sun Prairie
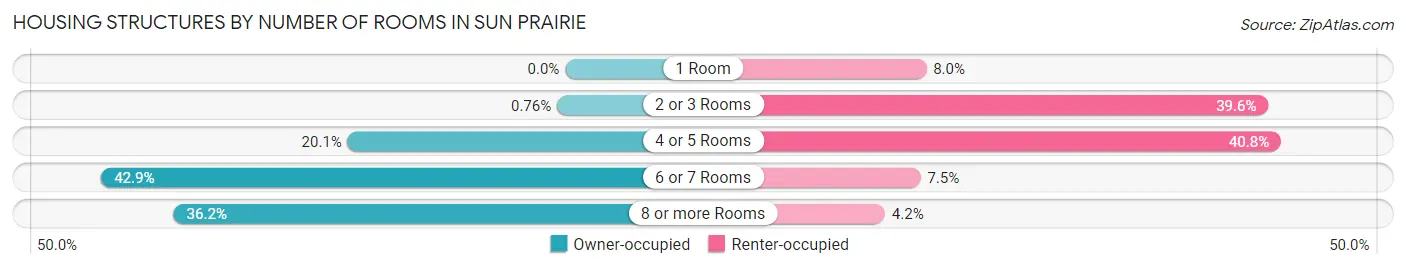
| Number of Rooms | Owner-occupied | Renter-occupied |
| 1 Room | 0 (0.0%) | 439 (8.0%) |
| 2 or 3 Rooms | 70 (0.8%) | 2,179 (39.6%) |
| 4 or 5 Rooms | 1,850 (20.1%) | 2,244 (40.8%) |
| 6 or 7 Rooms | 3,946 (42.9%) | 410 (7.4%) |
| 8 or more Rooms | 3,330 (36.2%) | 229 (4.2%) |
| Total | 9,196 (100.0%) | 5,501 (100.0%) |
Housing Structure by Heating Type in Sun Prairie
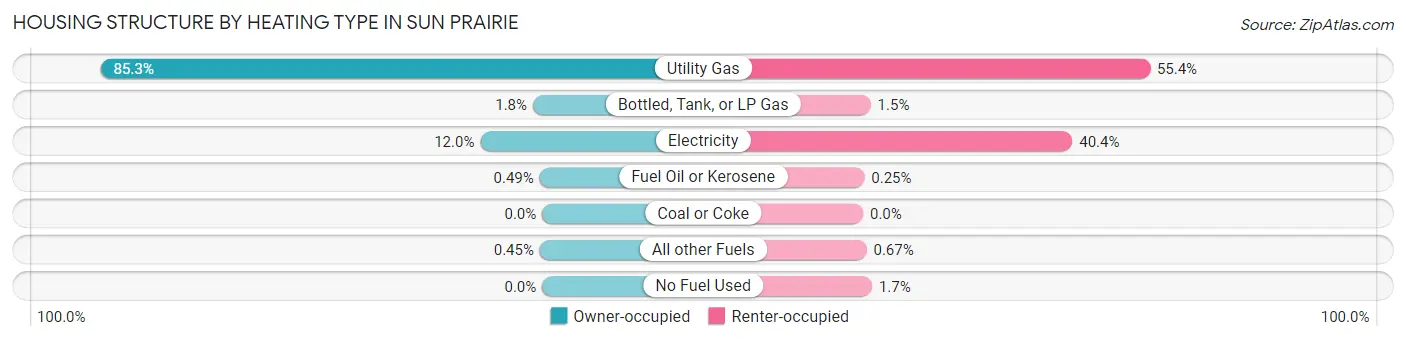
| Heating Type | Owner-occupied | Renter-occupied |
| Utility Gas | 7,847 (85.3%) | 3,050 (55.4%) |
| Bottled, Tank, or LP Gas | 164 (1.8%) | 81 (1.5%) |
| Electricity | 1,099 (11.9%) | 2,224 (40.4%) |
| Fuel Oil or Kerosene | 45 (0.5%) | 14 (0.3%) |
| Coal or Coke | 0 (0.0%) | 0 (0.0%) |
| All other Fuels | 41 (0.4%) | 37 (0.7%) |
| No Fuel Used | 0 (0.0%) | 95 (1.7%) |
| Total | 9,196 (100.0%) | 5,501 (100.0%) |
Household Vehicle Usage in Sun Prairie
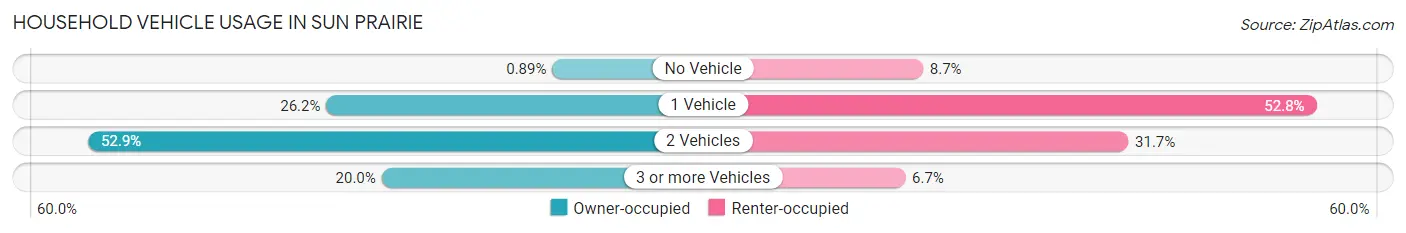
| Vehicles per Household | Owner-occupied | Renter-occupied |
| No Vehicle | 82 (0.9%) | 480 (8.7%) |
| 1 Vehicle | 2,409 (26.2%) | 2,905 (52.8%) |
| 2 Vehicles | 4,865 (52.9%) | 1,745 (31.7%) |
| 3 or more Vehicles | 1,840 (20.0%) | 371 (6.7%) |
| Total | 9,196 (100.0%) | 5,501 (100.0%) |
Real Estate & Mortgages in Sun Prairie
Real Estate and Mortgage Overview in Sun Prairie
| Characteristic | Without Mortgage | With Mortgage |
| Housing Units | 2,413 | 6,783 |
| Median Property Value | $296,800 | $318,300 |
| Median Household Income | $74,450 | $2,407 |
| Monthly Housing Costs | $806 | $596 |
| Real Estate Taxes | $5,856 | $3 |
Property Value by Mortgage Status in Sun Prairie
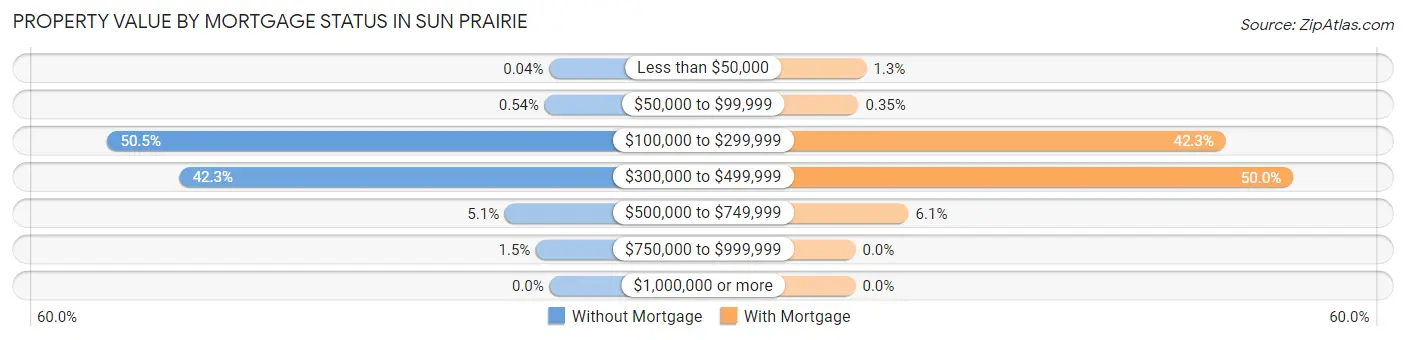
| Property Value | Without Mortgage | With Mortgage |
| Less than $50,000 | 1 (0.0%) | 85 (1.3%) |
| $50,000 to $99,999 | 13 (0.5%) | 24 (0.4%) |
| $100,000 to $299,999 | 1,219 (50.5%) | 2,870 (42.3%) |
| $300,000 to $499,999 | 1,020 (42.3%) | 3,392 (50.0%) |
| $500,000 to $749,999 | 123 (5.1%) | 412 (6.1%) |
| $750,000 to $999,999 | 37 (1.5%) | 0 (0.0%) |
| $1,000,000 or more | 0 (0.0%) | 0 (0.0%) |
| Total | 2,413 (100.0%) | 6,783 (100.0%) |
Household Income by Mortgage Status in Sun Prairie
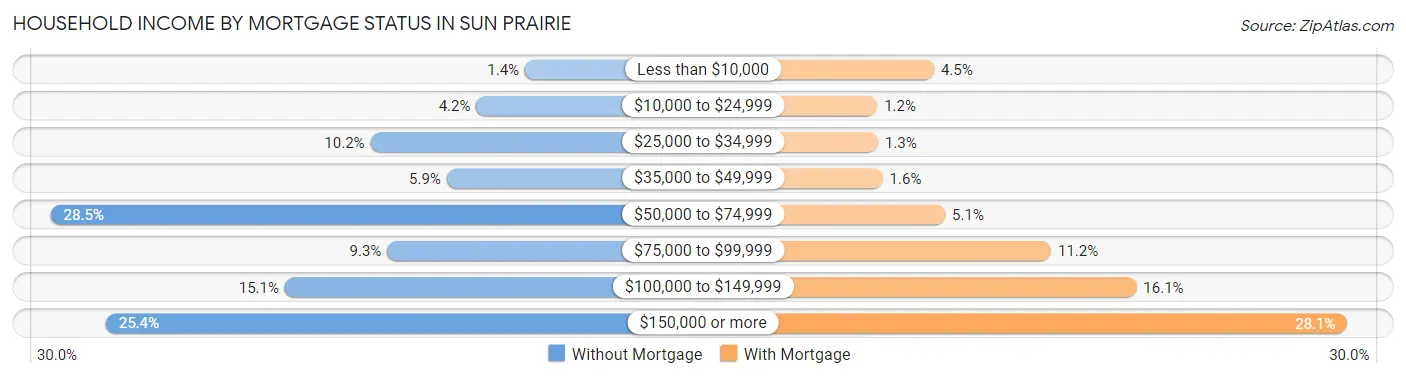
| Household Income | Without Mortgage | With Mortgage |
| Less than $10,000 | 34 (1.4%) | 304 (4.5%) |
| $10,000 to $24,999 | 101 (4.2%) | 84 (1.2%) |
| $25,000 to $34,999 | 247 (10.2%) | 87 (1.3%) |
| $35,000 to $49,999 | 142 (5.9%) | 105 (1.5%) |
| $50,000 to $74,999 | 688 (28.5%) | 347 (5.1%) |
| $75,000 to $99,999 | 224 (9.3%) | 758 (11.2%) |
| $100,000 to $149,999 | 365 (15.1%) | 1,089 (16.1%) |
| $150,000 or more | 612 (25.4%) | 1,906 (28.1%) |
| Total | 2,413 (100.0%) | 6,783 (100.0%) |
Property Value to Household Income Ratio in Sun Prairie
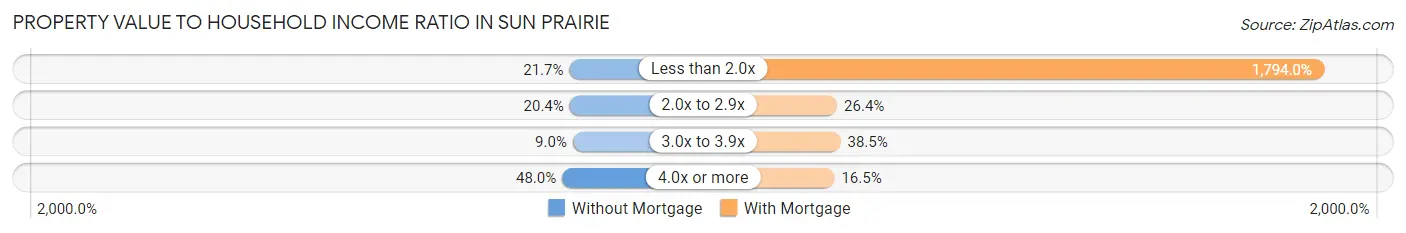
| Value-to-Income Ratio | Without Mortgage | With Mortgage |
| Less than 2.0x | 523 (21.7%) | 121,687 (1,794.0%) |
| 2.0x to 2.9x | 491 (20.3%) | 1,790 (26.4%) |
| 3.0x to 3.9x | 217 (9.0%) | 2,609 (38.5%) |
| 4.0x or more | 1,157 (47.9%) | 1,121 (16.5%) |
| Total | 2,413 (100.0%) | 6,783 (100.0%) |
Real Estate Taxes by Mortgage Status in Sun Prairie
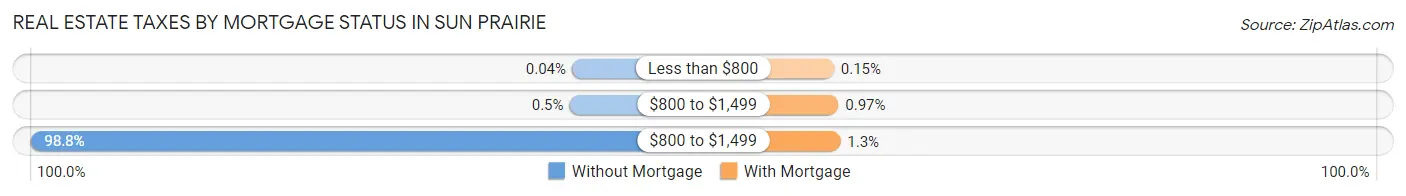
| Property Taxes | Without Mortgage | With Mortgage |
| Less than $800 | 1 (0.0%) | 10 (0.2%) |
| $800 to $1,499 | 12 (0.5%) | 66 (1.0%) |
| $800 to $1,499 | 2,383 (98.8%) | 91 (1.3%) |
| Total | 2,413 (100.0%) | 6,783 (100.0%) |
Health & Disability in Sun Prairie
Health Insurance Coverage by Age in Sun Prairie
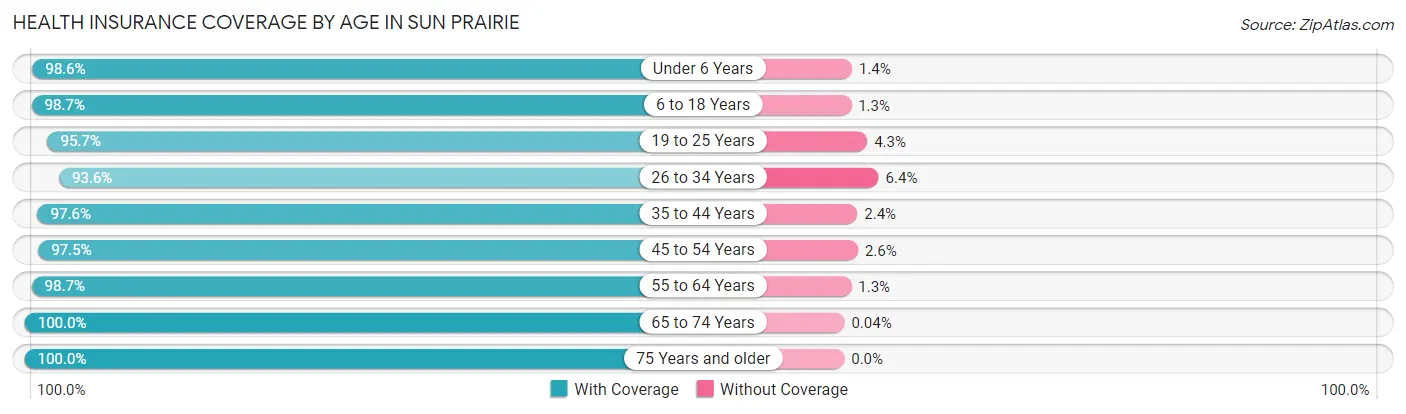
| Age Bracket | With Coverage | Without Coverage |
| Under 6 Years | 2,608 (98.6%) | 38 (1.4%) |
| 6 to 18 Years | 6,286 (98.7%) | 82 (1.3%) |
| 19 to 25 Years | 2,685 (95.7%) | 120 (4.3%) |
| 26 to 34 Years | 4,251 (93.6%) | 291 (6.4%) |
| 35 to 44 Years | 5,736 (97.6%) | 143 (2.4%) |
| 45 to 54 Years | 4,007 (97.5%) | 105 (2.5%) |
| 55 to 64 Years | 4,194 (98.7%) | 56 (1.3%) |
| 65 to 74 Years | 2,652 (100.0%) | 1 (0.0%) |
| 75 Years and older | 2,390 (100.0%) | 0 (0.0%) |
| Total | 34,809 (97.7%) | 836 (2.4%) |
Health Insurance Coverage by Citizenship Status in Sun Prairie
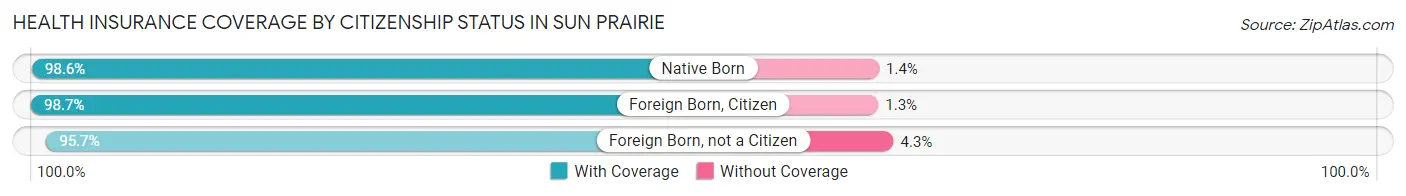
| Citizenship Status | With Coverage | Without Coverage |
| Native Born | 2,608 (98.6%) | 38 (1.4%) |
| Foreign Born, Citizen | 6,286 (98.7%) | 82 (1.3%) |
| Foreign Born, not a Citizen | 2,685 (95.7%) | 120 (4.3%) |
Health Insurance Coverage by Household Income in Sun Prairie
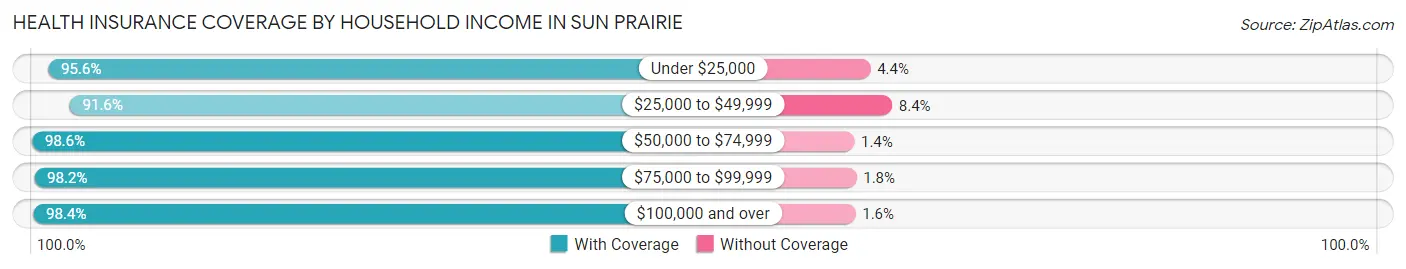
| Household Income | With Coverage | Without Coverage |
| Under $25,000 | 2,005 (95.6%) | 92 (4.4%) |
| $25,000 to $49,999 | 2,830 (91.6%) | 261 (8.4%) |
| $50,000 to $74,999 | 4,934 (98.6%) | 68 (1.4%) |
| $75,000 to $99,999 | 5,239 (98.2%) | 95 (1.8%) |
| $100,000 and over | 19,744 (98.4%) | 319 (1.6%) |
Public vs Private Health Insurance Coverage by Age in Sun Prairie
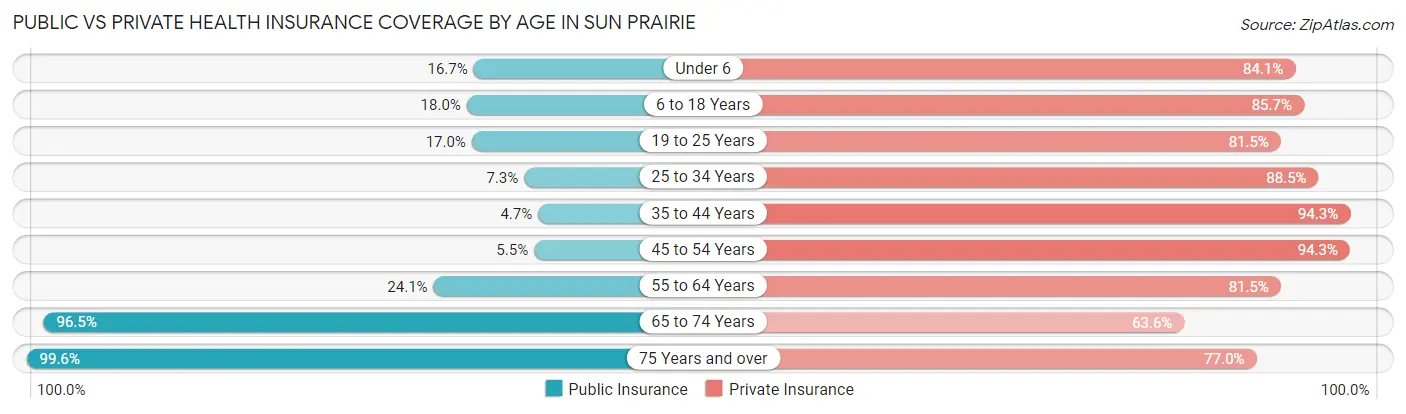
| Age Bracket | Public Insurance | Private Insurance |
| Under 6 | 441 (16.7%) | 2,226 (84.1%) |
| 6 to 18 Years | 1,143 (17.9%) | 5,460 (85.7%) |
| 19 to 25 Years | 477 (17.0%) | 2,285 (81.5%) |
| 25 to 34 Years | 331 (7.3%) | 4,018 (88.5%) |
| 35 to 44 Years | 276 (4.7%) | 5,546 (94.3%) |
| 45 to 54 Years | 224 (5.4%) | 3,877 (94.3%) |
| 55 to 64 Years | 1,025 (24.1%) | 3,462 (81.5%) |
| 65 to 74 Years | 2,560 (96.5%) | 1,686 (63.5%) |
| 75 Years and over | 2,381 (99.6%) | 1,839 (76.9%) |
| Total | 8,858 (24.8%) | 30,399 (85.3%) |
Disability Status by Sex by Age in Sun Prairie
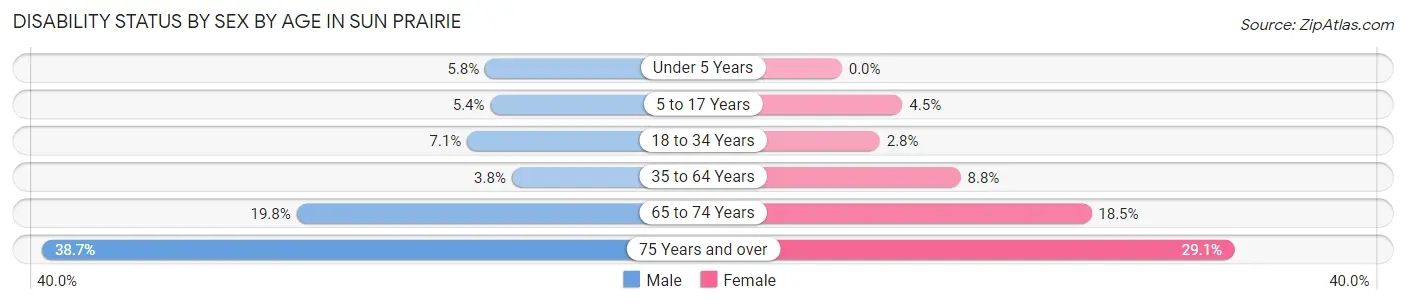
| Age Bracket | Male | Female |
| Under 5 Years | 63 (5.8%) | 0 (0.0%) |
| 5 to 17 Years | 205 (5.4%) | 131 (4.5%) |
| 18 to 34 Years | 263 (7.1%) | 112 (2.8%) |
| 35 to 64 Years | 268 (3.8%) | 638 (8.8%) |
| 65 to 74 Years | 224 (19.8%) | 282 (18.5%) |
| 75 Years and over | 283 (38.7%) | 483 (29.1%) |
Disability Class by Sex by Age in Sun Prairie
Disability Class: Hearing Difficulty
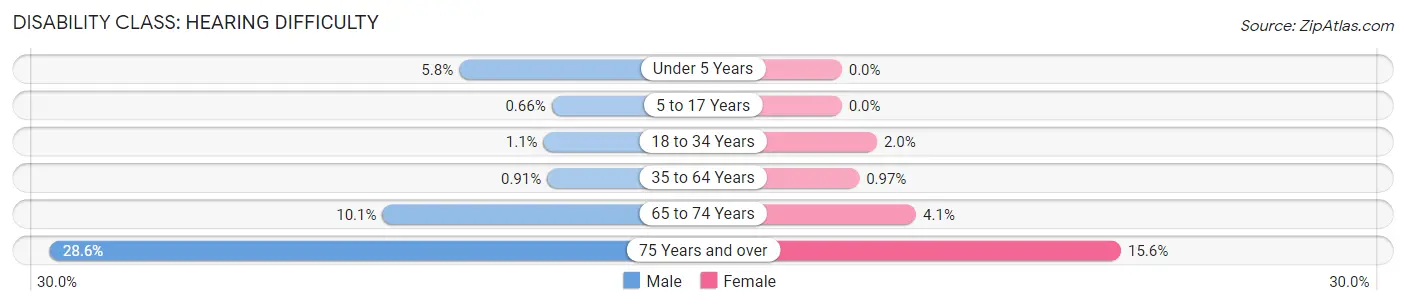
| Age Bracket | Male | Female |
| Under 5 Years | 63 (5.8%) | 0 (0.0%) |
| 5 to 17 Years | 25 (0.7%) | 0 (0.0%) |
| 18 to 34 Years | 41 (1.1%) | 78 (2.0%) |
| 35 to 64 Years | 64 (0.9%) | 70 (1.0%) |
| 65 to 74 Years | 114 (10.1%) | 63 (4.1%) |
| 75 Years and over | 209 (28.6%) | 258 (15.5%) |
Disability Class: Vision Difficulty
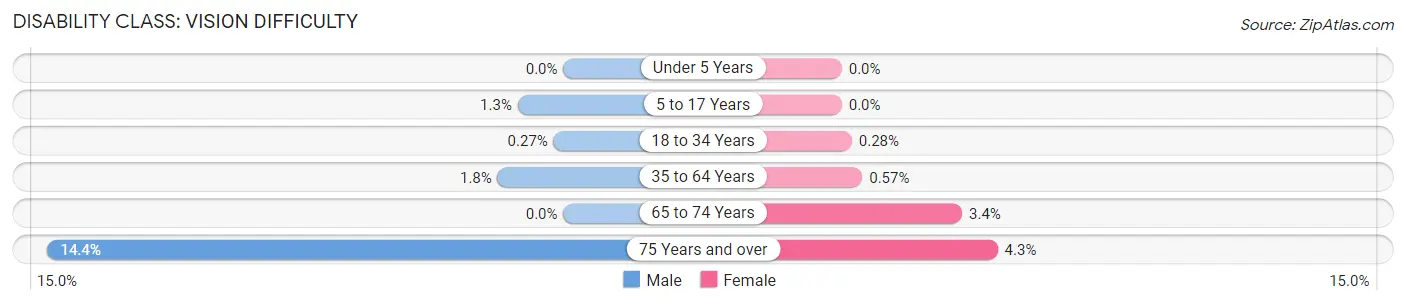
| Age Bracket | Male | Female |
| Under 5 Years | 0 (0.0%) | 0 (0.0%) |
| 5 to 17 Years | 48 (1.3%) | 0 (0.0%) |
| 18 to 34 Years | 10 (0.3%) | 11 (0.3%) |
| 35 to 64 Years | 128 (1.8%) | 41 (0.6%) |
| 65 to 74 Years | 0 (0.0%) | 51 (3.4%) |
| 75 Years and over | 105 (14.4%) | 72 (4.3%) |
Disability Class: Cognitive Difficulty
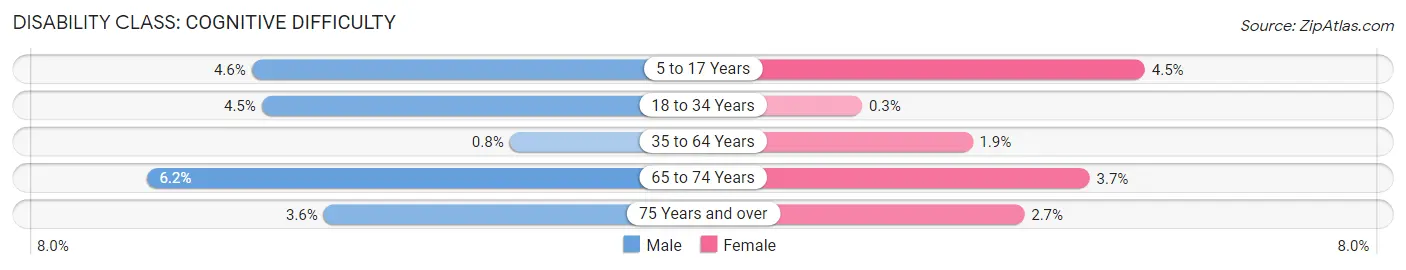
| Age Bracket | Male | Female |
| 5 to 17 Years | 175 (4.6%) | 131 (4.5%) |
| 18 to 34 Years | 165 (4.5%) | 12 (0.3%) |
| 35 to 64 Years | 56 (0.8%) | 140 (1.9%) |
| 65 to 74 Years | 70 (6.2%) | 56 (3.7%) |
| 75 Years and over | 26 (3.6%) | 45 (2.7%) |
Disability Class: Ambulatory Difficulty
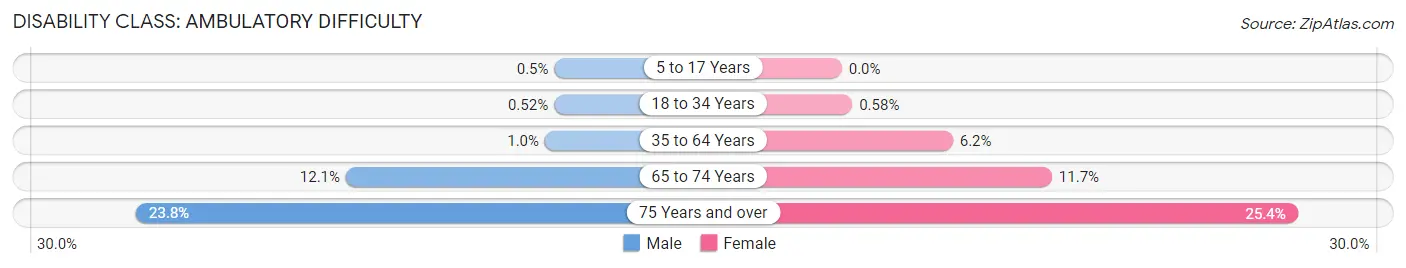
| Age Bracket | Male | Female |
| 5 to 17 Years | 19 (0.5%) | 0 (0.0%) |
| 18 to 34 Years | 19 (0.5%) | 23 (0.6%) |
| 35 to 64 Years | 72 (1.0%) | 447 (6.2%) |
| 65 to 74 Years | 137 (12.1%) | 178 (11.7%) |
| 75 Years and over | 174 (23.8%) | 421 (25.4%) |
Disability Class: Self-Care Difficulty
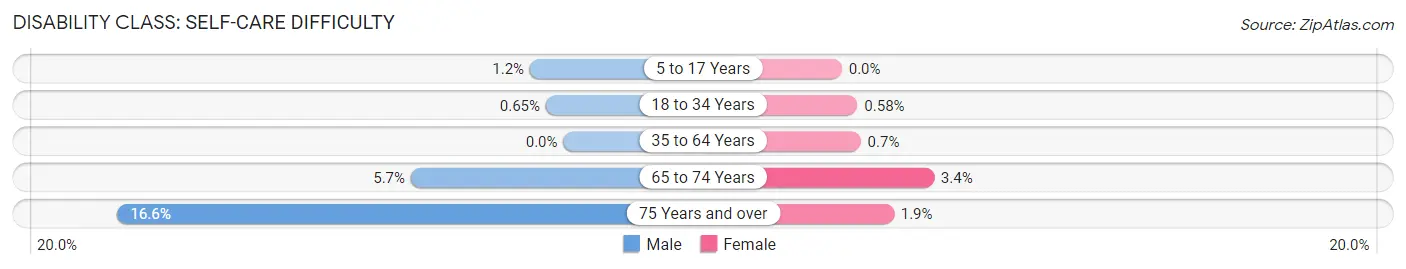
| Age Bracket | Male | Female |
| 5 to 17 Years | 47 (1.2%) | 0 (0.0%) |
| 18 to 34 Years | 24 (0.6%) | 23 (0.6%) |
| 35 to 64 Years | 0 (0.0%) | 51 (0.7%) |
| 65 to 74 Years | 64 (5.7%) | 52 (3.4%) |
| 75 Years and over | 121 (16.6%) | 32 (1.9%) |
Technology Access in Sun Prairie
Computing Device Access in Sun Prairie
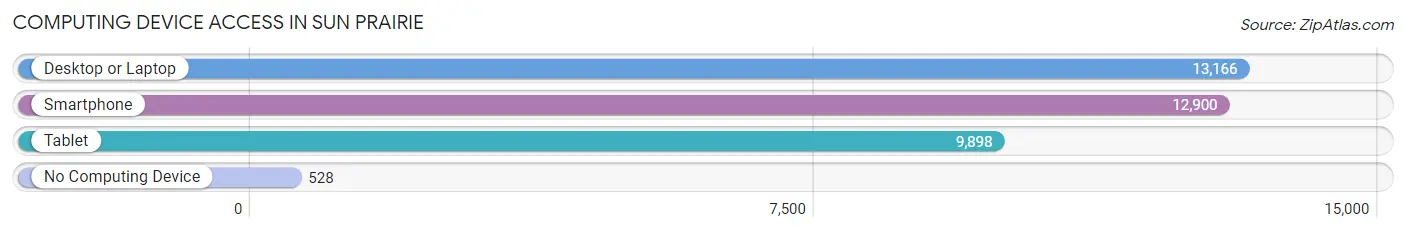
| Device Type | # Households | % Households |
| Desktop or Laptop | 13,166 | 89.6% |
| Smartphone | 12,900 | 87.8% |
| Tablet | 9,898 | 67.3% |
| No Computing Device | 528 | 3.6% |
| Total | 14,697 | 100.0% |
Internet Access in Sun Prairie
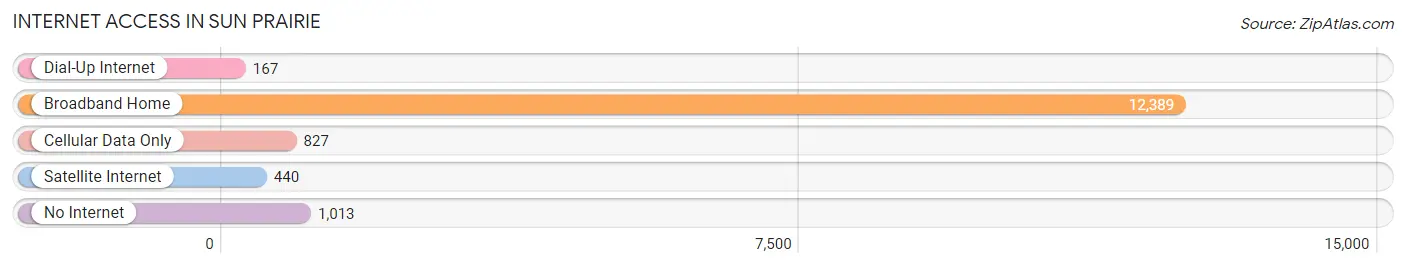
| Internet Type | # Households | % Households |
| Dial-Up Internet | 167 | 1.1% |
| Broadband Home | 12,389 | 84.3% |
| Cellular Data Only | 827 | 5.6% |
| Satellite Internet | 440 | 3.0% |
| No Internet | 1,013 | 6.9% |
| Total | 14,697 | 100.0% |
Sun Prairie Summary
History
The city of Sun Prairie, Wisconsin is located in Dane County and is part of the Madison metropolitan area. The city was founded in 1836 by James Lawes, a settler from New York. Lawes named the city after the sunflowers that grew in the area. The city was officially incorporated in 1868.
In the late 19th century, Sun Prairie was a thriving agricultural community. The city was known for its dairy farms and was home to several cheese factories. The city also had a thriving brick-making industry, which supplied bricks for many of the buildings in the city.
In the early 20th century, Sun Prairie began to experience rapid growth. The city was home to several factories, including a canning factory, a paper mill, and a foundry. The city also had a thriving retail sector, with several stores and restaurants.
Geography
Sun Prairie is located in south-central Wisconsin, about 10 miles east of Madison. The city is situated on the banks of the Yahara River, which flows through the city. The city is surrounded by rolling hills and is home to several parks and nature preserves.
The city has a total area of 16.2 square miles, of which 15.9 square miles is land and 0.3 square miles is water. The city has a humid continental climate, with cold winters and hot, humid summers.
Economy
Sun Prairie’s economy is largely based on agriculture and manufacturing. The city is home to several large farms, which produce dairy products, vegetables, and grains. The city also has several factories, which produce paper products, plastics, and other goods.
The city is also home to several retail stores and restaurants. The city is home to several large employers, including the University of Wisconsin-Madison, the Sun Prairie Medical Center, and the Sun Prairie School District.
Demographics
As of the 2010 census, Sun Prairie had a population of 29,441. The city has a median household income of $60,945 and a median family income of $76,945. The city has a poverty rate of 8.3%.
The city is predominantly white, with 87.3% of the population identifying as white. The city also has a large Hispanic population, with 8.3% of the population identifying as Hispanic or Latino. The city also has a small African American population, with 2.2% of the population identifying as African American.
Sun Prairie is home to several religious denominations, including Catholic, Lutheran, and Methodist. The city also has a large Jewish population, with 4.2% of the population identifying as Jewish.
Common Questions
What is Per Capita Income in Sun Prairie?
Per Capita income in Sun Prairie is $44,260.
What is the Median Family Income in Sun Prairie?
Median Family Income in Sun Prairie is $112,828.
What is the Median Household income in Sun Prairie?
Median Household Income in Sun Prairie is $90,384.
What is Income or Wage Gap in Sun Prairie?
Income or Wage Gap in Sun Prairie is 25.4%.
Women in Sun Prairie earn 74.6 cents for every dollar earned by a man.
What is Inequality or Gini Index in Sun Prairie?
Inequality or Gini Index in Sun Prairie is 0.37.
What is the Total Population of Sun Prairie?
Total Population of Sun Prairie is 35,847.
What is the Total Male Population of Sun Prairie?
Total Male Population of Sun Prairie is 17,523.
What is the Total Female Population of Sun Prairie?
Total Female Population of Sun Prairie is 18,324.
What is the Ratio of Males per 100 Females in Sun Prairie?
There are 95.63 Males per 100 Females in Sun Prairie.
What is the Ratio of Females per 100 Males in Sun Prairie?
There are 104.57 Females per 100 Males in Sun Prairie.
What is the Median Population Age in Sun Prairie?
Median Population Age in Sun Prairie is 37.7 Years.
What is the Average Family Size in Sun Prairie
Average Family Size in Sun Prairie is 3.0 People.
What is the Average Household Size in Sun Prairie
Average Household Size in Sun Prairie is 2.4 People.
How Large is the Labor Force in Sun Prairie?
There are 20,438 People in the Labor Forcein in Sun Prairie.
What is the Percentage of People in the Labor Force in Sun Prairie?
72.4% of People are in the Labor Force in Sun Prairie.
What is the Unemployment Rate in Sun Prairie?
Unemployment Rate in Sun Prairie is 1.6%.