Union Grove, WI Map & Demographics
Union Grove Map
Union Grove Overview
$39,143
PER CAPITA INCOME
$103,422
AVG FAMILY INCOME
$103,005
AVG HOUSEHOLD INCOME
44.7%
WAGE / INCOME GAP [ % ]
55.3¢/ $1
WAGE / INCOME GAP [ $ ]
0.39
INEQUALITY / GINI INDEX
4,916
TOTAL POPULATION
2,514
MALE POPULATION
2,402
FEMALE POPULATION
104.66
MALES / 100 FEMALES
95.54
FEMALES / 100 MALES
35.3
MEDIAN AGE
3.1
AVG FAMILY SIZE
2.6
AVG HOUSEHOLD SIZE
2,692
LABOR FORCE [ PEOPLE ]
71.3%
PERCENT IN LABOR FORCE
1.4%
UNEMPLOYMENT RATE
Union Grove Zip Codes
Union Grove Area Codes
Income in Union Grove
Income Overview in Union Grove
Per Capita Income in Union Grove is $39,143, while median incomes of families and households are $103,422 and $103,005 respectively.
| Characteristic | Number | Measure |
| Per Capita Income | 4,916 | $39,143 |
| Median Family Income | 1,231 | $103,422 |
| Mean Family Income | 1,231 | $116,506 |
| Median Household Income | 1,866 | $103,005 |
| Mean Household Income | 1,866 | $102,134 |
| Income Deficit | 1,231 | $0 |
| Wage / Income Gap (%) | 4,916 | 44.68% |
| Wage / Income Gap ($) | 4,916 | 55.32¢ per $1 |
| Gini / Inequality Index | 4,916 | 0.39 |
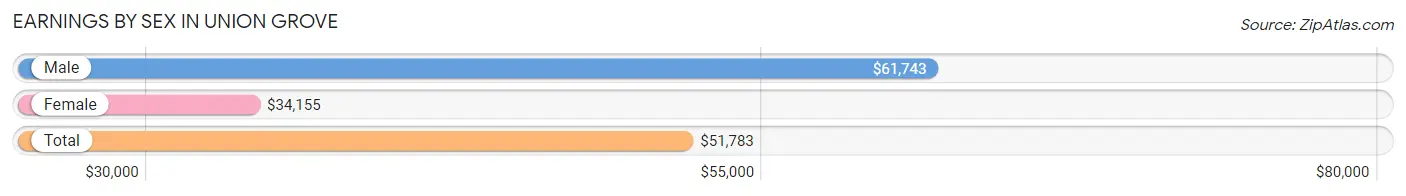
Earnings by Sex in Union Grove
Average Earnings in Union Grove are $51,783, $61,743 for men and $34,155 for women, a difference of 44.7%.
| Sex | Number | Average Earnings |
| Male | 1,449 (50.7%) | $61,743 |
| Female | 1,408 (49.3%) | $34,155 |
| Total | 2,857 (100.0%) | $51,783 |
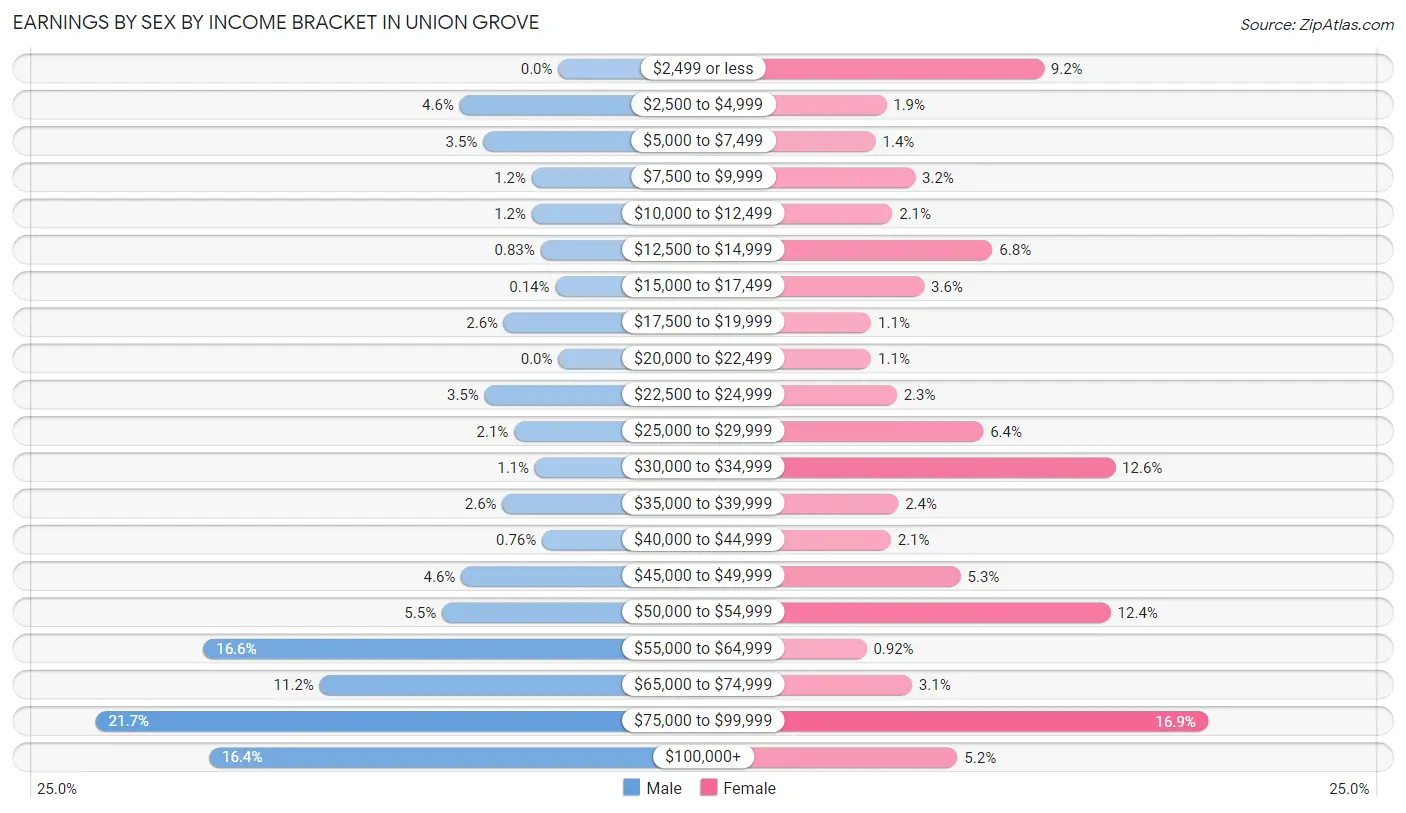
Earnings by Sex by Income Bracket in Union Grove
The most common earnings brackets in Union Grove are $75,000 to $99,999 for men (314 | 21.7%) and $75,000 to $99,999 for women (238 | 16.9%).
| Income | Male | Female |
| $2,499 or less | 0 (0.0%) | 130 (9.2%) |
| $2,500 to $4,999 | 67 (4.6%) | 26 (1.8%) |
| $5,000 to $7,499 | 51 (3.5%) | 19 (1.3%) |
| $7,500 to $9,999 | 18 (1.2%) | 45 (3.2%) |
| $10,000 to $12,499 | 18 (1.2%) | 30 (2.1%) |
| $12,500 to $14,999 | 12 (0.8%) | 96 (6.8%) |
| $15,000 to $17,499 | 2 (0.1%) | 51 (3.6%) |
| $17,500 to $19,999 | 37 (2.5%) | 16 (1.1%) |
| $20,000 to $22,499 | 0 (0.0%) | 16 (1.1%) |
| $22,500 to $24,999 | 50 (3.5%) | 33 (2.3%) |
| $25,000 to $29,999 | 30 (2.1%) | 90 (6.4%) |
| $30,000 to $34,999 | 16 (1.1%) | 177 (12.6%) |
| $35,000 to $39,999 | 38 (2.6%) | 34 (2.4%) |
| $40,000 to $44,999 | 11 (0.8%) | 29 (2.1%) |
| $45,000 to $49,999 | 66 (4.5%) | 75 (5.3%) |
| $50,000 to $54,999 | 79 (5.4%) | 174 (12.4%) |
| $55,000 to $64,999 | 241 (16.6%) | 13 (0.9%) |
| $65,000 to $74,999 | 162 (11.2%) | 43 (3.0%) |
| $75,000 to $99,999 | 314 (21.7%) | 238 (16.9%) |
| $100,000+ | 237 (16.4%) | 73 (5.2%) |
| Total | 1,449 (100.0%) | 1,408 (100.0%) |
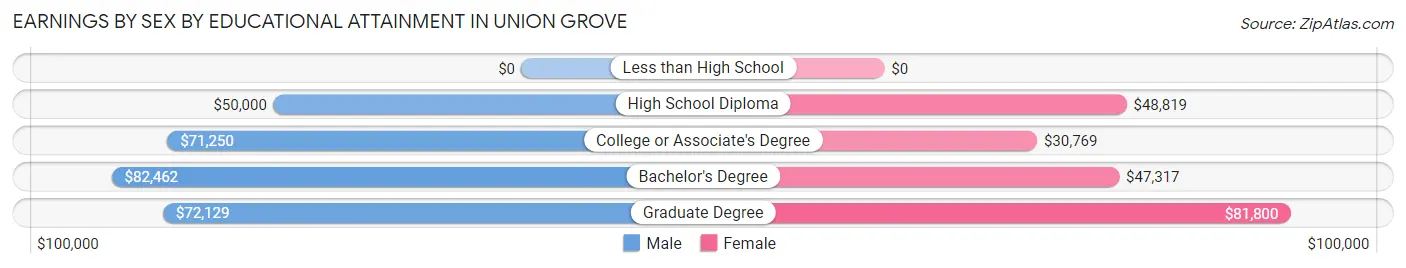
Earnings by Sex by Educational Attainment in Union Grove
Average earnings in Union Grove are $70,998 for men and $47,470 for women, a difference of 33.1%. Men with an educational attainment of bachelor's degree enjoy the highest average annual earnings of $82,462, while those with high school diploma education earn the least with $50,000. Women with an educational attainment of graduate degree earn the most with the average annual earnings of $81,800, while those with college or associate's degree education have the smallest earnings of $30,769.
| Educational Attainment | Male Income | Female Income |
| Less than High School | - | - |
| High School Diploma | $50,000 | $48,819 |
| College or Associate's Degree | $71,250 | $30,769 |
| Bachelor's Degree | $82,462 | $47,317 |
| Graduate Degree | $72,129 | $81,800 |
| Total | $70,998 | $47,470 |
Family Income in Union Grove
Family Income Brackets in Union Grove
According to the Union Grove family income data, there are 356 families falling into the $100,000 to $149,999 income range, which is the most common income bracket and makes up 28.9% of all families.
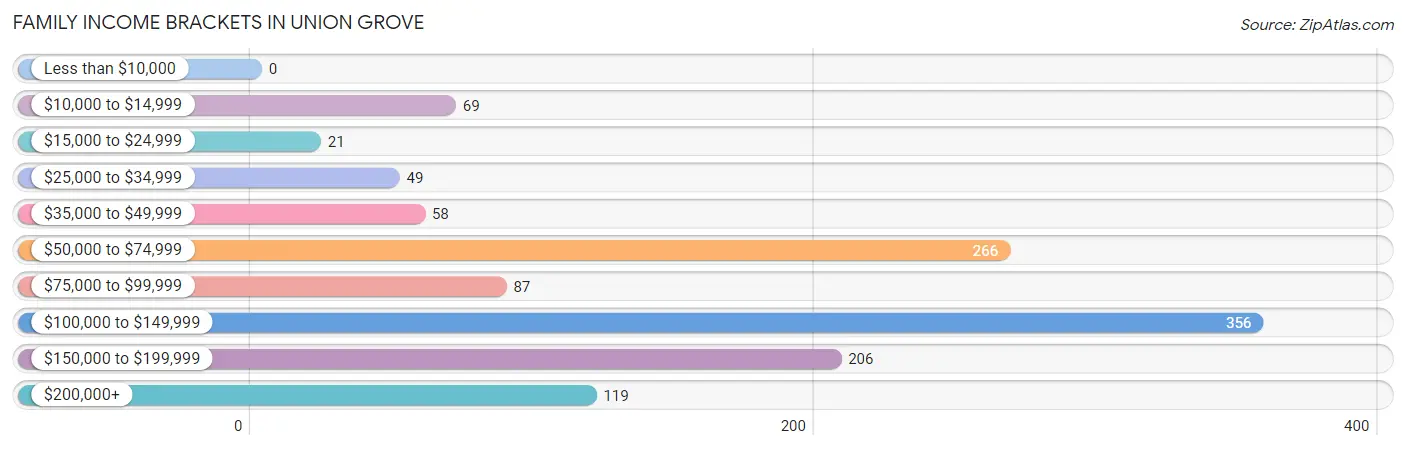
| Income Bracket | # Families | % Families |
| Less than $10,000 | 0 | 0.0% |
| $10,000 to $14,999 | 69 | 5.6% |
| $15,000 to $24,999 | 21 | 1.7% |
| $25,000 to $34,999 | 49 | 4.0% |
| $35,000 to $49,999 | 58 | 4.7% |
| $50,000 to $74,999 | 266 | 21.6% |
| $75,000 to $99,999 | 87 | 7.1% |
| $100,000 to $149,999 | 356 | 28.9% |
| $150,000 to $199,999 | 206 | 16.7% |
| $200,000+ | 119 | 9.7% |
Family Income by Famaliy Size in Union Grove
5-person families (109 | 8.8%) account for the highest median family income in Union Grove with $171,045 per family, while 3-person families (400 | 32.5%) have the highest median income of $38,042 per family member.
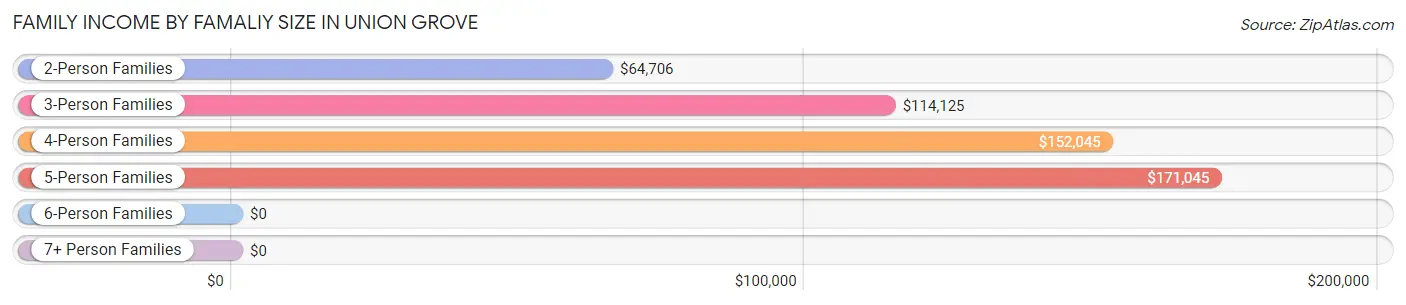
| Income Bracket | # Families | Median Income |
| 2-Person Families | 526 (42.7%) | $64,706 |
| 3-Person Families | 400 (32.5%) | $114,125 |
| 4-Person Families | 154 (12.5%) | $152,045 |
| 5-Person Families | 109 (8.8%) | $171,045 |
| 6-Person Families | 42 (3.4%) | $0 |
| 7+ Person Families | 0 (0.0%) | $0 |
| Total | 1,231 (100.0%) | $103,422 |
Family Income by Number of Earners in Union Grove
The median family income in Union Grove is $103,422, with families comprising 3+ earners (220) having the highest median family income of $146,818, while families with no earners (108) have the lowest median family income of $46,250, accounting for 17.9% and 8.8% of families, respectively.
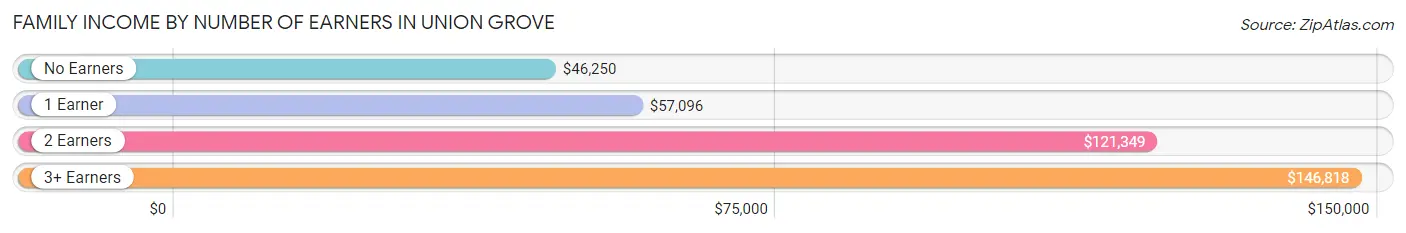
| Number of Earners | # Families | Median Income |
| No Earners | 108 (8.8%) | $46,250 |
| 1 Earner | 426 (34.6%) | $57,096 |
| 2 Earners | 477 (38.8%) | $121,349 |
| 3+ Earners | 220 (17.9%) | $146,818 |
| Total | 1,231 (100.0%) | $103,422 |
Household Income in Union Grove
Household Income Brackets in Union Grove
With 595 households falling in the category, the $100,000 to $149,999 income range is the most frequent in Union Grove, accounting for 31.9% of all households. In contrast, only 28 households (1.5%) fall into the less than $10,000 income bracket, making it the least populous group.
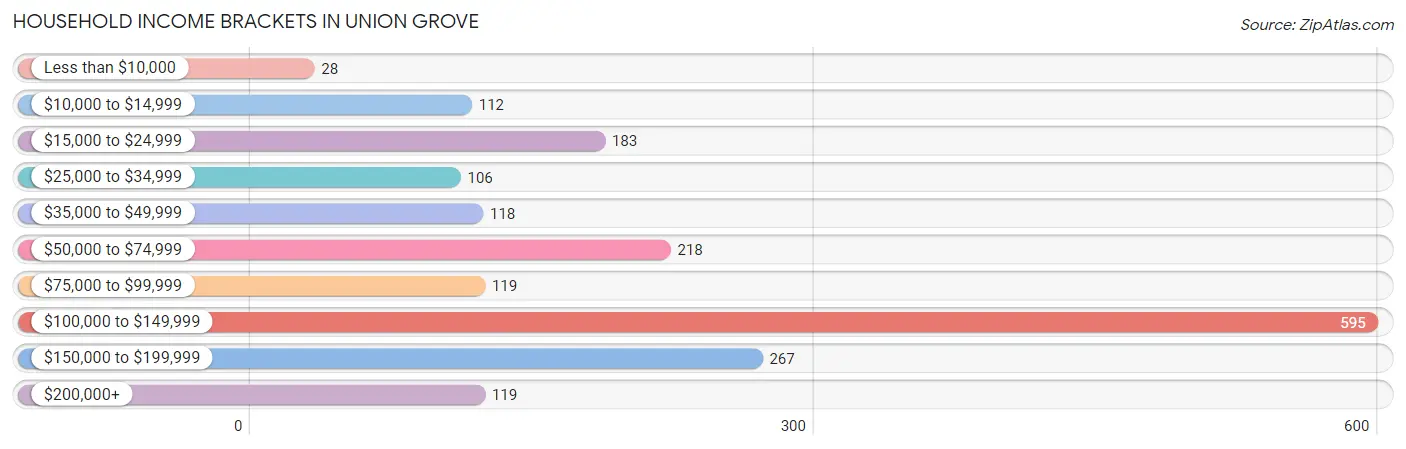
| Income Bracket | # Households | % Households |
| Less than $10,000 | 28 | 1.5% |
| $10,000 to $14,999 | 112 | 6.0% |
| $15,000 to $24,999 | 183 | 9.8% |
| $25,000 to $34,999 | 106 | 5.7% |
| $35,000 to $49,999 | 118 | 6.3% |
| $50,000 to $74,999 | 218 | 11.7% |
| $75,000 to $99,999 | 119 | 6.4% |
| $100,000 to $149,999 | 595 | 31.9% |
| $150,000 to $199,999 | 267 | 14.3% |
| $200,000+ | 119 | 6.4% |
Household Income by Householder Age in Union Grove
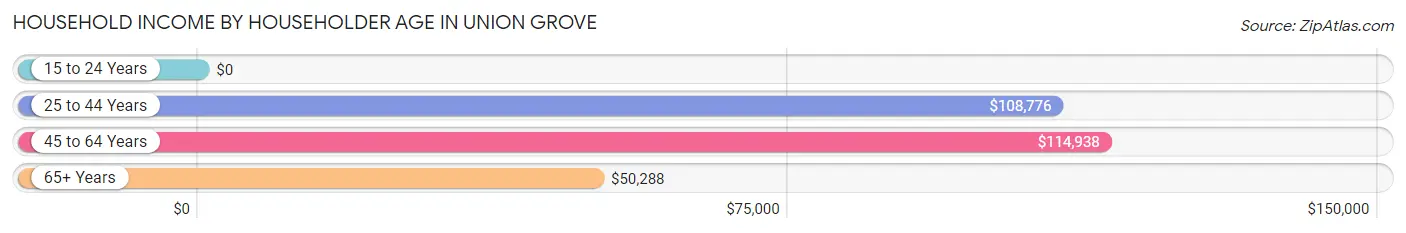
The median household income in Union Grove is $103,005, with the highest median household income of $114,938 found in the 45 to 64 years age bracket for the primary householder. A total of 577 households (30.9%) fall into this category. Meanwhile, the 15 to 24 years age bracket for the primary householder has the lowest median household income of $0, with 72 households (3.9%) in this group.
| Income Bracket | # Households | Median Income |
| 15 to 24 Years | 72 (3.9%) | $0 |
| 25 to 44 Years | 828 (44.4%) | $108,776 |
| 45 to 64 Years | 577 (30.9%) | $114,938 |
| 65+ Years | 389 (20.8%) | $50,288 |
| Total | 1,866 (100.0%) | $103,005 |
Poverty in Union Grove
Income Below Poverty by Sex and Age in Union Grove
With 8.1% poverty level for males and 10.6% for females among the residents of Union Grove, under 5 year old males and 5 year old females are the most vulnerable to poverty, with 54 males (69.2%) and 47 females (100.0%) in their respective age groups living below the poverty level.
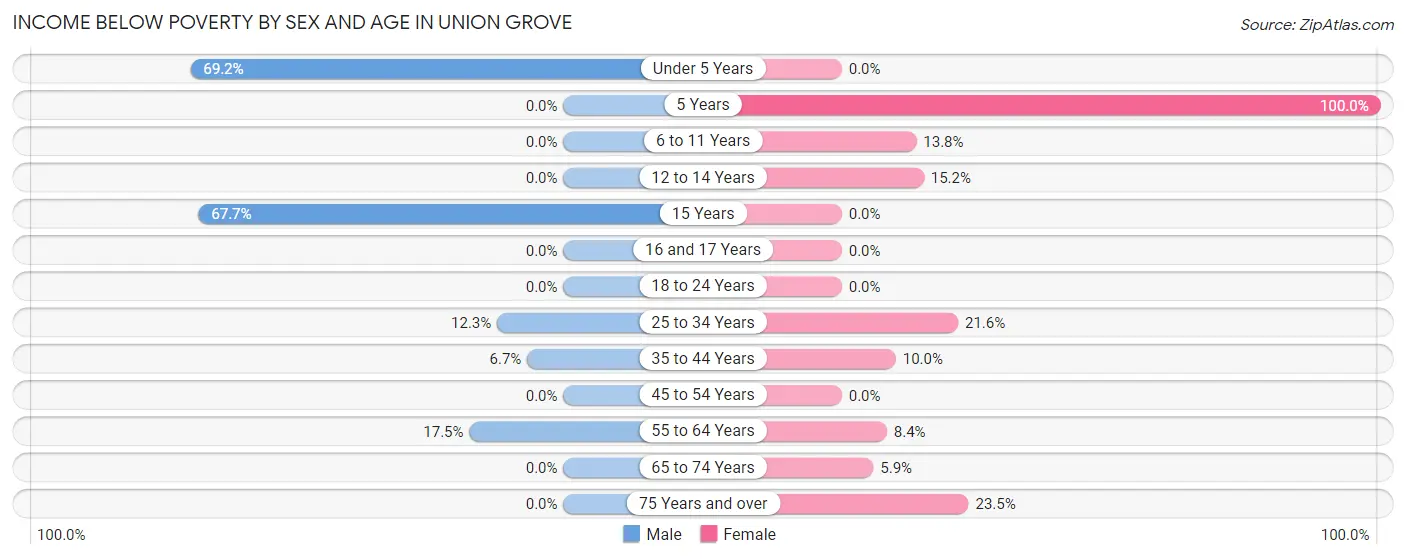
| Age Bracket | Male | Female |
| Under 5 Years | 54 (69.2%) | 0 (0.0%) |
| 5 Years | 0 (0.0%) | 47 (100.0%) |
| 6 to 11 Years | 0 (0.0%) | 22 (13.8%) |
| 12 to 14 Years | 0 (0.0%) | 21 (15.2%) |
| 15 Years | 21 (67.7%) | 0 (0.0%) |
| 16 and 17 Years | 0 (0.0%) | 0 (0.0%) |
| 18 to 24 Years | 0 (0.0%) | 0 (0.0%) |
| 25 to 34 Years | 51 (12.3%) | 71 (21.6%) |
| 35 to 44 Years | 24 (6.7%) | 35 (10.0%) |
| 45 to 54 Years | 0 (0.0%) | 0 (0.0%) |
| 55 to 64 Years | 48 (17.4%) | 21 (8.4%) |
| 65 to 74 Years | 0 (0.0%) | 13 (5.9%) |
| 75 Years and over | 0 (0.0%) | 16 (23.5%) |
| Total | 198 (8.1%) | 246 (10.6%) |
Income Above Poverty by Sex and Age in Union Grove
According to the poverty statistics in Union Grove, males aged 6 to 11 years and females aged under 5 years are the age groups that are most secure financially, with 100.0% of males and 100.0% of females in these age groups living above the poverty line.
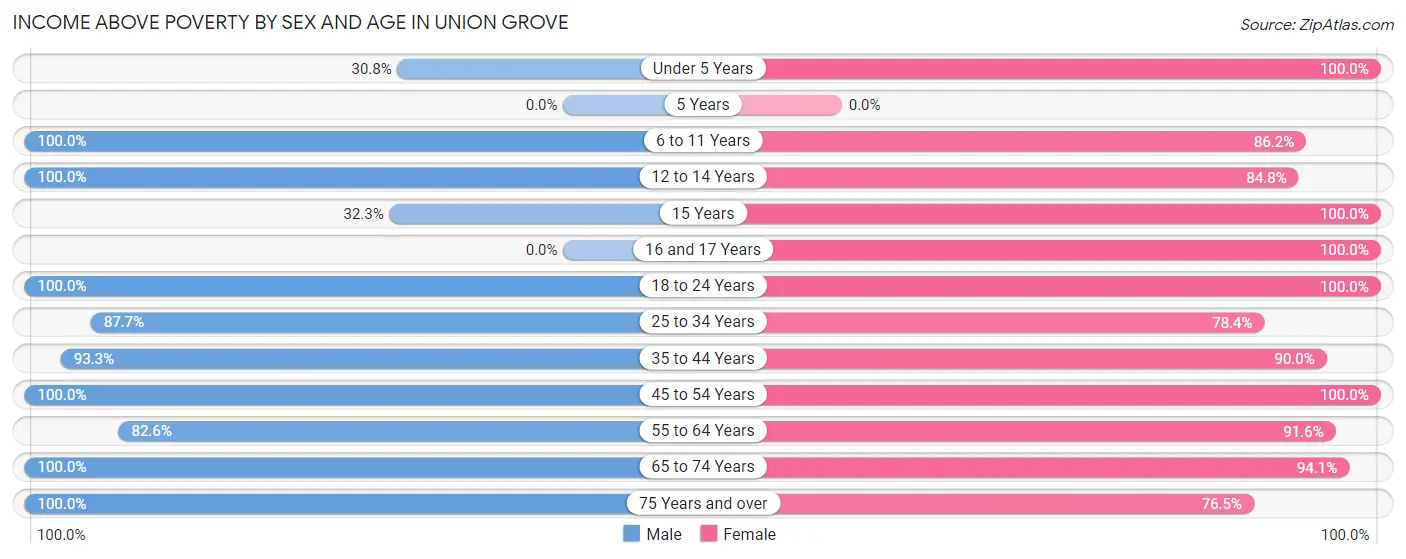
| Age Bracket | Male | Female |
| Under 5 Years | 24 (30.8%) | 82 (100.0%) |
| 5 Years | 0 (0.0%) | 0 (0.0%) |
| 6 to 11 Years | 324 (100.0%) | 137 (86.2%) |
| 12 to 14 Years | 176 (100.0%) | 117 (84.8%) |
| 15 Years | 10 (32.3%) | 100 (100.0%) |
| 16 and 17 Years | 0 (0.0%) | 26 (100.0%) |
| 18 to 24 Years | 201 (100.0%) | 275 (100.0%) |
| 25 to 34 Years | 364 (87.7%) | 258 (78.4%) |
| 35 to 44 Years | 333 (93.3%) | 314 (90.0%) |
| 45 to 54 Years | 306 (100.0%) | 284 (100.0%) |
| 55 to 64 Years | 227 (82.6%) | 230 (91.6%) |
| 65 to 74 Years | 176 (100.0%) | 209 (94.1%) |
| 75 Years and over | 116 (100.0%) | 52 (76.5%) |
| Total | 2,257 (91.9%) | 2,084 (89.4%) |
Income Below Poverty Among Married-Couple Families in Union Grove
The poverty statistics for married-couple families in Union Grove show that 2.4% or 21 of the total 861 families live below the poverty line. Families with 3 or 4 children have the highest poverty rate of 29.6%, comprising of 21 families. On the other hand, families with no children have the lowest poverty rate of 0.0%, which includes 0 families.
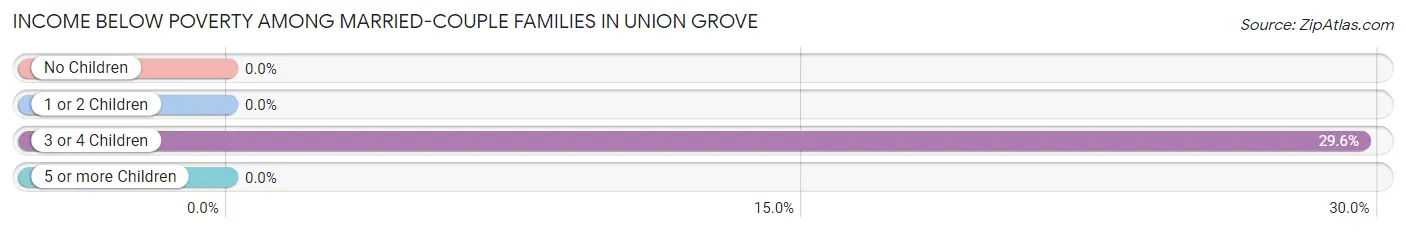
| Children | Above Poverty | Below Poverty |
| No Children | 555 (100.0%) | 0 (0.0%) |
| 1 or 2 Children | 235 (100.0%) | 0 (0.0%) |
| 3 or 4 Children | 50 (70.4%) | 21 (29.6%) |
| 5 or more Children | 0 (0.0%) | 0 (0.0%) |
| Total | 840 (97.6%) | 21 (2.4%) |
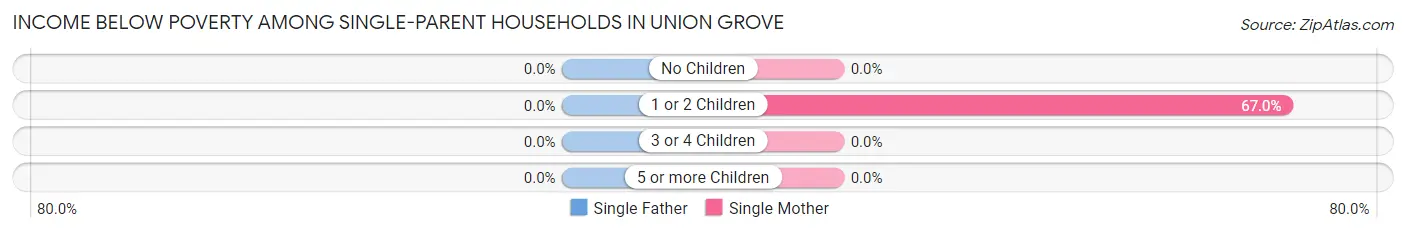
Income Below Poverty Among Single-Parent Households in Union Grove
| Children | Single Father | Single Mother |
| No Children | 0 (0.0%) | 0 (0.0%) |
| 1 or 2 Children | 0 (0.0%) | 69 (67.0%) |
| 3 or 4 Children | 0 (0.0%) | 0 (0.0%) |
| 5 or more Children | 0 (0.0%) | 0 (0.0%) |
| Total | 0 (0.0%) | 69 (62.2%) |
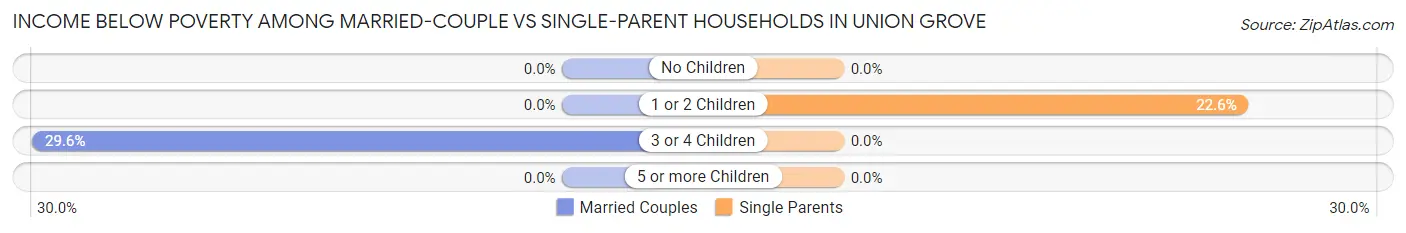
Income Below Poverty Among Married-Couple vs Single-Parent Households in Union Grove
The poverty data for Union Grove shows that 21 of the married-couple family households (2.4%) and 69 of the single-parent households (18.6%) are living below the poverty level. Within the married-couple family households, those with 3 or 4 children have the highest poverty rate, with 21 households (29.6%) falling below the poverty line. Among the single-parent households, those with 1 or 2 children have the highest poverty rate, with 69 household (22.6%) living below poverty.
| Children | Married-Couple Families | Single-Parent Households |
| No Children | 0 (0.0%) | 0 (0.0%) |
| 1 or 2 Children | 0 (0.0%) | 69 (22.6%) |
| 3 or 4 Children | 21 (29.6%) | 0 (0.0%) |
| 5 or more Children | 0 (0.0%) | 0 (0.0%) |
| Total | 21 (2.4%) | 69 (18.6%) |
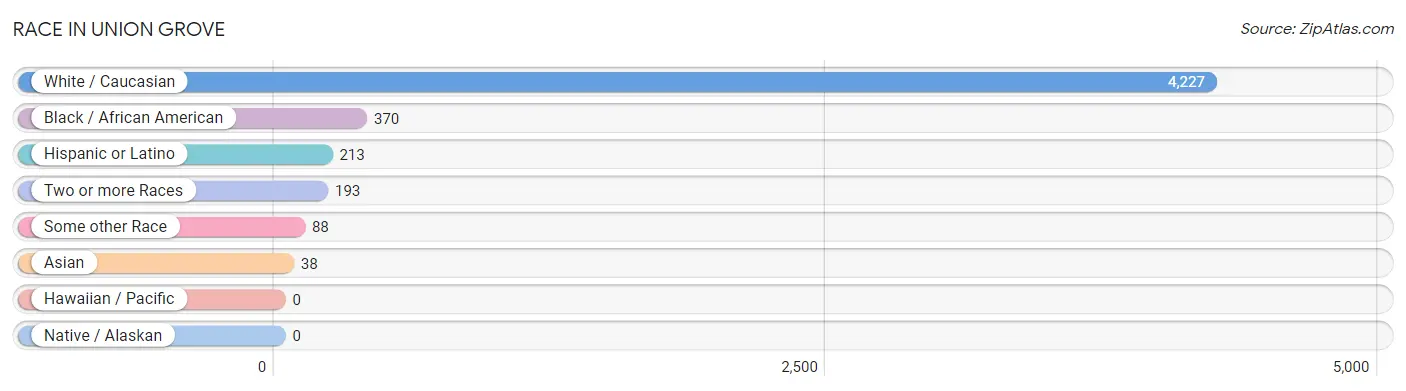
Race in Union Grove
The most populous races in Union Grove are White / Caucasian (4,227 | 86.0%), Black / African American (370 | 7.5%), and Hispanic or Latino (213 | 4.3%).
| Race | # Population | % Population |
| Asian | 38 | 0.8% |
| Black / African American | 370 | 7.5% |
| Hawaiian / Pacific | 0 | 0.0% |
| Hispanic or Latino | 213 | 4.3% |
| Native / Alaskan | 0 | 0.0% |
| White / Caucasian | 4,227 | 86.0% |
| Two or more Races | 193 | 3.9% |
| Some other Race | 88 | 1.8% |
| Total | 4,916 | 100.0% |
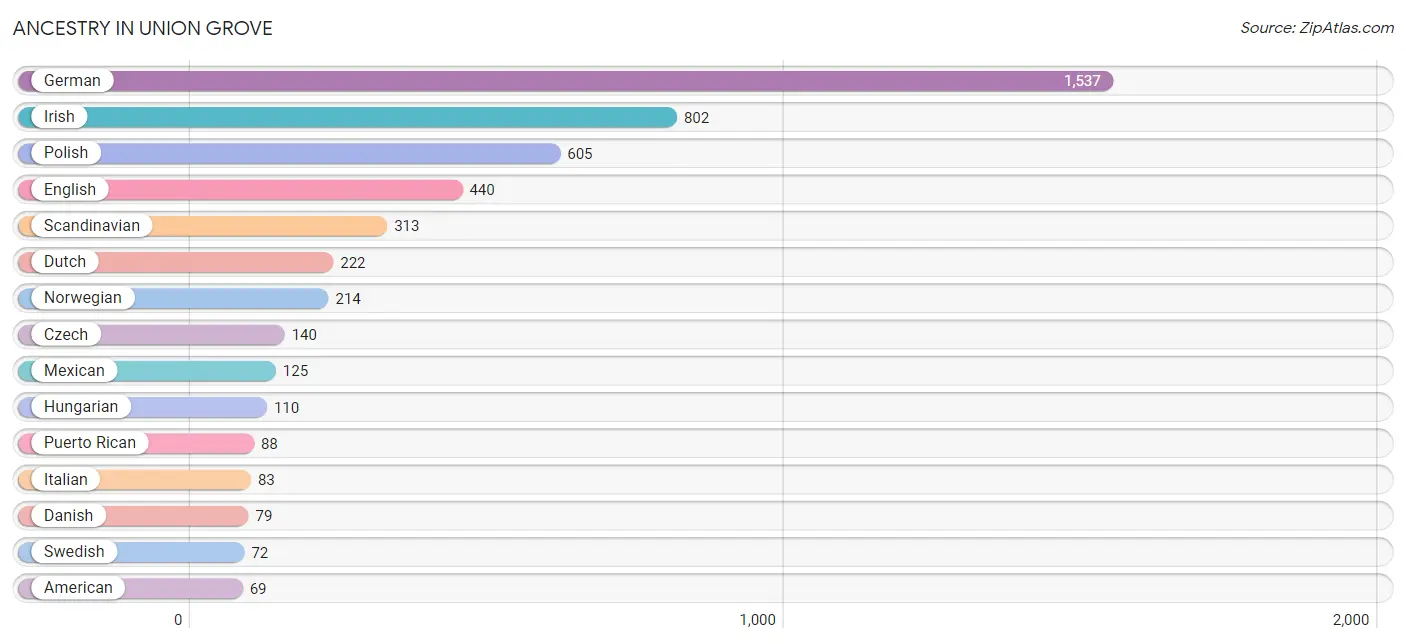
Ancestry in Union Grove
The most populous ancestries reported in Union Grove are German (1,537 | 31.3%), Irish (802 | 16.3%), Polish (605 | 12.3%), English (440 | 8.9%), and Scandinavian (313 | 6.4%), together accounting for 75.2% of all Union Grove residents.
| Ancestry | # Population | % Population |
| Alsatian | 16 | 0.3% |
| American | 69 | 1.4% |
| Armenian | 16 | 0.3% |
| Belgian | 24 | 0.5% |
| British | 13 | 0.3% |
| Burmese | 2 | 0.0% |
| Celtic | 21 | 0.4% |
| Cherokee | 21 | 0.4% |
| Chippewa | 8 | 0.2% |
| Czech | 140 | 2.9% |
| Danish | 79 | 1.6% |
| Dutch | 222 | 4.5% |
| Eastern European | 48 | 1.0% |
| English | 440 | 8.9% |
| Ethiopian | 2 | 0.0% |
| French | 52 | 1.1% |
| French Canadian | 21 | 0.4% |
| German | 1,537 | 31.3% |
| Greek | 8 | 0.2% |
| Hungarian | 110 | 2.2% |
| Indian (Asian) | 36 | 0.7% |
| Irish | 802 | 16.3% |
| Italian | 83 | 1.7% |
| Laotian | 20 | 0.4% |
| Lithuanian | 13 | 0.3% |
| Luxembourger | 23 | 0.5% |
| Mexican | 125 | 2.5% |
| Norwegian | 214 | 4.3% |
| Polish | 605 | 12.3% |
| Puerto Rican | 88 | 1.8% |
| Russian | 4 | 0.1% |
| Scandinavian | 313 | 6.4% |
| Slovak | 16 | 0.3% |
| Slovene | 20 | 0.4% |
| Subsaharan African | 2 | 0.0% |
| Swedish | 72 | 1.5% |
| Swiss | 17 | 0.4% |
| Welsh | 41 | 0.8% |
| Yugoslavian | 43 | 0.9% | View All 39 Rows |
Immigrants in Union Grove
The most numerous immigrant groups reported in Union Grove came from Europe (171 | 3.5%), Ireland (147 | 3.0%), Northern Europe (147 | 3.0%), Asia (36 | 0.7%), and China (23 | 0.5%), together accounting for 10.7% of all Union Grove residents.
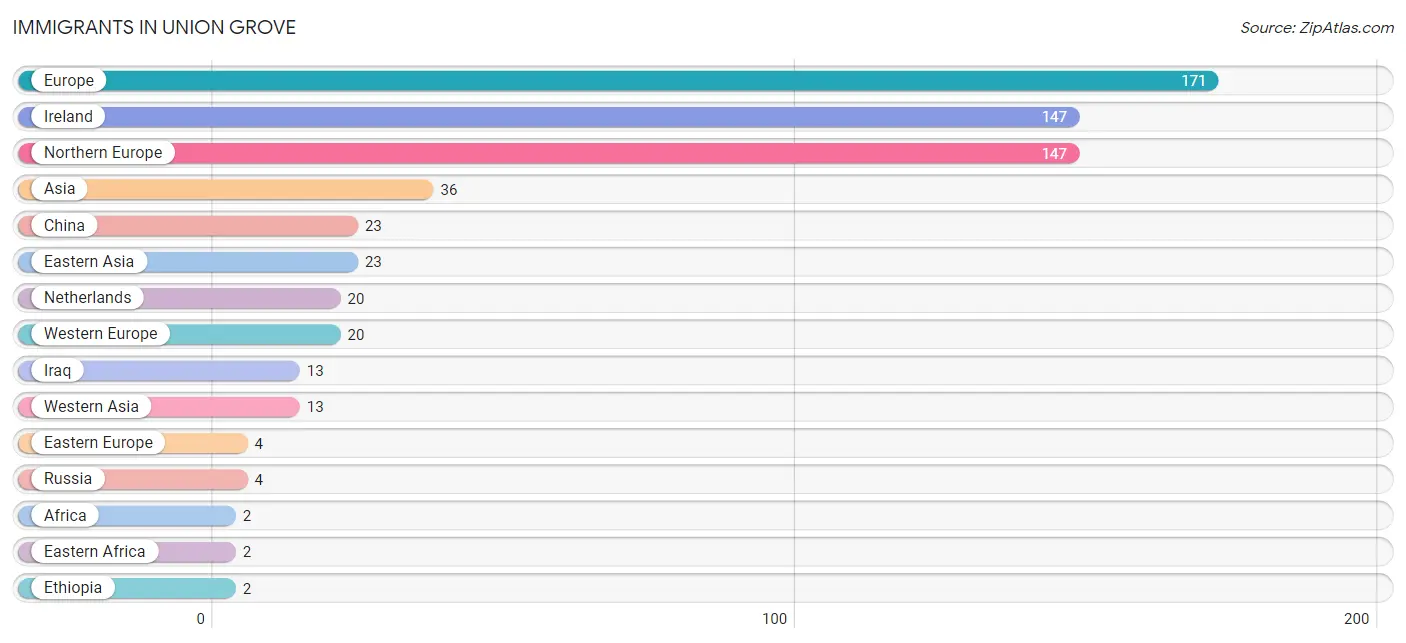
| Immigration Origin | # Population | % Population |
| Africa | 2 | 0.0% |
| Asia | 36 | 0.7% |
| China | 23 | 0.5% |
| Eastern Africa | 2 | 0.0% |
| Eastern Asia | 23 | 0.5% |
| Eastern Europe | 4 | 0.1% |
| Ethiopia | 2 | 0.0% |
| Europe | 171 | 3.5% |
| Iraq | 13 | 0.3% |
| Ireland | 147 | 3.0% |
| Netherlands | 20 | 0.4% |
| Northern Europe | 147 | 3.0% |
| Russia | 4 | 0.1% |
| Western Asia | 13 | 0.3% |
| Western Europe | 20 | 0.4% | View All 15 Rows |
Sex and Age in Union Grove
Sex and Age in Union Grove
The most populous age groups in Union Grove are 25 to 29 Years (359 | 14.3%) for men and 40 to 44 Years (268 | 11.2%) for women.
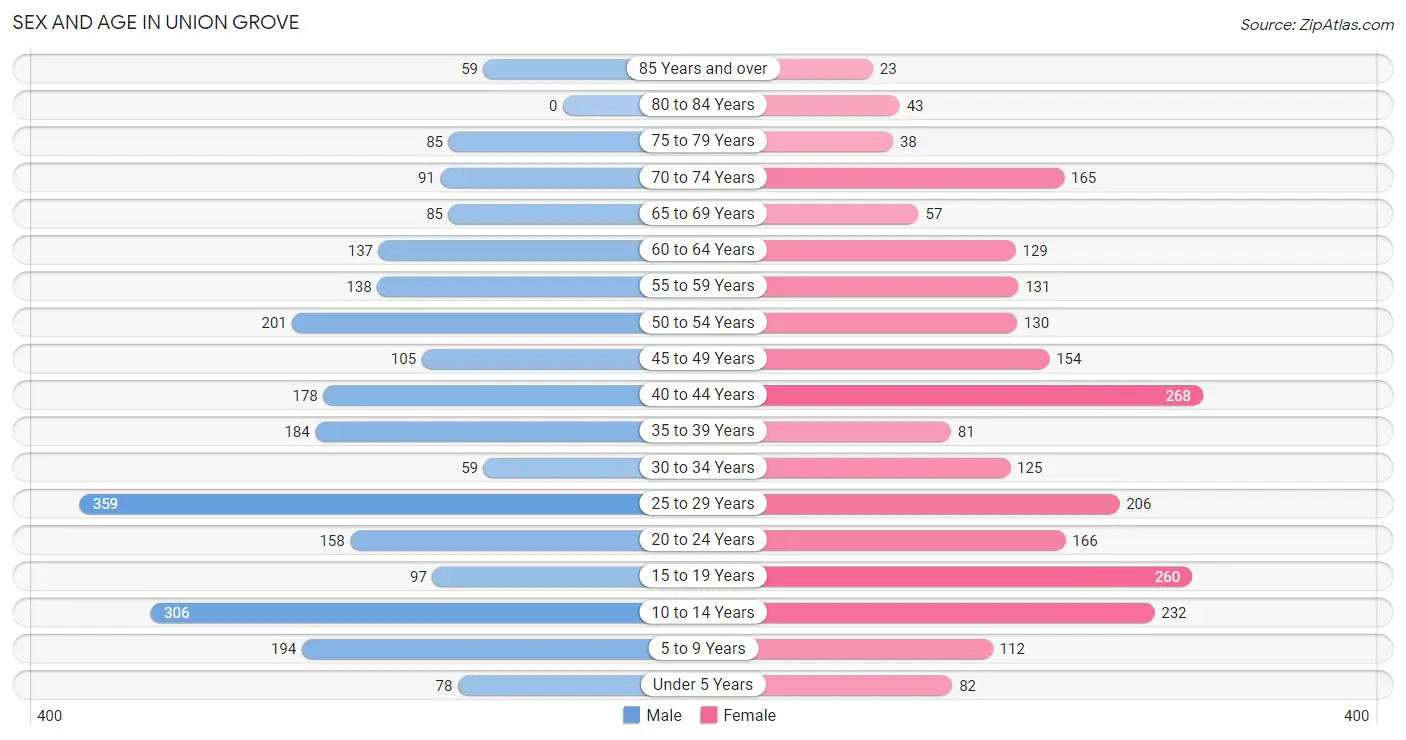
| Age Bracket | Male | Female |
| Under 5 Years | 78 (3.1%) | 82 (3.4%) |
| 5 to 9 Years | 194 (7.7%) | 112 (4.7%) |
| 10 to 14 Years | 306 (12.2%) | 232 (9.7%) |
| 15 to 19 Years | 97 (3.9%) | 260 (10.8%) |
| 20 to 24 Years | 158 (6.3%) | 166 (6.9%) |
| 25 to 29 Years | 359 (14.3%) | 206 (8.6%) |
| 30 to 34 Years | 59 (2.4%) | 125 (5.2%) |
| 35 to 39 Years | 184 (7.3%) | 81 (3.4%) |
| 40 to 44 Years | 178 (7.1%) | 268 (11.2%) |
| 45 to 49 Years | 105 (4.2%) | 154 (6.4%) |
| 50 to 54 Years | 201 (8.0%) | 130 (5.4%) |
| 55 to 59 Years | 138 (5.5%) | 131 (5.4%) |
| 60 to 64 Years | 137 (5.4%) | 129 (5.4%) |
| 65 to 69 Years | 85 (3.4%) | 57 (2.4%) |
| 70 to 74 Years | 91 (3.6%) | 165 (6.9%) |
| 75 to 79 Years | 85 (3.4%) | 38 (1.6%) |
| 80 to 84 Years | 0 (0.0%) | 43 (1.8%) |
| 85 Years and over | 59 (2.4%) | 23 (1.0%) |
| Total | 2,514 (100.0%) | 2,402 (100.0%) |
Families and Households in Union Grove
Median Family Size in Union Grove
The median family size in Union Grove is 3.08 persons per family, with married-couple families (861 | 69.9%) accounting for the largest median family size of 3.36 persons per family. On the other hand, single female/mother families (111 | 9.0%) represent the smallest median family size with 2.43 persons per family.
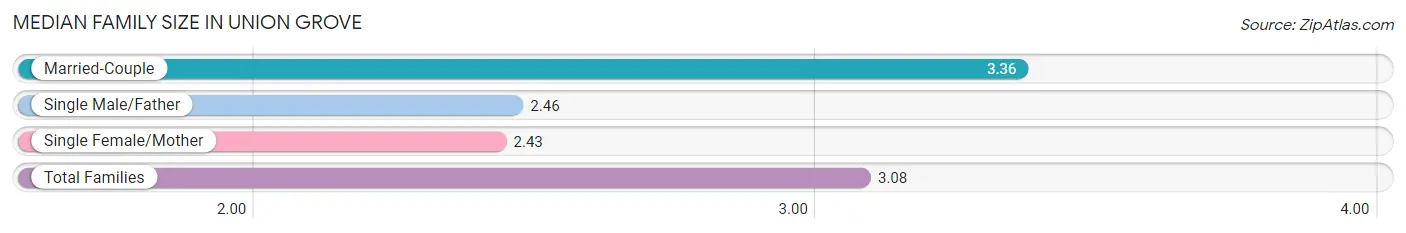
| Family Type | # Families | Family Size |
| Married-Couple | 861 (69.9%) | 3.36 |
| Single Male/Father | 259 (21.0%) | 2.46 |
| Single Female/Mother | 111 (9.0%) | 2.43 |
| Total Families | 1,231 (100.0%) | 3.08 |
Median Household Size in Union Grove
The median household size in Union Grove is 2.56 persons per household, with married-couple households (861 | 46.1%) accounting for the largest median household size of 3.38 persons per household. non-family households (635 | 34.0%) represent the smallest median household size with 1.27 persons per household.
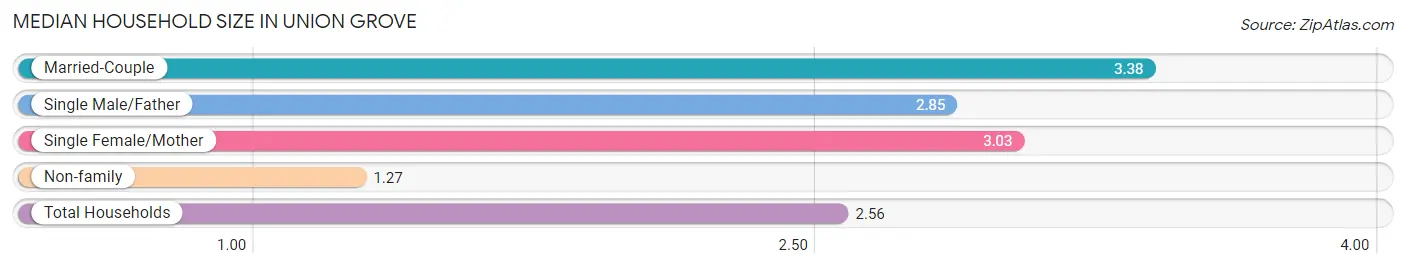
| Household Type | # Households | Household Size |
| Married-Couple | 861 (46.1%) | 3.38 |
| Single Male/Father | 259 (13.9%) | 2.85 |
| Single Female/Mother | 111 (5.9%) | 3.03 |
| Non-family | 635 (34.0%) | 1.27 |
| Total Households | 1,866 (100.0%) | 2.56 |
Household Size by Marriage Status in Union Grove
Out of a total of 1,866 households in Union Grove, 1,231 (66.0%) are family households, while 635 (34.0%) are nonfamily households. The most numerous type of family households are 3-person households, comprising 466, and the most common type of nonfamily households are 1-person households, comprising 517.
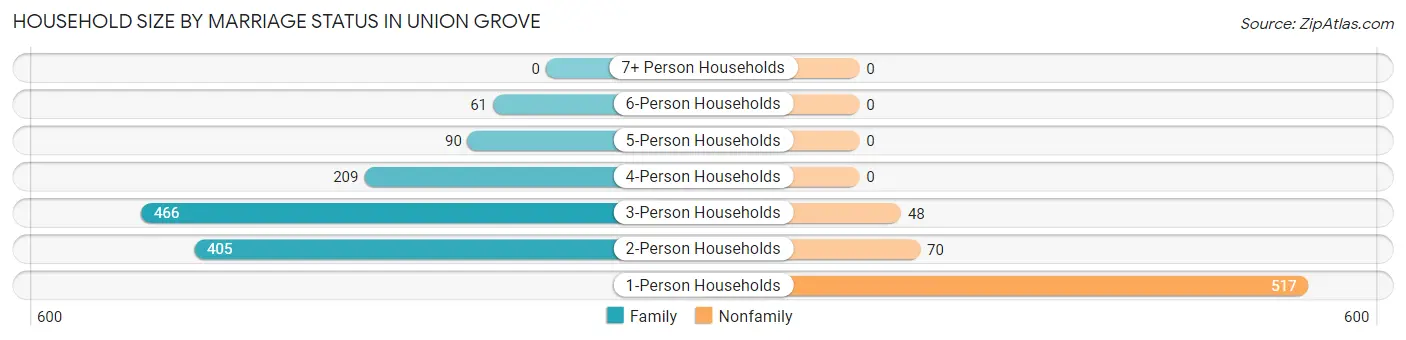
| Household Size | Family Households | Nonfamily Households |
| 1-Person Households | - | 517 (27.7%) |
| 2-Person Households | 405 (21.7%) | 70 (3.7%) |
| 3-Person Households | 466 (25.0%) | 48 (2.6%) |
| 4-Person Households | 209 (11.2%) | 0 (0.0%) |
| 5-Person Households | 90 (4.8%) | 0 (0.0%) |
| 6-Person Households | 61 (3.3%) | 0 (0.0%) |
| 7+ Person Households | 0 (0.0%) | 0 (0.0%) |
| Total | 1,231 (66.0%) | 635 (34.0%) |
Female Fertility in Union Grove
Fertility by Age in Union Grove
Average fertility rate in Union Grove is 34.0 births per 1,000 women. Women in the age bracket of 35 to 50 years have the highest fertility rate with 82.0 births per 1,000 women. Women in the age bracket of 35 to 50 years acount for 100.0% of all women with births.
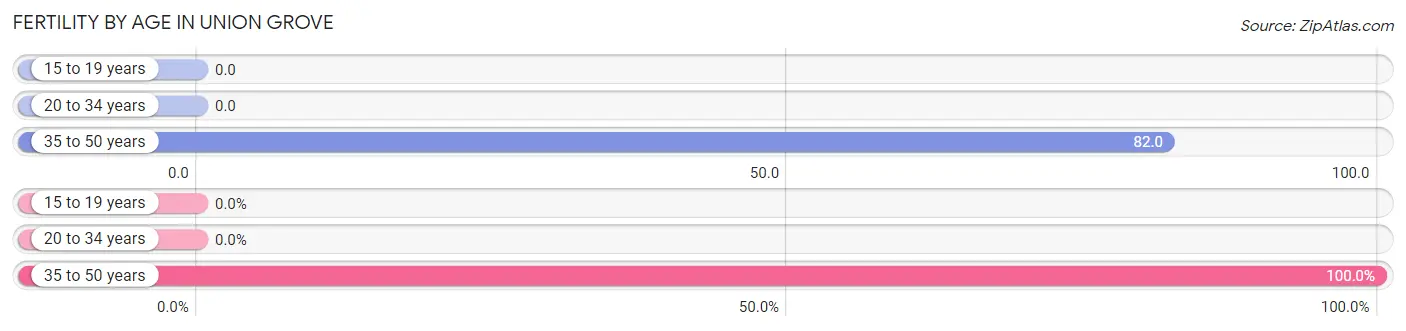
| Age Bracket | Women with Births | Births / 1,000 Women |
| 15 to 19 years | 0 (0.0%) | 0.0 |
| 20 to 34 years | 0 (0.0%) | 0.0 |
| 35 to 50 years | 43 (100.0%) | 82.0 |
| Total | 43 (100.0%) | 34.0 |
Fertility by Age by Marriage Status in Union Grove
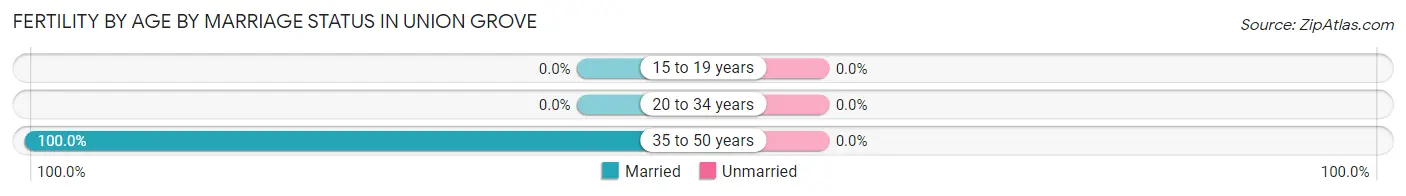
| Age Bracket | Married | Unmarried |
| 15 to 19 years | 0 (0.0%) | 0 (0.0%) |
| 20 to 34 years | 0 (0.0%) | 0 (0.0%) |
| 35 to 50 years | 43 (100.0%) | 0 (0.0%) |
| Total | 43 (100.0%) | 0 (0.0%) |
Fertility by Education in Union Grove
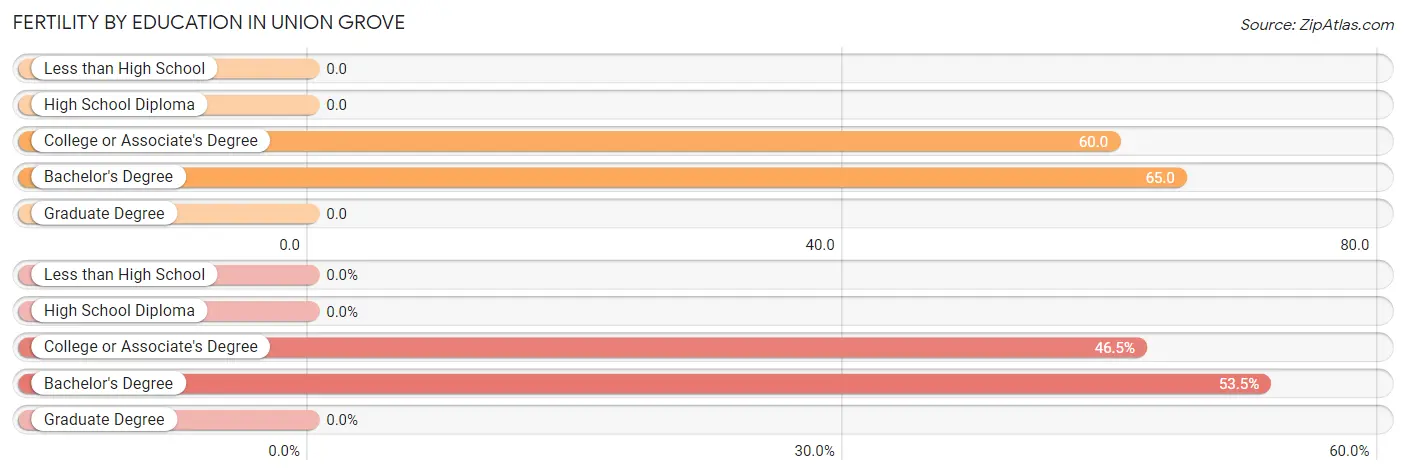
| Educational Attainment | Women with Births | Births / 1,000 Women |
| Less than High School | 0 (0.0%) | 0.0 |
| High School Diploma | 0 (0.0%) | 0.0 |
| College or Associate's Degree | 20 (46.5%) | 60.0 |
| Bachelor's Degree | 23 (53.5%) | 65.0 |
| Graduate Degree | 0 (0.0%) | 0.0 |
| Total | 43 (100.0%) | 34.0 |
Fertility by Education by Marriage Status in Union Grove
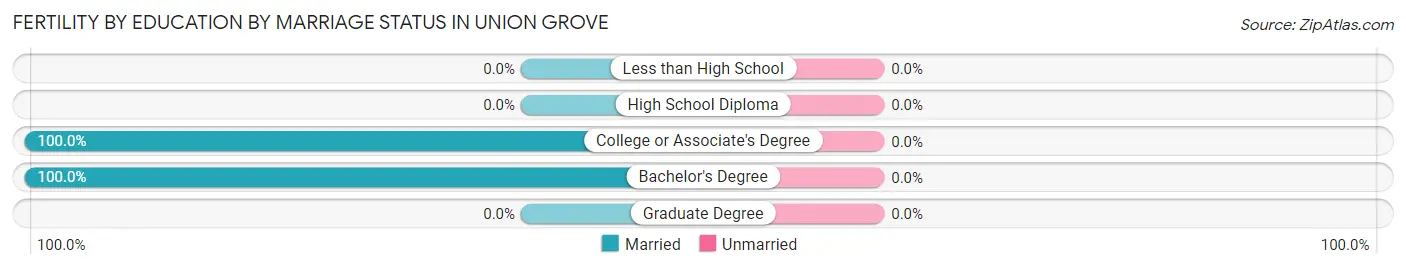
| Educational Attainment | Married | Unmarried |
| Less than High School | 0 (0.0%) | 0 (0.0%) |
| High School Diploma | 0 (0.0%) | 0 (0.0%) |
| College or Associate's Degree | 20 (100.0%) | 0 (0.0%) |
| Bachelor's Degree | 23 (100.0%) | 0 (0.0%) |
| Graduate Degree | 0 (0.0%) | 0 (0.0%) |
| Total | 43 (100.0%) | 0 (0.0%) |
Employment Characteristics in Union Grove
Employment by Class of Employer in Union Grove
Among the 2,539 employed individuals in Union Grove, private company employees (1,510 | 59.5%), local government employees (285 | 11.2%), and not-for-profit organizations (251 | 9.9%) make up the most common classes of employment.
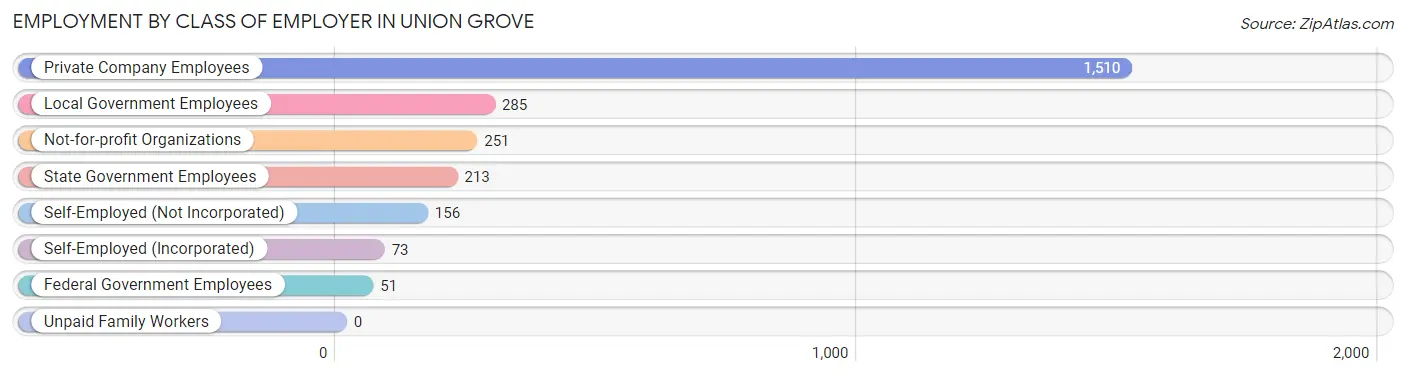
| Employer Class | # Employees | % Employees |
| Private Company Employees | 1,510 | 59.5% |
| Self-Employed (Incorporated) | 73 | 2.9% |
| Self-Employed (Not Incorporated) | 156 | 6.1% |
| Not-for-profit Organizations | 251 | 9.9% |
| Local Government Employees | 285 | 11.2% |
| State Government Employees | 213 | 8.4% |
| Federal Government Employees | 51 | 2.0% |
| Unpaid Family Workers | 0 | 0.0% |
| Total | 2,539 | 100.0% |
Employment Status by Age in Union Grove
According to the labor force statistics for Union Grove, out of the total population over 16 years of age (3,776), 71.3% or 2,692 individuals are in the labor force, with 1.4% or 38 of them unemployed. The age group with the highest labor force participation rate is 45 to 54 years, with 94.4% or 557 individuals in the labor force. Within the labor force, the 55 to 59 years age range has the highest percentage of unemployed individuals, with 9.5% or 18 of them being unemployed.
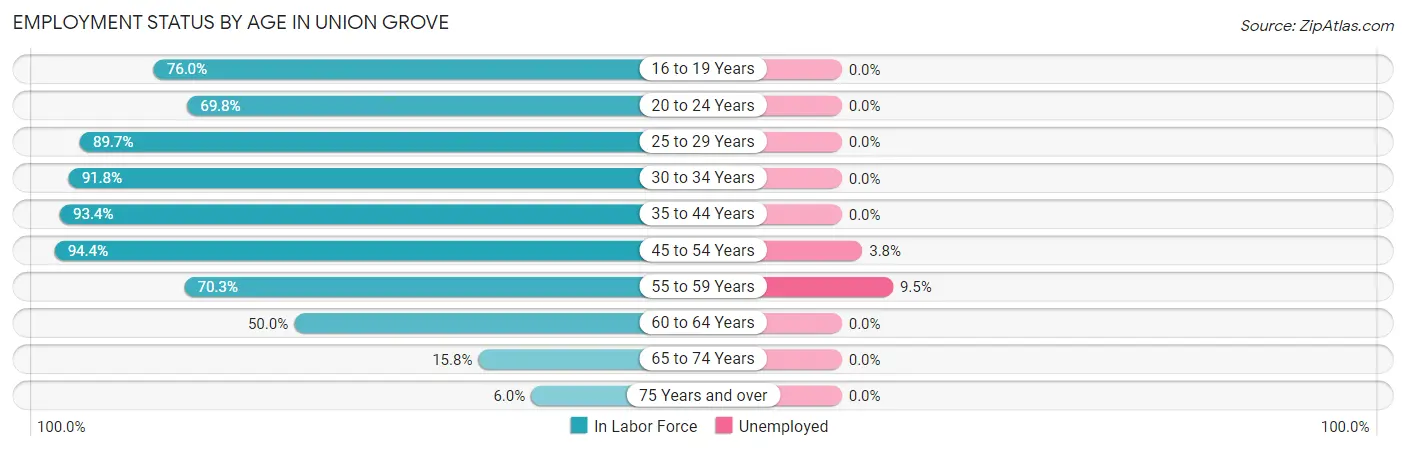
| Age Bracket | In Labor Force | Unemployed |
| 16 to 19 Years | 168 (76.0%) | 0 (0.0%) |
| 20 to 24 Years | 226 (69.8%) | 0 (0.0%) |
| 25 to 29 Years | 507 (89.7%) | 0 (0.0%) |
| 30 to 34 Years | 169 (91.8%) | 0 (0.0%) |
| 35 to 44 Years | 664 (93.4%) | 0 (0.0%) |
| 45 to 54 Years | 557 (94.4%) | 21 (3.8%) |
| 55 to 59 Years | 189 (70.3%) | 18 (9.5%) |
| 60 to 64 Years | 133 (50.0%) | 0 (0.0%) |
| 65 to 74 Years | 63 (15.8%) | 0 (0.0%) |
| 75 Years and over | 15 (6.0%) | 0 (0.0%) |
| Total | 2,692 (71.3%) | 38 (1.4%) |
Employment Status by Educational Attainment in Union Grove
According to labor force statistics for Union Grove, 85.8% of individuals (2,218) out of the total population between 25 and 64 years of age (2,585) are in the labor force, with 1.8% or 40 of them being unemployed. The group with the highest labor force participation rate are those with the educational attainment of college / associate degree, with 94.0% or 942 individuals in the labor force. Within the labor force, individuals with high school diploma education have the highest percentage of unemployment, with 16.3% or 39 of them being unemployed.
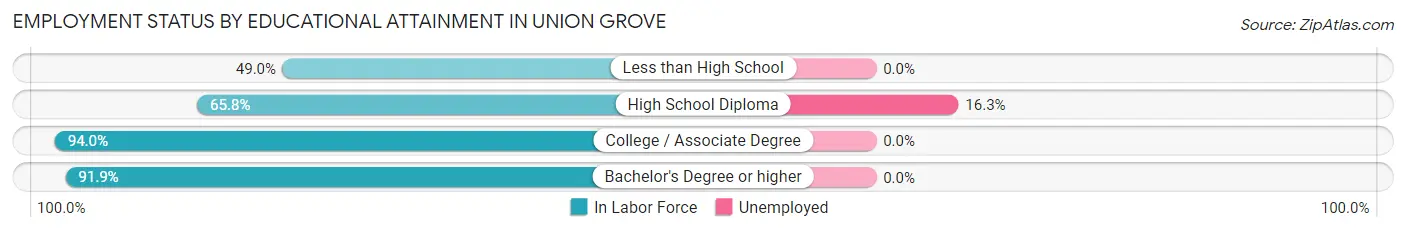
| Educational Attainment | In Labor Force | Unemployed |
| Less than High School | 95 (49.0%) | 0 (0.0%) |
| High School Diploma | 239 (65.8%) | 59 (16.3%) |
| College / Associate Degree | 942 (94.0%) | 0 (0.0%) |
| Bachelor's Degree or higher | 943 (91.9%) | 0 (0.0%) |
| Total | 2,218 (85.8%) | 47 (1.8%) |
Employment Occupations by Sex in Union Grove
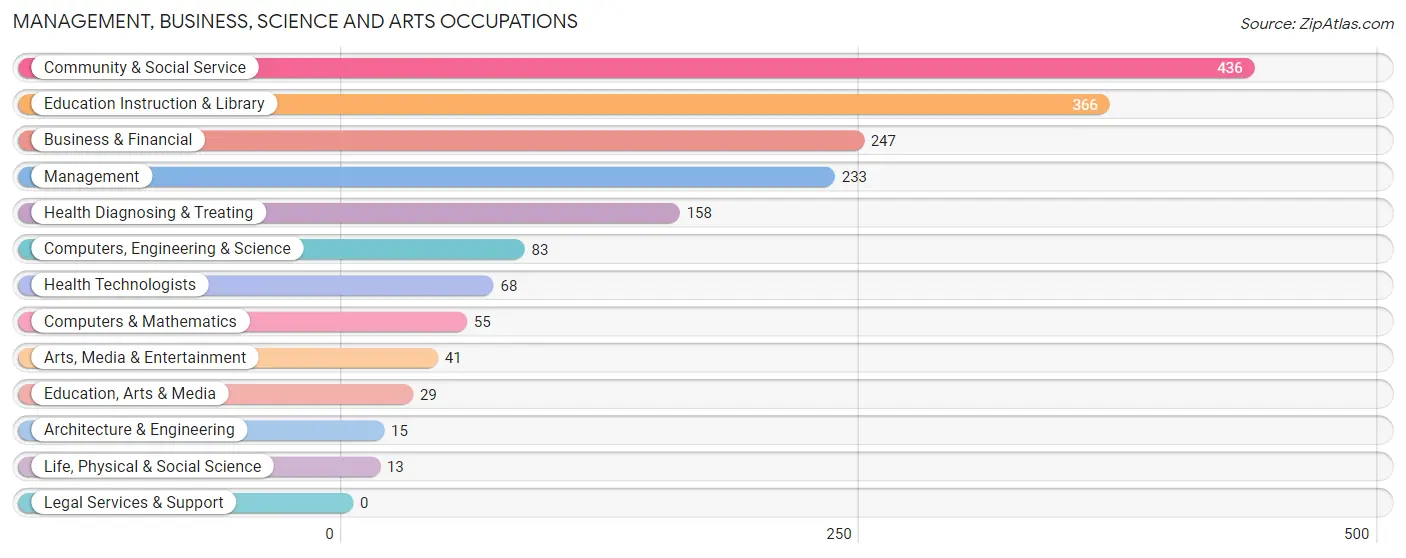
Management, Business, Science and Arts Occupations
The most common Management, Business, Science and Arts occupations in Union Grove are Community & Social Service (436 | 16.4%), Education Instruction & Library (366 | 13.8%), Business & Financial (247 | 9.3%), Management (233 | 8.8%), and Health Diagnosing & Treating (158 | 6.0%).
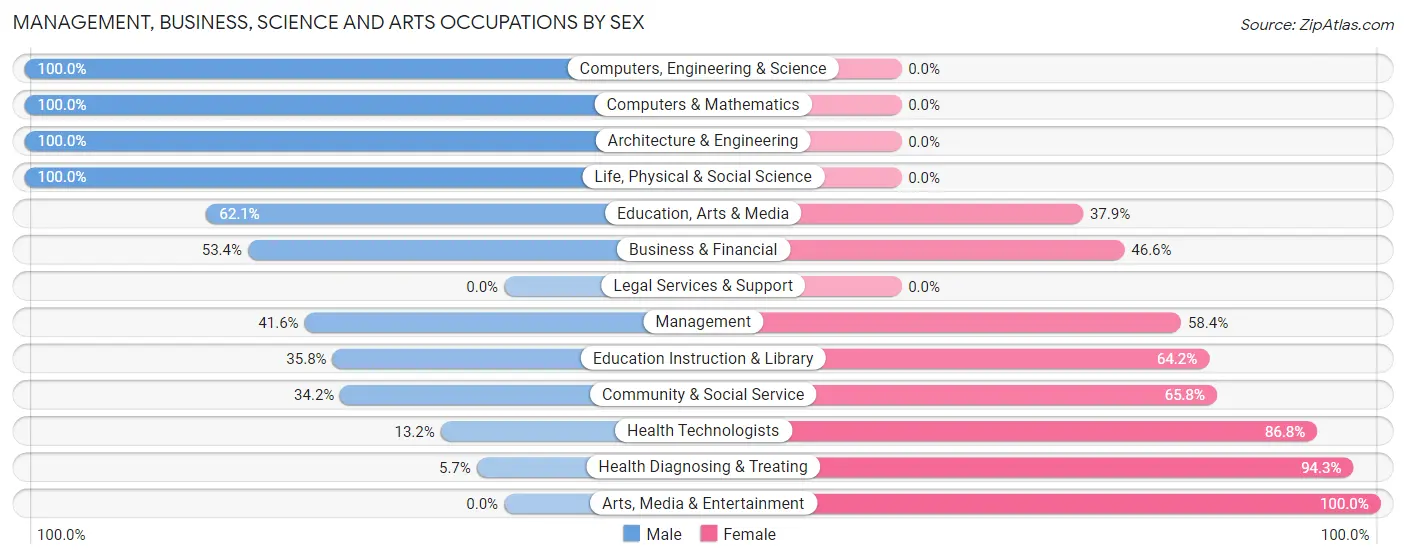
Management, Business, Science and Arts Occupations by Sex
Within the Management, Business, Science and Arts occupations in Union Grove, the most male-oriented occupations are Computers, Engineering & Science (100.0%), Computers & Mathematics (100.0%), and Architecture & Engineering (100.0%), while the most female-oriented occupations are Arts, Media & Entertainment (100.0%), Health Diagnosing & Treating (94.3%), and Health Technologists (86.8%).
| Occupation | Male | Female |
| Management | 97 (41.6%) | 136 (58.4%) |
| Business & Financial | 132 (53.4%) | 115 (46.6%) |
| Computers, Engineering & Science | 83 (100.0%) | 0 (0.0%) |
| Computers & Mathematics | 55 (100.0%) | 0 (0.0%) |
| Architecture & Engineering | 15 (100.0%) | 0 (0.0%) |
| Life, Physical & Social Science | 13 (100.0%) | 0 (0.0%) |
| Community & Social Service | 149 (34.2%) | 287 (65.8%) |
| Education, Arts & Media | 18 (62.1%) | 11 (37.9%) |
| Legal Services & Support | 0 (0.0%) | 0 (0.0%) |
| Education Instruction & Library | 131 (35.8%) | 235 (64.2%) |
| Arts, Media & Entertainment | 0 (0.0%) | 41 (100.0%) |
| Health Diagnosing & Treating | 9 (5.7%) | 149 (94.3%) |
| Health Technologists | 9 (13.2%) | 59 (86.8%) |
| Total (Category) | 470 (40.6%) | 687 (59.4%) |
| Total (Overall) | 1,362 (51.4%) | 1,290 (48.6%) |
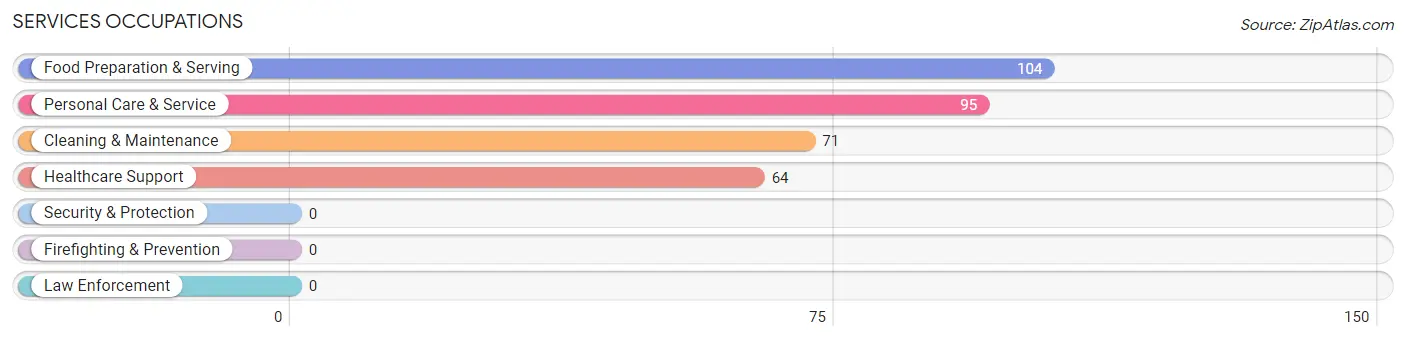
Services Occupations
The most common Services occupations in Union Grove are Food Preparation & Serving (104 | 3.9%), Personal Care & Service (95 | 3.6%), Cleaning & Maintenance (71 | 2.7%), and Healthcare Support (64 | 2.4%).
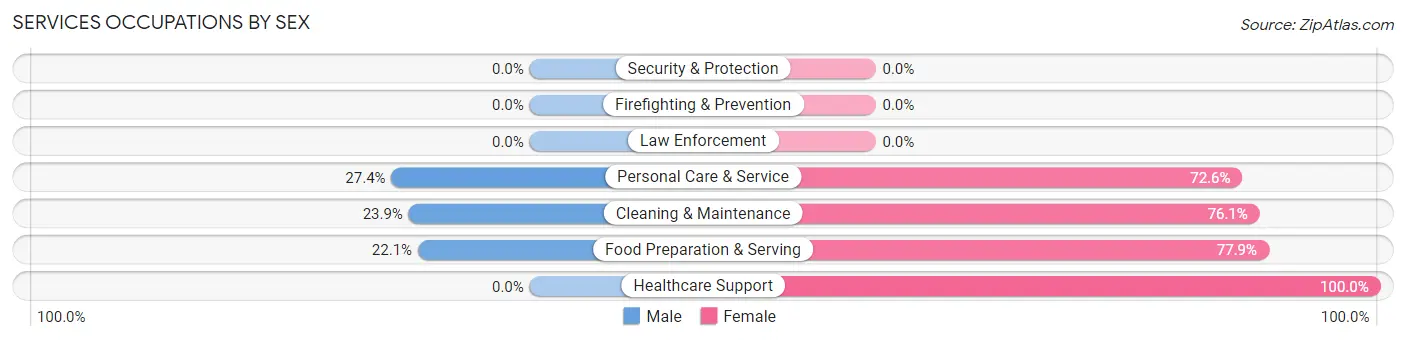
Services Occupations by Sex
Within the Services occupations in Union Grove, the most male-oriented occupations are Personal Care & Service (27.4%), Cleaning & Maintenance (23.9%), and Food Preparation & Serving (22.1%), while the most female-oriented occupations are Healthcare Support (100.0%), Food Preparation & Serving (77.9%), and Cleaning & Maintenance (76.1%).
| Occupation | Male | Female |
| Healthcare Support | 0 (0.0%) | 64 (100.0%) |
| Security & Protection | 0 (0.0%) | 0 (0.0%) |
| Firefighting & Prevention | 0 (0.0%) | 0 (0.0%) |
| Law Enforcement | 0 (0.0%) | 0 (0.0%) |
| Food Preparation & Serving | 23 (22.1%) | 81 (77.9%) |
| Cleaning & Maintenance | 17 (23.9%) | 54 (76.1%) |
| Personal Care & Service | 26 (27.4%) | 69 (72.6%) |
| Total (Category) | 66 (19.8%) | 268 (80.2%) |
| Total (Overall) | 1,362 (51.4%) | 1,290 (48.6%) |
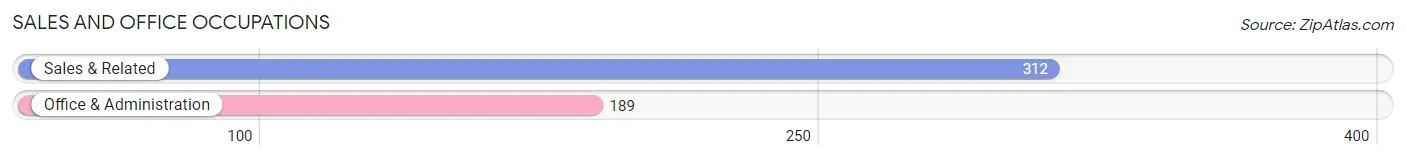
Sales and Office Occupations
The most common Sales and Office occupations in Union Grove are Sales & Related (312 | 11.8%), and Office & Administration (189 | 7.1%).
Sales and Office Occupations by Sex
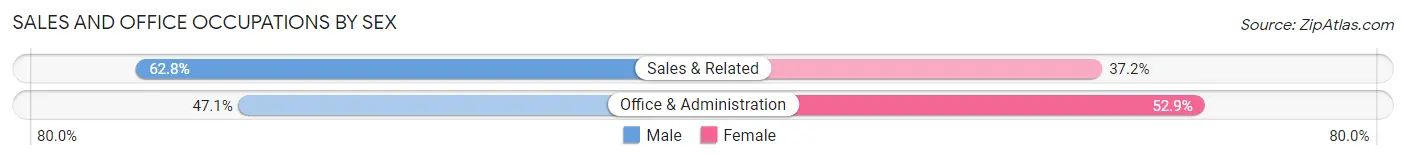
| Occupation | Male | Female |
| Sales & Related | 196 (62.8%) | 116 (37.2%) |
| Office & Administration | 89 (47.1%) | 100 (52.9%) |
| Total (Category) | 285 (56.9%) | 216 (43.1%) |
| Total (Overall) | 1,362 (51.4%) | 1,290 (48.6%) |
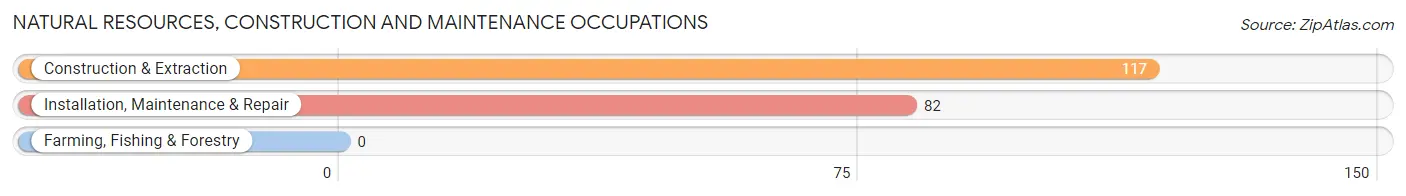
Natural Resources, Construction and Maintenance Occupations
The most common Natural Resources, Construction and Maintenance occupations in Union Grove are Construction & Extraction (117 | 4.4%), and Installation, Maintenance & Repair (82 | 3.1%).
Natural Resources, Construction and Maintenance Occupations by Sex
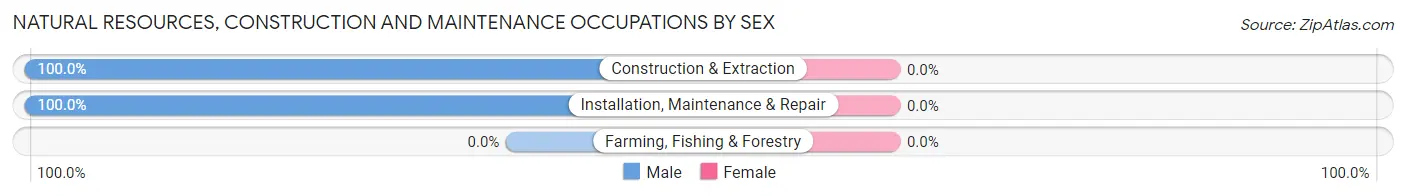
| Occupation | Male | Female |
| Farming, Fishing & Forestry | 0 (0.0%) | 0 (0.0%) |
| Construction & Extraction | 117 (100.0%) | 0 (0.0%) |
| Installation, Maintenance & Repair | 82 (100.0%) | 0 (0.0%) |
| Total (Category) | 199 (100.0%) | 0 (0.0%) |
| Total (Overall) | 1,362 (51.4%) | 1,290 (48.6%) |
Production, Transportation and Moving Occupations
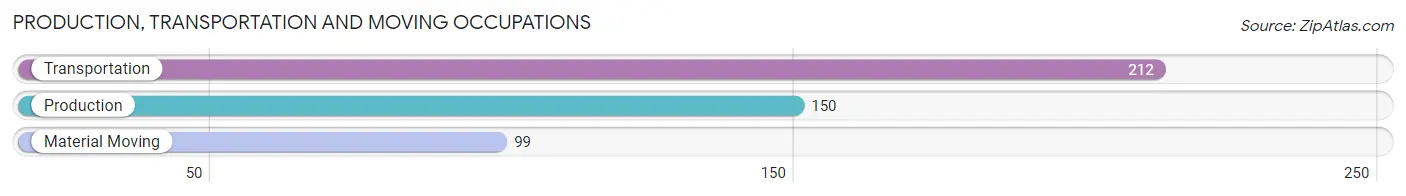
The most common Production, Transportation and Moving occupations in Union Grove are Transportation (212 | 8.0%), Production (150 | 5.7%), and Material Moving (99 | 3.7%).
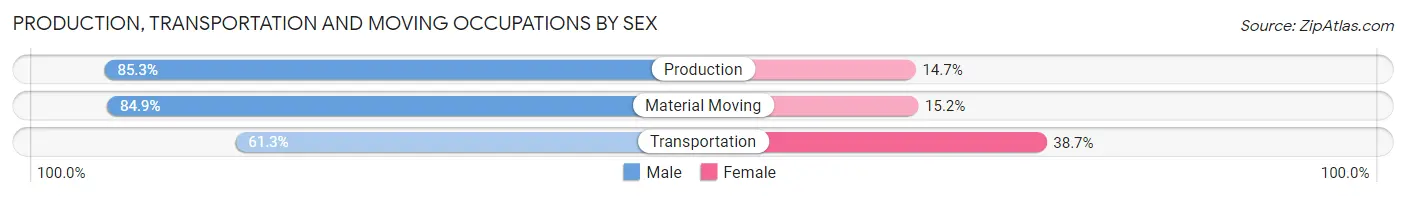
Production, Transportation and Moving Occupations by Sex
| Occupation | Male | Female |
| Production | 128 (85.3%) | 22 (14.7%) |
| Transportation | 130 (61.3%) | 82 (38.7%) |
| Material Moving | 84 (84.9%) | 15 (15.1%) |
| Total (Category) | 342 (74.2%) | 119 (25.8%) |
| Total (Overall) | 1,362 (51.4%) | 1,290 (48.6%) |
Employment Industries by Sex in Union Grove
Employment Industries in Union Grove
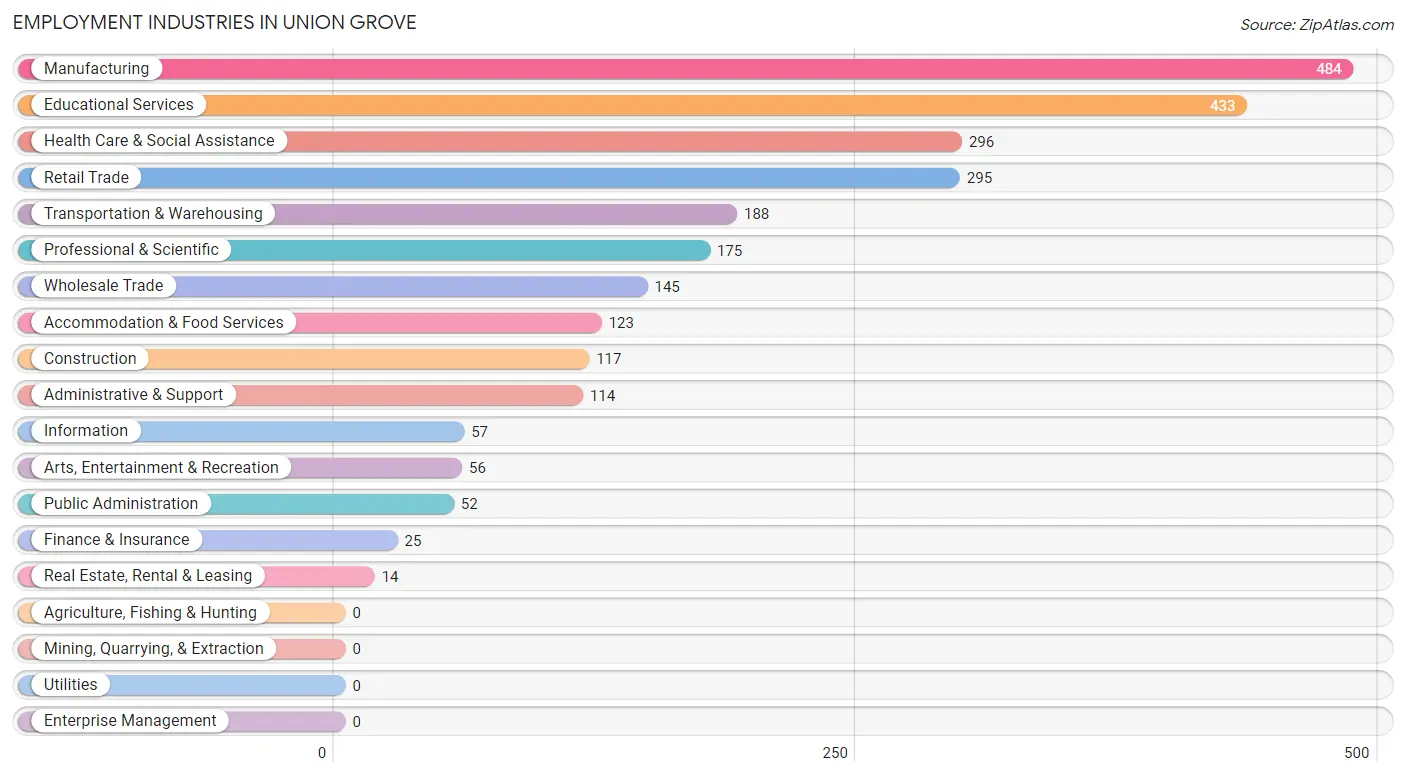
The major employment industries in Union Grove include Manufacturing (484 | 18.2%), Educational Services (433 | 16.3%), Health Care & Social Assistance (296 | 11.2%), Retail Trade (295 | 11.1%), and Transportation & Warehousing (188 | 7.1%).
Employment Industries by Sex in Union Grove
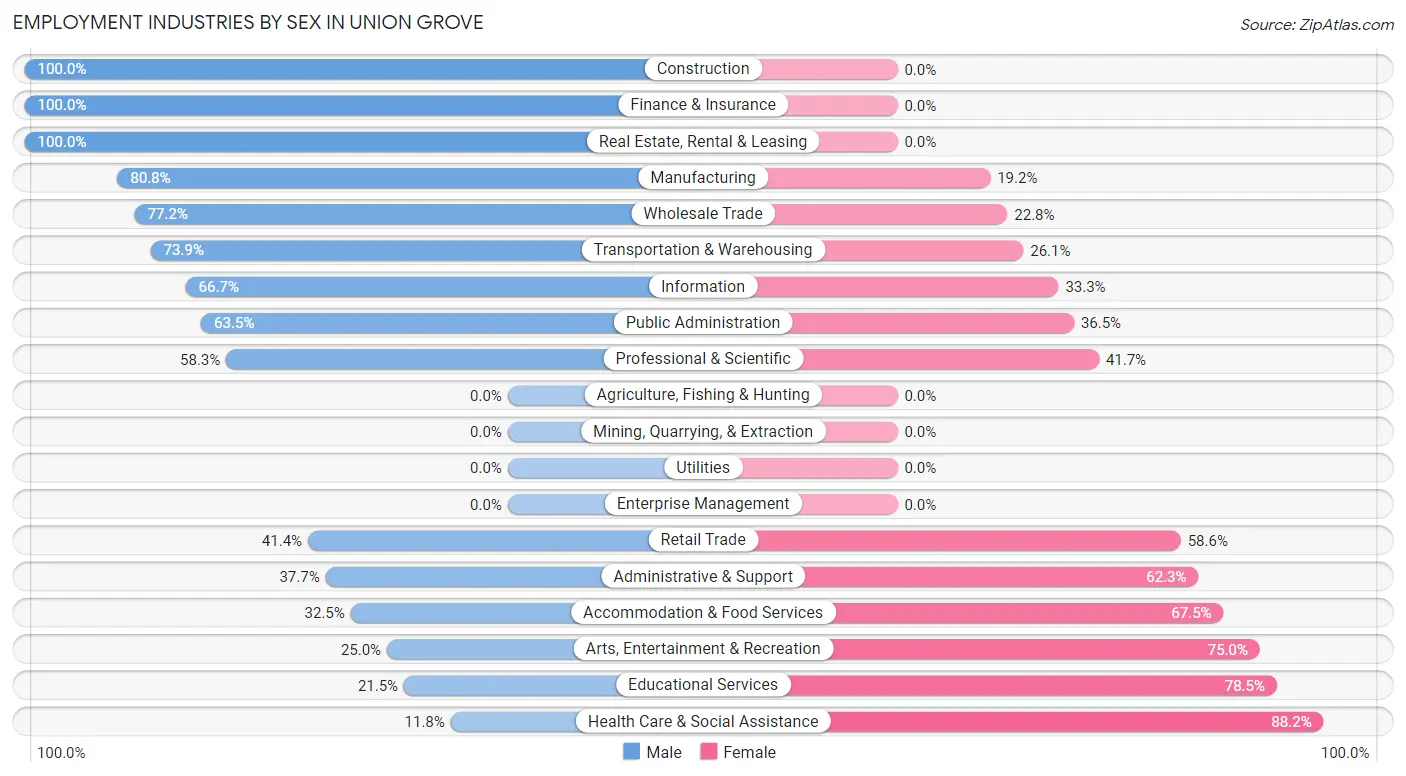
The Union Grove industries that see more men than women are Construction (100.0%), Finance & Insurance (100.0%), and Real Estate, Rental & Leasing (100.0%), whereas the industries that tend to have a higher number of women are Health Care & Social Assistance (88.2%), Educational Services (78.5%), and Arts, Entertainment & Recreation (75.0%).
| Industry | Male | Female |
| Agriculture, Fishing & Hunting | 0 (0.0%) | 0 (0.0%) |
| Mining, Quarrying, & Extraction | 0 (0.0%) | 0 (0.0%) |
| Construction | 117 (100.0%) | 0 (0.0%) |
| Manufacturing | 391 (80.8%) | 93 (19.2%) |
| Wholesale Trade | 112 (77.2%) | 33 (22.8%) |
| Retail Trade | 122 (41.4%) | 173 (58.6%) |
| Transportation & Warehousing | 139 (73.9%) | 49 (26.1%) |
| Utilities | 0 (0.0%) | 0 (0.0%) |
| Information | 38 (66.7%) | 19 (33.3%) |
| Finance & Insurance | 25 (100.0%) | 0 (0.0%) |
| Real Estate, Rental & Leasing | 14 (100.0%) | 0 (0.0%) |
| Professional & Scientific | 102 (58.3%) | 73 (41.7%) |
| Enterprise Management | 0 (0.0%) | 0 (0.0%) |
| Administrative & Support | 43 (37.7%) | 71 (62.3%) |
| Educational Services | 93 (21.5%) | 340 (78.5%) |
| Health Care & Social Assistance | 35 (11.8%) | 261 (88.2%) |
| Arts, Entertainment & Recreation | 14 (25.0%) | 42 (75.0%) |
| Accommodation & Food Services | 40 (32.5%) | 83 (67.5%) |
| Public Administration | 33 (63.5%) | 19 (36.5%) |
| Total | 1,362 (51.4%) | 1,290 (48.6%) |
Education in Union Grove
School Enrollment in Union Grove
The most common levels of schooling among the 1,552 students in Union Grove are middle school (433 | 27.9%), college / undergraduate (351 | 22.6%), and elementary school (347 | 22.4%).
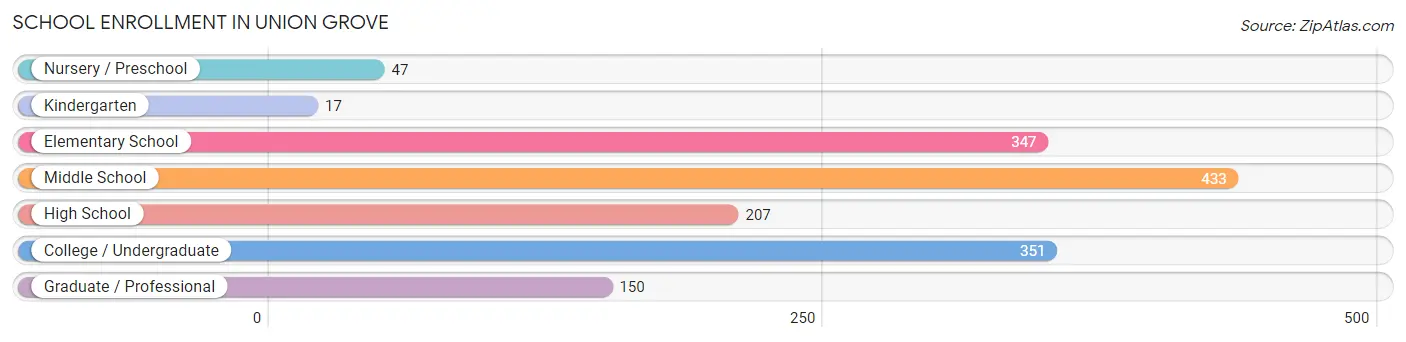
| School Level | # Students | % Students |
| Nursery / Preschool | 47 | 3.0% |
| Kindergarten | 17 | 1.1% |
| Elementary School | 347 | 22.4% |
| Middle School | 433 | 27.9% |
| High School | 207 | 13.3% |
| College / Undergraduate | 351 | 22.6% |
| Graduate / Professional | 150 | 9.7% |
| Total | 1,552 | 100.0% |
School Enrollment by Age by Funding Source in Union Grove
Out of a total of 1,552 students who are enrolled in schools in Union Grove, 205 (13.2%) attend a private institution, while the remaining 1,347 (86.8%) are enrolled in public schools. The age group of 35 years and over has the highest likelihood of being enrolled in private schools, with 87 (82.9% in the age bracket) enrolled. Conversely, the age group of 10 to 14 year olds has the lowest likelihood of being enrolled in a private school, with 538 (100.0% in the age bracket) attending a public institution.
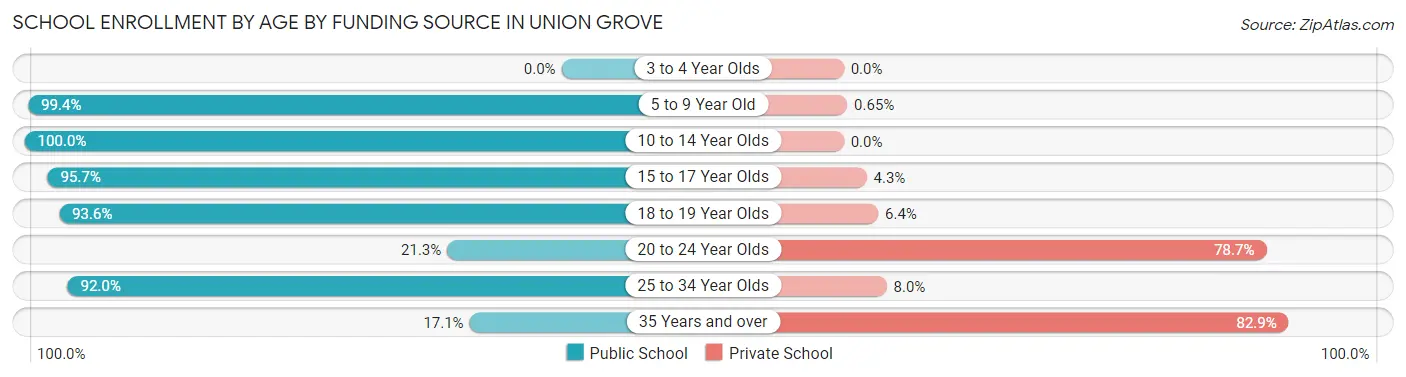
| Age Bracket | Public School | Private School |
| 3 to 4 Year Olds | 0 (0.0%) | 0 (0.0%) |
| 5 to 9 Year Old | 304 (99.4%) | 2 (0.6%) |
| 10 to 14 Year Olds | 538 (100.0%) | 0 (0.0%) |
| 15 to 17 Year Olds | 157 (95.7%) | 7 (4.3%) |
| 18 to 19 Year Olds | 146 (93.6%) | 10 (6.4%) |
| 20 to 24 Year Olds | 23 (21.3%) | 85 (78.7%) |
| 25 to 34 Year Olds | 161 (92.0%) | 14 (8.0%) |
| 35 Years and over | 18 (17.1%) | 87 (82.9%) |
| Total | 1,347 (86.8%) | 205 (13.2%) |
Educational Attainment by Field of Study in Union Grove
Business (325 | 24.6%), education (212 | 16.1%), psychology (152 | 11.5%), social sciences (129 | 9.8%), and science & technology (78 | 5.9%) are the most common fields of study among 1,319 individuals in Union Grove who have obtained a bachelor's degree or higher.
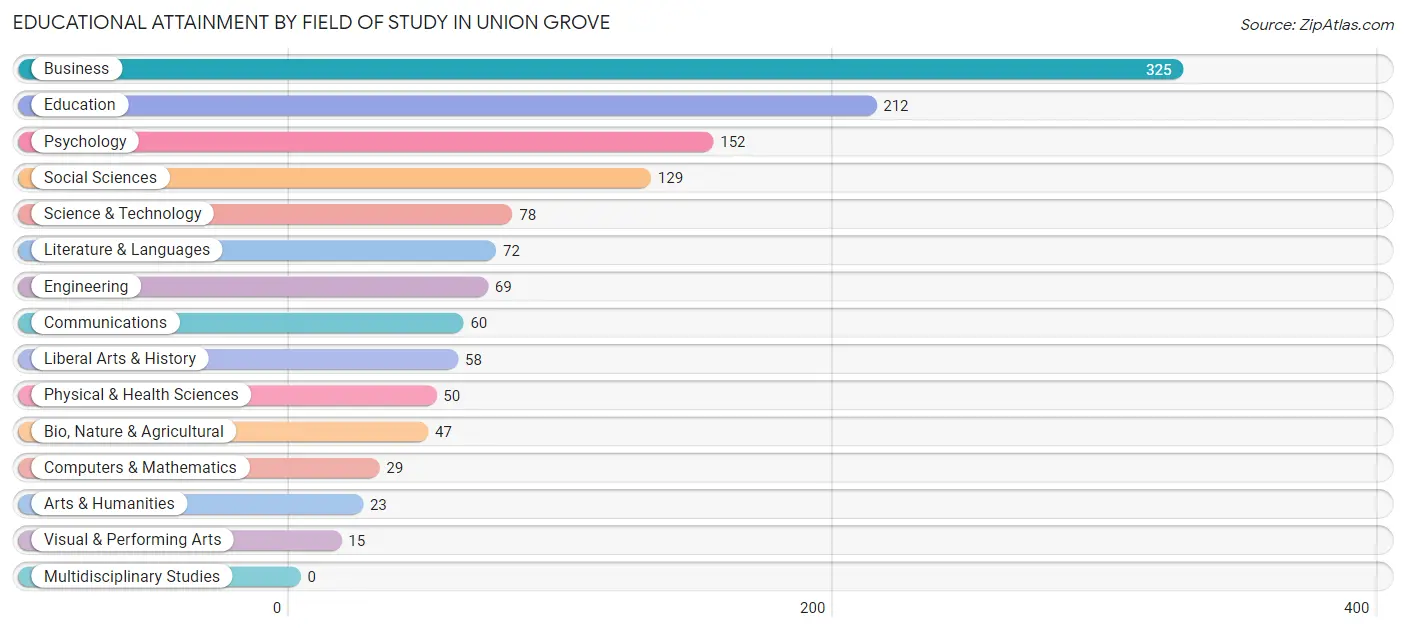
| Field of Study | # Graduates | % Graduates |
| Computers & Mathematics | 29 | 2.2% |
| Bio, Nature & Agricultural | 47 | 3.6% |
| Physical & Health Sciences | 50 | 3.8% |
| Psychology | 152 | 11.5% |
| Social Sciences | 129 | 9.8% |
| Engineering | 69 | 5.2% |
| Multidisciplinary Studies | 0 | 0.0% |
| Science & Technology | 78 | 5.9% |
| Business | 325 | 24.6% |
| Education | 212 | 16.1% |
| Literature & Languages | 72 | 5.5% |
| Liberal Arts & History | 58 | 4.4% |
| Visual & Performing Arts | 15 | 1.1% |
| Communications | 60 | 4.5% |
| Arts & Humanities | 23 | 1.7% |
| Total | 1,319 | 100.0% |
Transportation & Commute in Union Grove
Vehicle Availability by Sex in Union Grove
The most prevalent vehicle ownership categories in Union Grove are males with 2 vehicles (795, accounting for 59.1%) and females with 2 vehicles (661, making up 66.6%).
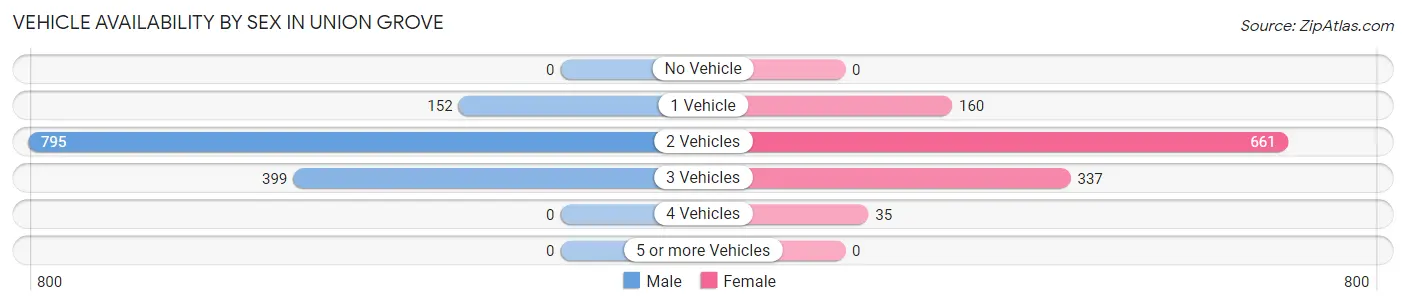
| Vehicles Available | Male | Female |
| No Vehicle | 0 (0.0%) | 0 (0.0%) |
| 1 Vehicle | 152 (11.3%) | 160 (13.4%) |
| 2 Vehicles | 795 (59.1%) | 661 (55.4%) |
| 3 Vehicles | 399 (29.6%) | 337 (28.2%) |
| 4 Vehicles | 0 (0.0%) | 35 (2.9%) |
| 5 or more Vehicles | 0 (0.0%) | 0 (0.0%) |
| Total | 1,346 (100.0%) | 1,193 (100.0%) |
Commute Time in Union Grove
The most frequently occuring commute durations in Union Grove are 5 to 9 minutes (459 commuters, 19.1%), 25 to 29 minutes (355 commuters, 14.8%), and 45 to 59 minutes (262 commuters, 10.9%).
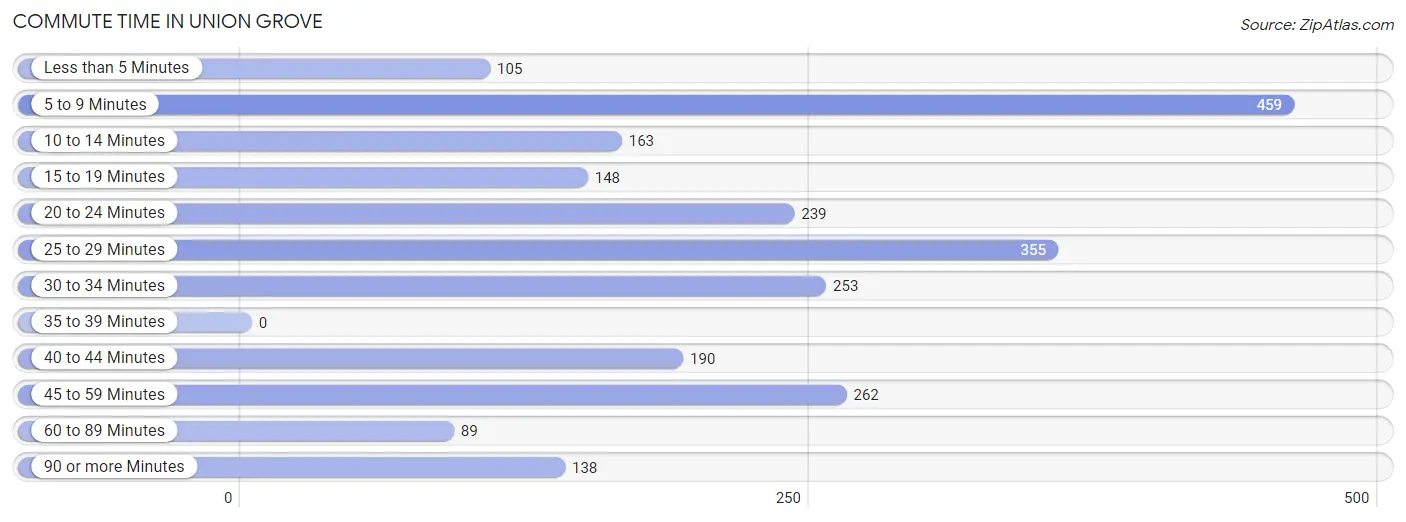
| Commute Time | # Commuters | % Commuters |
| Less than 5 Minutes | 105 | 4.4% |
| 5 to 9 Minutes | 459 | 19.1% |
| 10 to 14 Minutes | 163 | 6.8% |
| 15 to 19 Minutes | 148 | 6.2% |
| 20 to 24 Minutes | 239 | 10.0% |
| 25 to 29 Minutes | 355 | 14.8% |
| 30 to 34 Minutes | 253 | 10.5% |
| 35 to 39 Minutes | 0 | 0.0% |
| 40 to 44 Minutes | 190 | 7.9% |
| 45 to 59 Minutes | 262 | 10.9% |
| 60 to 89 Minutes | 89 | 3.7% |
| 90 or more Minutes | 138 | 5.8% |
Commute Time by Sex in Union Grove
The most common commute times in Union Grove are 45 to 59 minutes (210 commuters, 16.9%) for males and 5 to 9 minutes (314 commuters, 27.1%) for females.
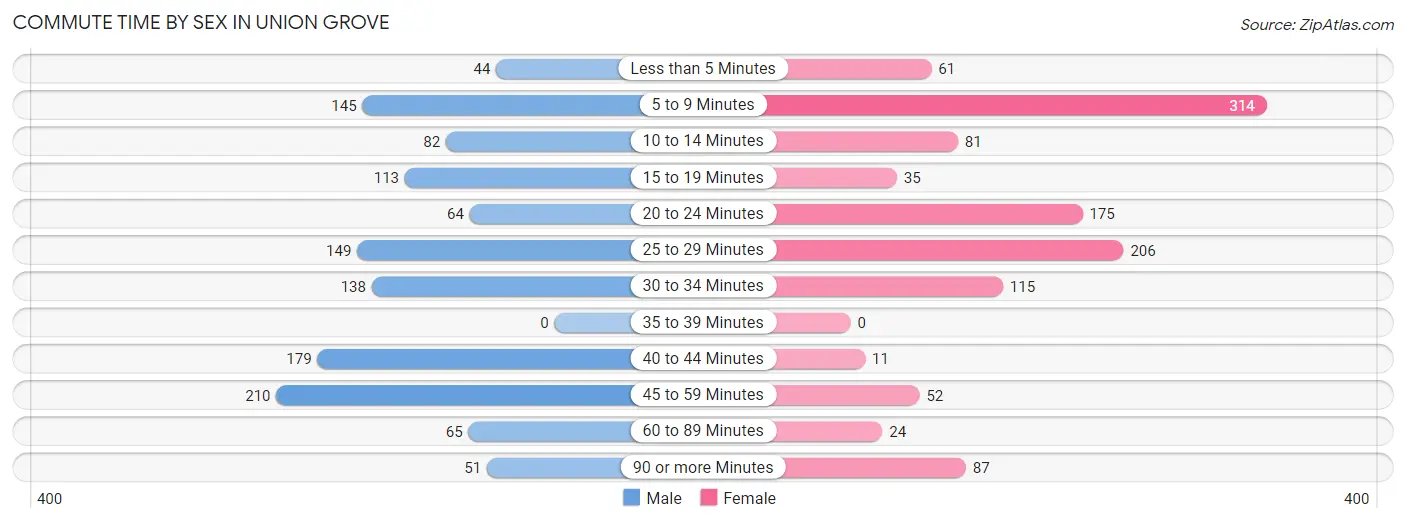
| Commute Time | Male | Female |
| Less than 5 Minutes | 44 (3.5%) | 61 (5.2%) |
| 5 to 9 Minutes | 145 (11.7%) | 314 (27.1%) |
| 10 to 14 Minutes | 82 (6.6%) | 81 (7.0%) |
| 15 to 19 Minutes | 113 (9.1%) | 35 (3.0%) |
| 20 to 24 Minutes | 64 (5.2%) | 175 (15.1%) |
| 25 to 29 Minutes | 149 (12.0%) | 206 (17.7%) |
| 30 to 34 Minutes | 138 (11.1%) | 115 (9.9%) |
| 35 to 39 Minutes | 0 (0.0%) | 0 (0.0%) |
| 40 to 44 Minutes | 179 (14.4%) | 11 (0.9%) |
| 45 to 59 Minutes | 210 (16.9%) | 52 (4.5%) |
| 60 to 89 Minutes | 65 (5.2%) | 24 (2.1%) |
| 90 or more Minutes | 51 (4.1%) | 87 (7.5%) |
Time of Departure to Work by Sex in Union Grove
The most frequent times of departure to work in Union Grove are 7:00 AM to 7:29 AM (345, 27.8%) for males and 7:00 AM to 7:29 AM (198, 17.1%) for females.
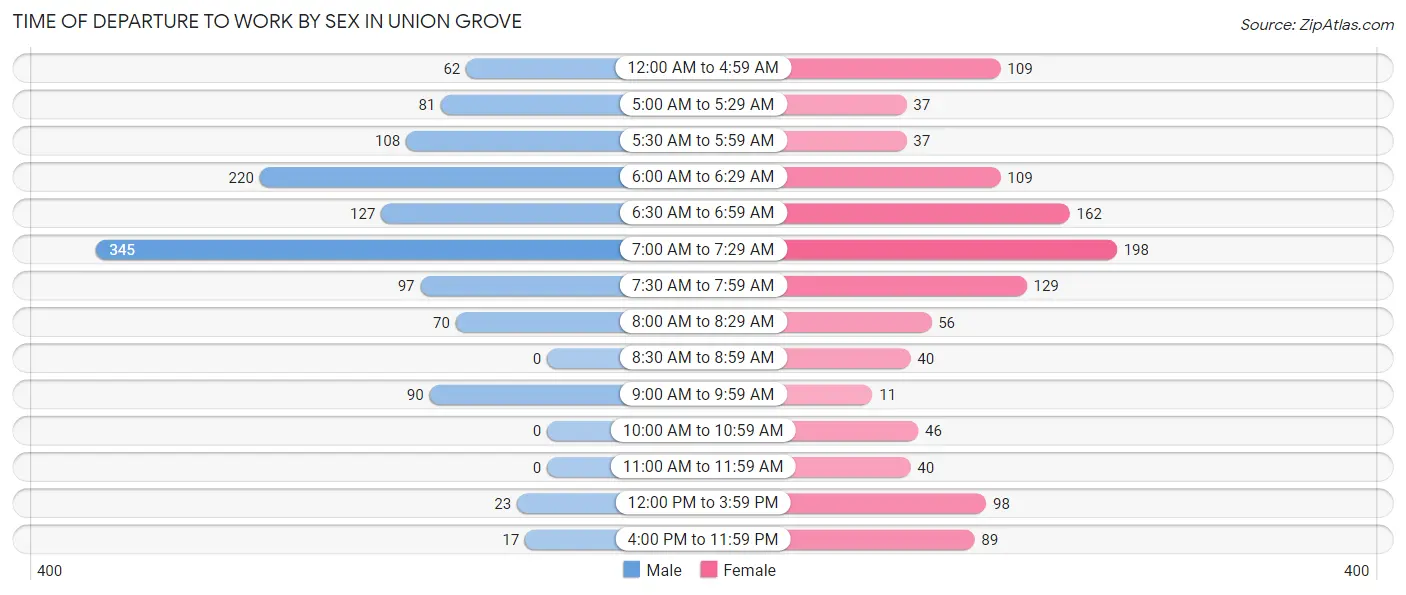
| Time of Departure | Male | Female |
| 12:00 AM to 4:59 AM | 62 (5.0%) | 109 (9.4%) |
| 5:00 AM to 5:29 AM | 81 (6.5%) | 37 (3.2%) |
| 5:30 AM to 5:59 AM | 108 (8.7%) | 37 (3.2%) |
| 6:00 AM to 6:29 AM | 220 (17.7%) | 109 (9.4%) |
| 6:30 AM to 6:59 AM | 127 (10.2%) | 162 (14.0%) |
| 7:00 AM to 7:29 AM | 345 (27.8%) | 198 (17.1%) |
| 7:30 AM to 7:59 AM | 97 (7.8%) | 129 (11.1%) |
| 8:00 AM to 8:29 AM | 70 (5.7%) | 56 (4.8%) |
| 8:30 AM to 8:59 AM | 0 (0.0%) | 40 (3.5%) |
| 9:00 AM to 9:59 AM | 90 (7.3%) | 11 (0.9%) |
| 10:00 AM to 10:59 AM | 0 (0.0%) | 46 (4.0%) |
| 11:00 AM to 11:59 AM | 0 (0.0%) | 40 (3.5%) |
| 12:00 PM to 3:59 PM | 23 (1.8%) | 98 (8.4%) |
| 4:00 PM to 11:59 PM | 17 (1.4%) | 89 (7.7%) |
| Total | 1,240 (100.0%) | 1,161 (100.0%) |
Housing Occupancy in Union Grove
Occupancy by Ownership in Union Grove
Of the total 1,866 dwellings in Union Grove, owner-occupied units account for 1,063 (57.0%), while renter-occupied units make up 803 (43.0%).
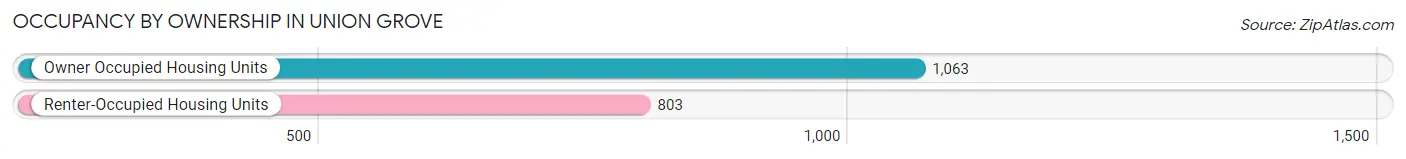
| Occupancy | # Housing Units | % Housing Units |
| Owner Occupied Housing Units | 1,063 | 57.0% |
| Renter-Occupied Housing Units | 803 | 43.0% |
| Total Occupied Housing Units | 1,866 | 100.0% |
Occupancy by Household Size in Union Grove
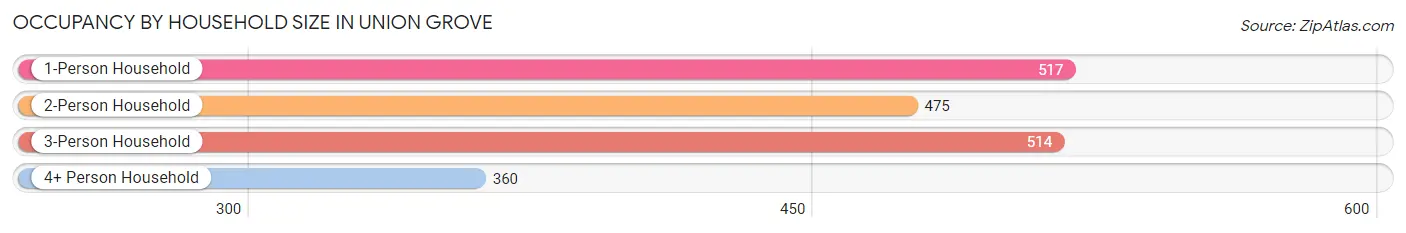
| Household Size | # Housing Units | % Housing Units |
| 1-Person Household | 517 | 27.7% |
| 2-Person Household | 475 | 25.5% |
| 3-Person Household | 514 | 27.6% |
| 4+ Person Household | 360 | 19.3% |
| Total Housing Units | 1,866 | 100.0% |
Occupancy by Ownership by Household Size in Union Grove
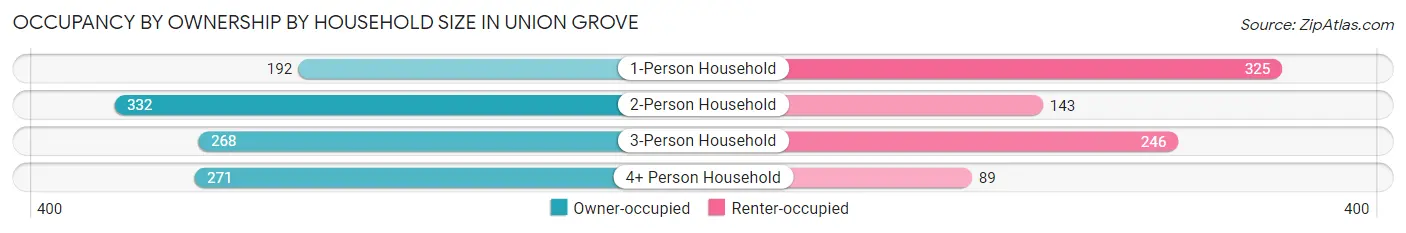
| Household Size | Owner-occupied | Renter-occupied |
| 1-Person Household | 192 (37.1%) | 325 (62.9%) |
| 2-Person Household | 332 (69.9%) | 143 (30.1%) |
| 3-Person Household | 268 (52.1%) | 246 (47.9%) |
| 4+ Person Household | 271 (75.3%) | 89 (24.7%) |
| Total Housing Units | 1,063 (57.0%) | 803 (43.0%) |
Occupancy by Educational Attainment in Union Grove
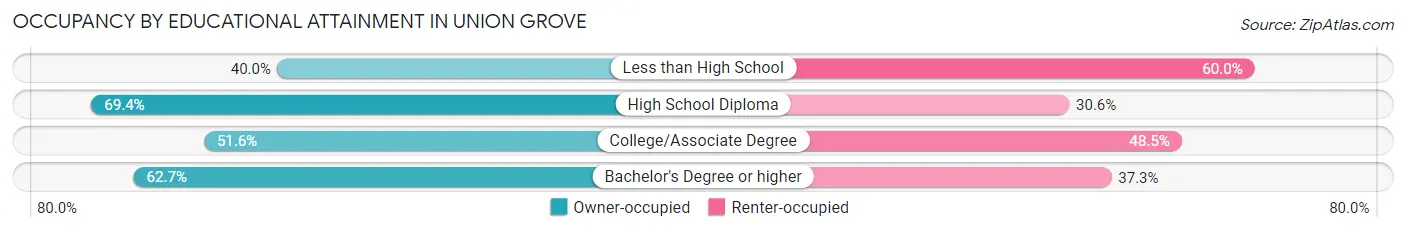
| Household Size | Owner-occupied | Renter-occupied |
| Less than High School | 52 (40.0%) | 78 (60.0%) |
| High School Diploma | 127 (69.4%) | 56 (30.6%) |
| College/Associate Degree | 415 (51.5%) | 390 (48.4%) |
| Bachelor's Degree or higher | 469 (62.7%) | 279 (37.3%) |
Occupancy by Age of Householder in Union Grove
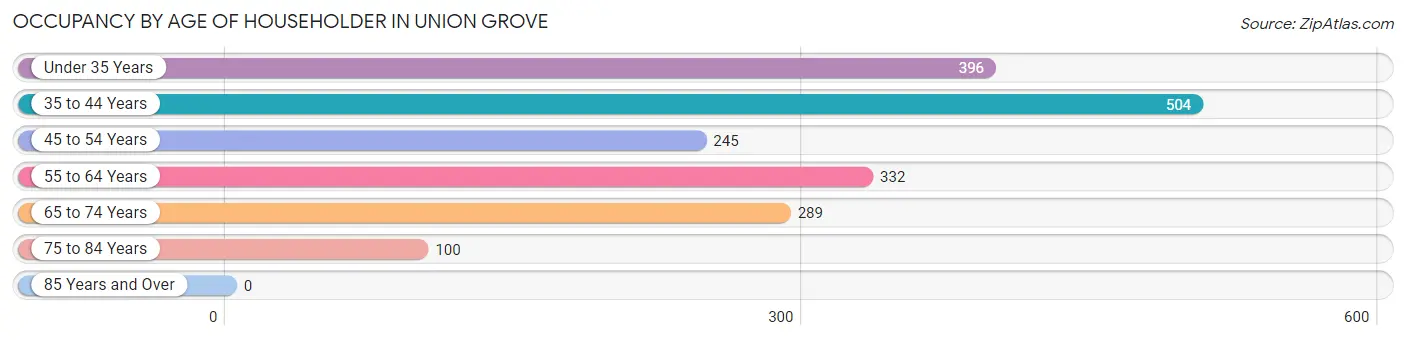
| Age Bracket | # Households | % Households |
| Under 35 Years | 396 | 21.2% |
| 35 to 44 Years | 504 | 27.0% |
| 45 to 54 Years | 245 | 13.1% |
| 55 to 64 Years | 332 | 17.8% |
| 65 to 74 Years | 289 | 15.5% |
| 75 to 84 Years | 100 | 5.4% |
| 85 Years and Over | 0 | 0.0% |
| Total | 1,866 | 100.0% |
Housing Finances in Union Grove
Median Income by Occupancy in Union Grove
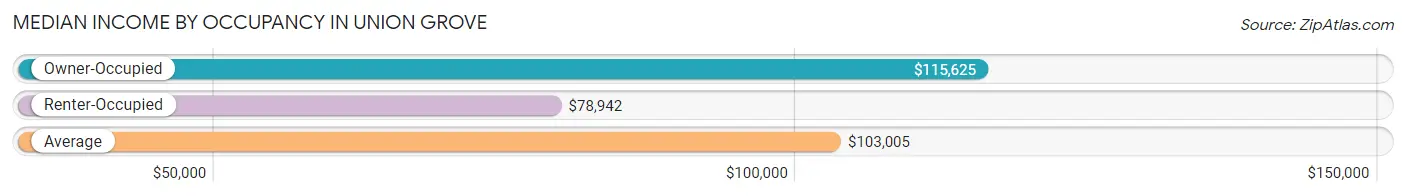
| Occupancy Type | # Households | Median Income |
| Owner-Occupied | 1,063 (57.0%) | $115,625 |
| Renter-Occupied | 803 (43.0%) | $78,942 |
| Average | 1,866 (100.0%) | $103,005 |
Occupancy by Householder Income Bracket in Union Grove
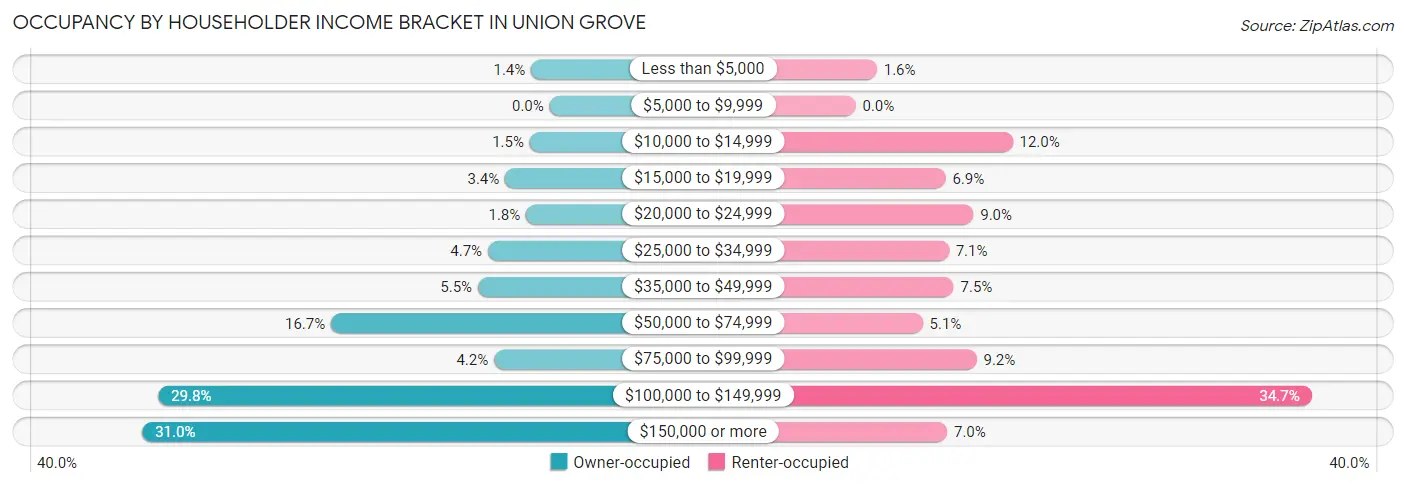
| Income Bracket | Owner-occupied | Renter-occupied |
| Less than $5,000 | 15 (1.4%) | 13 (1.6%) |
| $5,000 to $9,999 | 0 (0.0%) | 0 (0.0%) |
| $10,000 to $14,999 | 16 (1.5%) | 96 (12.0%) |
| $15,000 to $19,999 | 36 (3.4%) | 55 (6.9%) |
| $20,000 to $24,999 | 19 (1.8%) | 72 (9.0%) |
| $25,000 to $34,999 | 50 (4.7%) | 57 (7.1%) |
| $35,000 to $49,999 | 58 (5.5%) | 60 (7.5%) |
| $50,000 to $74,999 | 177 (16.7%) | 41 (5.1%) |
| $75,000 to $99,999 | 45 (4.2%) | 74 (9.2%) |
| $100,000 to $149,999 | 317 (29.8%) | 279 (34.7%) |
| $150,000 or more | 330 (31.0%) | 56 (7.0%) |
| Total | 1,063 (100.0%) | 803 (100.0%) |
Monthly Housing Cost Tiers in Union Grove
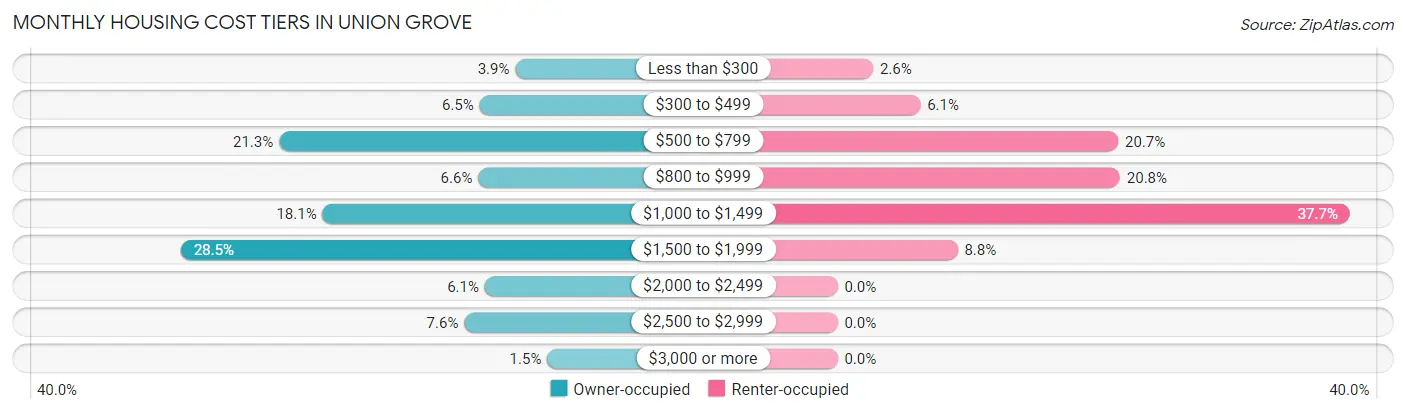
| Monthly Cost | Owner-occupied | Renter-occupied |
| Less than $300 | 41 (3.9%) | 21 (2.6%) |
| $300 to $499 | 69 (6.5%) | 49 (6.1%) |
| $500 to $799 | 226 (21.3%) | 166 (20.7%) |
| $800 to $999 | 70 (6.6%) | 167 (20.8%) |
| $1,000 to $1,499 | 192 (18.1%) | 303 (37.7%) |
| $1,500 to $1,999 | 303 (28.5%) | 71 (8.8%) |
| $2,000 to $2,499 | 65 (6.1%) | 0 (0.0%) |
| $2,500 to $2,999 | 81 (7.6%) | 0 (0.0%) |
| $3,000 or more | 16 (1.5%) | 0 (0.0%) |
| Total | 1,063 (100.0%) | 803 (100.0%) |
Physical Housing Characteristics in Union Grove
Housing Structures in Union Grove
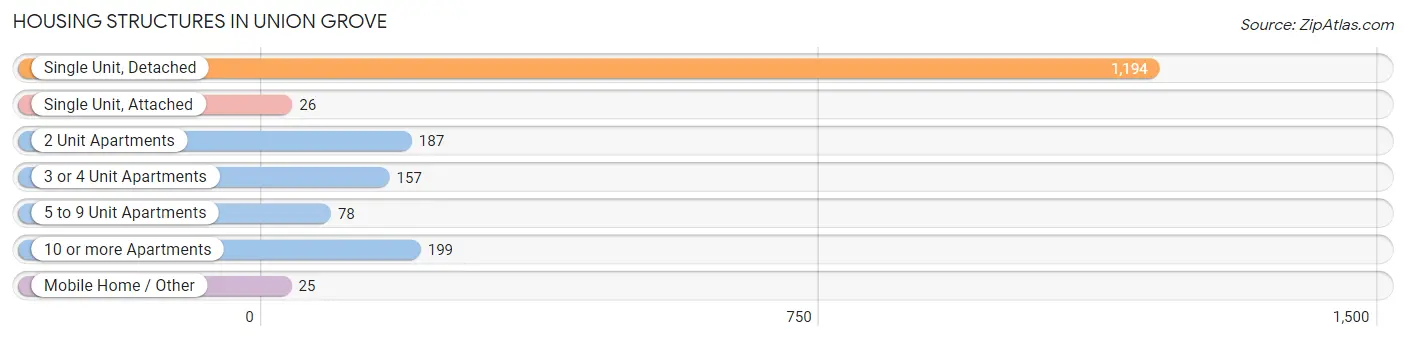
| Structure Type | # Housing Units | % Housing Units |
| Single Unit, Detached | 1,194 | 64.0% |
| Single Unit, Attached | 26 | 1.4% |
| 2 Unit Apartments | 187 | 10.0% |
| 3 or 4 Unit Apartments | 157 | 8.4% |
| 5 to 9 Unit Apartments | 78 | 4.2% |
| 10 or more Apartments | 199 | 10.7% |
| Mobile Home / Other | 25 | 1.3% |
| Total | 1,866 | 100.0% |
Housing Structures by Occupancy in Union Grove
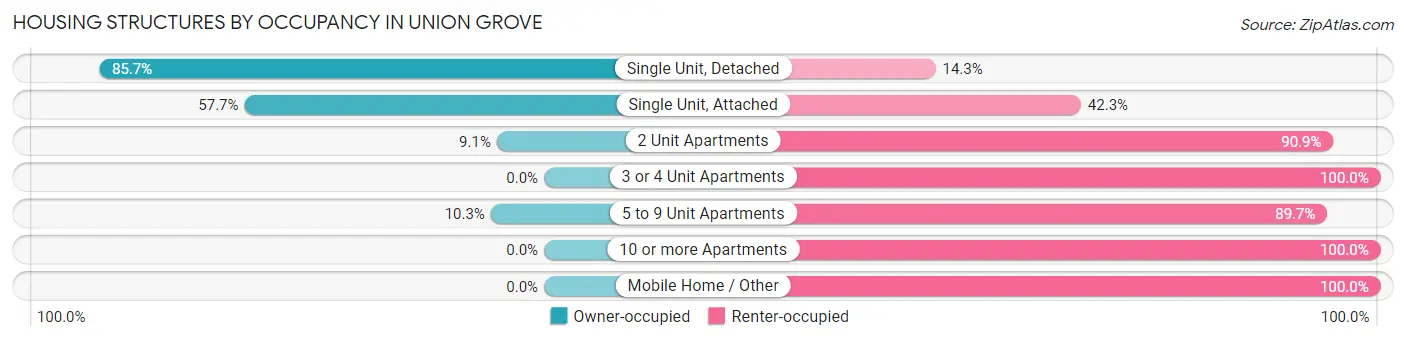
| Structure Type | Owner-occupied | Renter-occupied |
| Single Unit, Detached | 1,023 (85.7%) | 171 (14.3%) |
| Single Unit, Attached | 15 (57.7%) | 11 (42.3%) |
| 2 Unit Apartments | 17 (9.1%) | 170 (90.9%) |
| 3 or 4 Unit Apartments | 0 (0.0%) | 157 (100.0%) |
| 5 to 9 Unit Apartments | 8 (10.3%) | 70 (89.7%) |
| 10 or more Apartments | 0 (0.0%) | 199 (100.0%) |
| Mobile Home / Other | 0 (0.0%) | 25 (100.0%) |
| Total | 1,063 (57.0%) | 803 (43.0%) |
Housing Structures by Number of Rooms in Union Grove
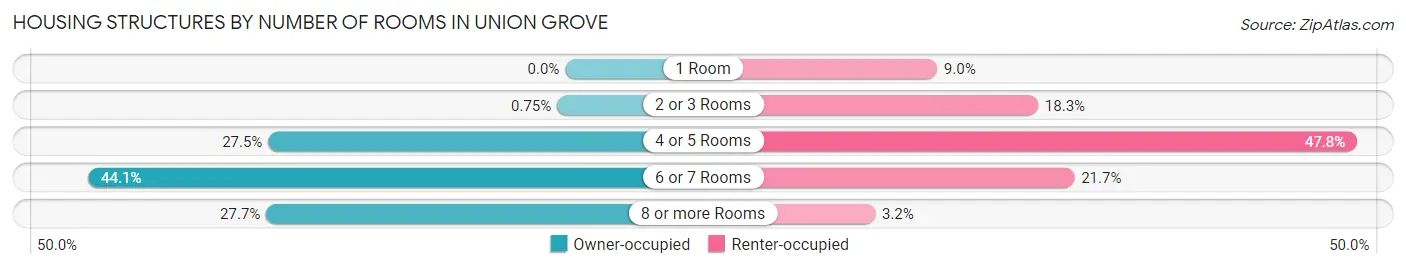
| Number of Rooms | Owner-occupied | Renter-occupied |
| 1 Room | 0 (0.0%) | 72 (9.0%) |
| 2 or 3 Rooms | 8 (0.7%) | 147 (18.3%) |
| 4 or 5 Rooms | 292 (27.5%) | 384 (47.8%) |
| 6 or 7 Rooms | 469 (44.1%) | 174 (21.7%) |
| 8 or more Rooms | 294 (27.7%) | 26 (3.2%) |
| Total | 1,063 (100.0%) | 803 (100.0%) |
Housing Structure by Heating Type in Union Grove
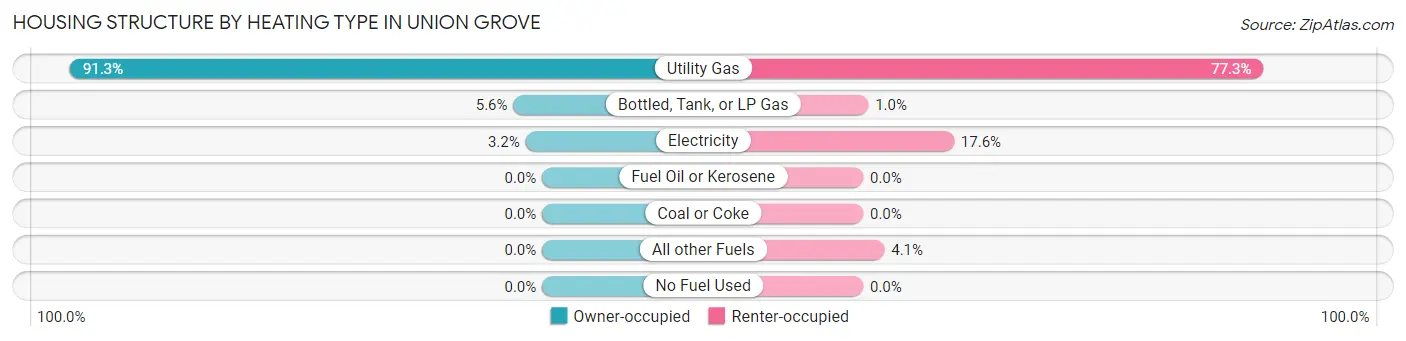
| Heating Type | Owner-occupied | Renter-occupied |
| Utility Gas | 970 (91.2%) | 621 (77.3%) |
| Bottled, Tank, or LP Gas | 59 (5.6%) | 8 (1.0%) |
| Electricity | 34 (3.2%) | 141 (17.6%) |
| Fuel Oil or Kerosene | 0 (0.0%) | 0 (0.0%) |
| Coal or Coke | 0 (0.0%) | 0 (0.0%) |
| All other Fuels | 0 (0.0%) | 33 (4.1%) |
| No Fuel Used | 0 (0.0%) | 0 (0.0%) |
| Total | 1,063 (100.0%) | 803 (100.0%) |
Household Vehicle Usage in Union Grove
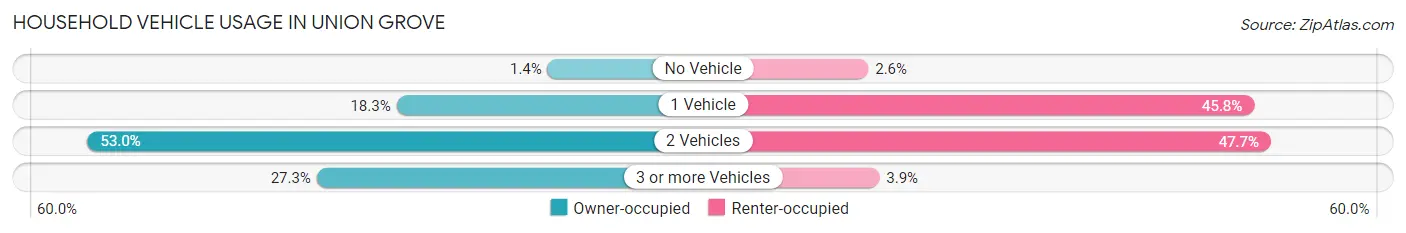
| Vehicles per Household | Owner-occupied | Renter-occupied |
| No Vehicle | 15 (1.4%) | 21 (2.6%) |
| 1 Vehicle | 195 (18.3%) | 368 (45.8%) |
| 2 Vehicles | 563 (53.0%) | 383 (47.7%) |
| 3 or more Vehicles | 290 (27.3%) | 31 (3.9%) |
| Total | 1,063 (100.0%) | 803 (100.0%) |
Real Estate & Mortgages in Union Grove
Real Estate and Mortgage Overview in Union Grove
| Characteristic | Without Mortgage | With Mortgage |
| Housing Units | 404 | 659 |
| Median Property Value | $228,700 | $272,400 |
| Median Household Income | $71,190 | $281 |
| Monthly Housing Costs | $642 | $16 |
| Real Estate Taxes | $3,571 | $8 |
Property Value by Mortgage Status in Union Grove
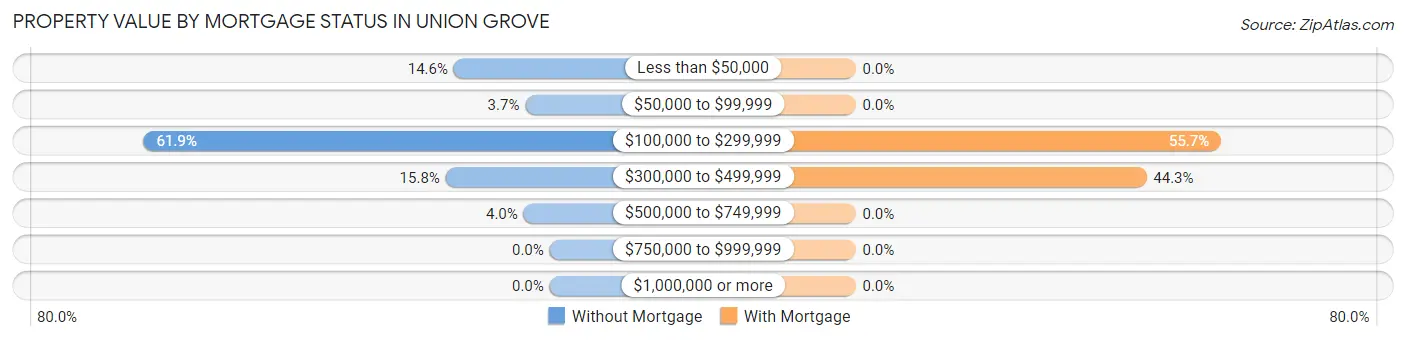
| Property Value | Without Mortgage | With Mortgage |
| Less than $50,000 | 59 (14.6%) | 0 (0.0%) |
| $50,000 to $99,999 | 15 (3.7%) | 0 (0.0%) |
| $100,000 to $299,999 | 250 (61.9%) | 367 (55.7%) |
| $300,000 to $499,999 | 64 (15.8%) | 292 (44.3%) |
| $500,000 to $749,999 | 16 (4.0%) | 0 (0.0%) |
| $750,000 to $999,999 | 0 (0.0%) | 0 (0.0%) |
| $1,000,000 or more | 0 (0.0%) | 0 (0.0%) |
| Total | 404 (100.0%) | 659 (100.0%) |
Household Income by Mortgage Status in Union Grove
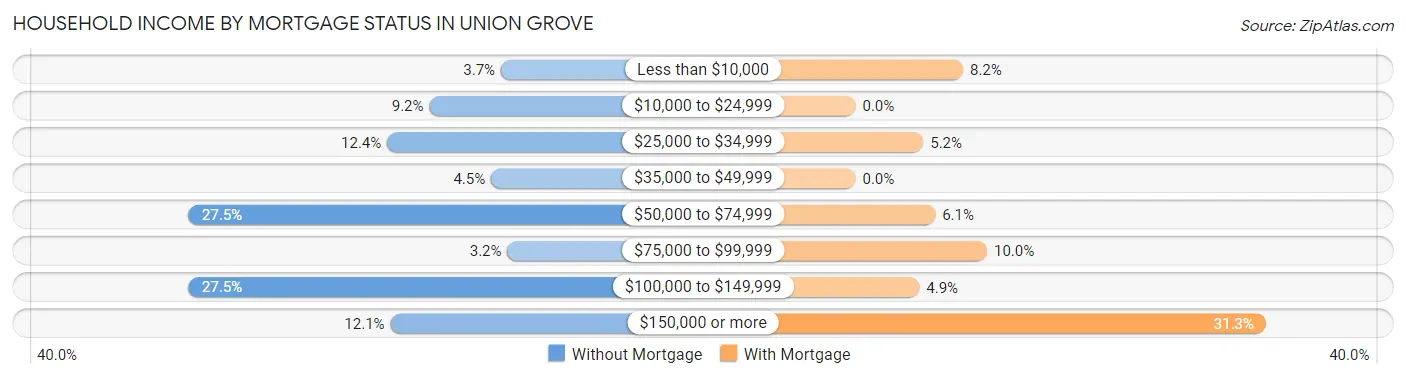
| Household Income | Without Mortgage | With Mortgage |
| Less than $10,000 | 15 (3.7%) | 54 (8.2%) |
| $10,000 to $24,999 | 37 (9.2%) | 0 (0.0%) |
| $25,000 to $34,999 | 50 (12.4%) | 34 (5.2%) |
| $35,000 to $49,999 | 18 (4.5%) | 0 (0.0%) |
| $50,000 to $74,999 | 111 (27.5%) | 40 (6.1%) |
| $75,000 to $99,999 | 13 (3.2%) | 66 (10.0%) |
| $100,000 to $149,999 | 111 (27.5%) | 32 (4.9%) |
| $150,000 or more | 49 (12.1%) | 206 (31.3%) |
| Total | 404 (100.0%) | 659 (100.0%) |
Property Value to Household Income Ratio in Union Grove
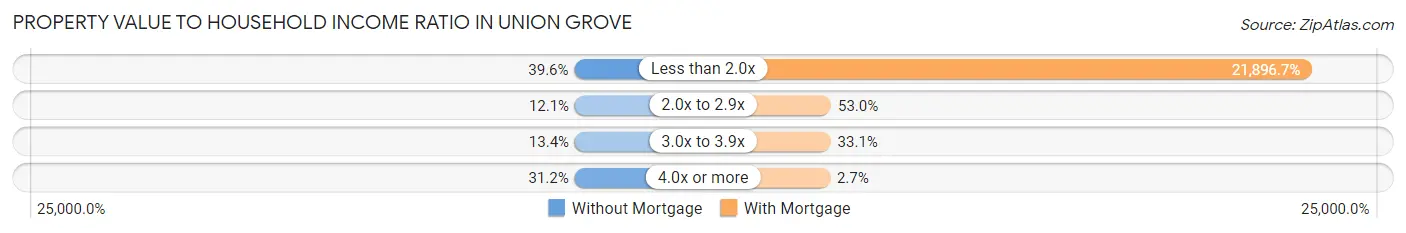
| Value-to-Income Ratio | Without Mortgage | With Mortgage |
| Less than 2.0x | 160 (39.6%) | 144,299 (21,896.7%) |
| 2.0x to 2.9x | 49 (12.1%) | 349 (53.0%) |
| 3.0x to 3.9x | 54 (13.4%) | 218 (33.1%) |
| 4.0x or more | 126 (31.2%) | 18 (2.7%) |
| Total | 404 (100.0%) | 659 (100.0%) |
Real Estate Taxes by Mortgage Status in Union Grove
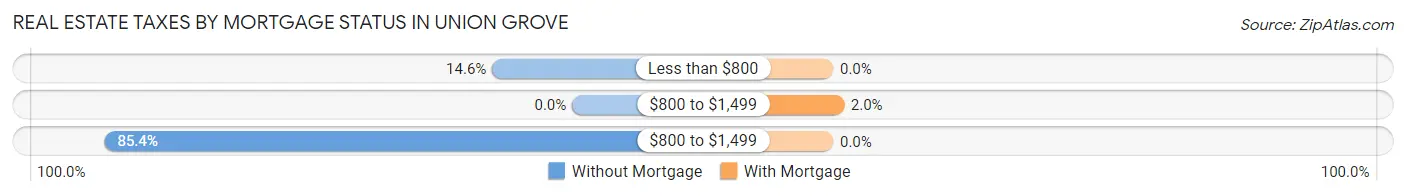
| Property Taxes | Without Mortgage | With Mortgage |
| Less than $800 | 59 (14.6%) | 0 (0.0%) |
| $800 to $1,499 | 0 (0.0%) | 13 (2.0%) |
| $800 to $1,499 | 345 (85.4%) | 0 (0.0%) |
| Total | 404 (100.0%) | 659 (100.0%) |
Health & Disability in Union Grove
Health Insurance Coverage by Age in Union Grove
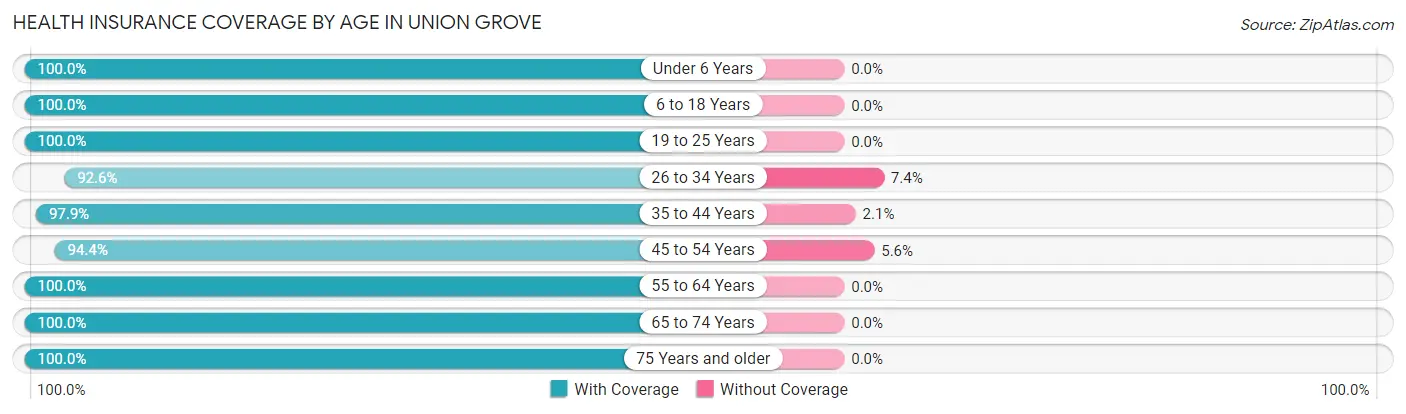
| Age Bracket | With Coverage | Without Coverage |
| Under 6 Years | 207 (100.0%) | 0 (0.0%) |
| 6 to 18 Years | 1,064 (100.0%) | 0 (0.0%) |
| 19 to 25 Years | 501 (100.0%) | 0 (0.0%) |
| 26 to 34 Years | 564 (92.6%) | 45 (7.4%) |
| 35 to 44 Years | 691 (97.9%) | 15 (2.1%) |
| 45 to 54 Years | 557 (94.4%) | 33 (5.6%) |
| 55 to 64 Years | 526 (100.0%) | 0 (0.0%) |
| 65 to 74 Years | 398 (100.0%) | 0 (0.0%) |
| 75 Years and older | 184 (100.0%) | 0 (0.0%) |
| Total | 4,692 (98.1%) | 93 (1.9%) |
Health Insurance Coverage by Citizenship Status in Union Grove
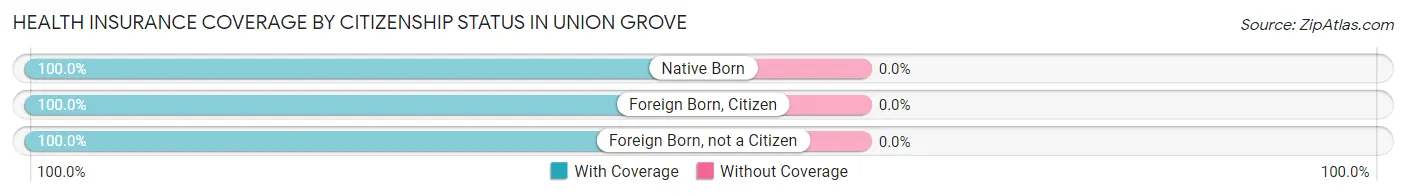
| Citizenship Status | With Coverage | Without Coverage |
| Native Born | 207 (100.0%) | 0 (0.0%) |
| Foreign Born, Citizen | 1,064 (100.0%) | 0 (0.0%) |
| Foreign Born, not a Citizen | 501 (100.0%) | 0 (0.0%) |
Health Insurance Coverage by Household Income in Union Grove
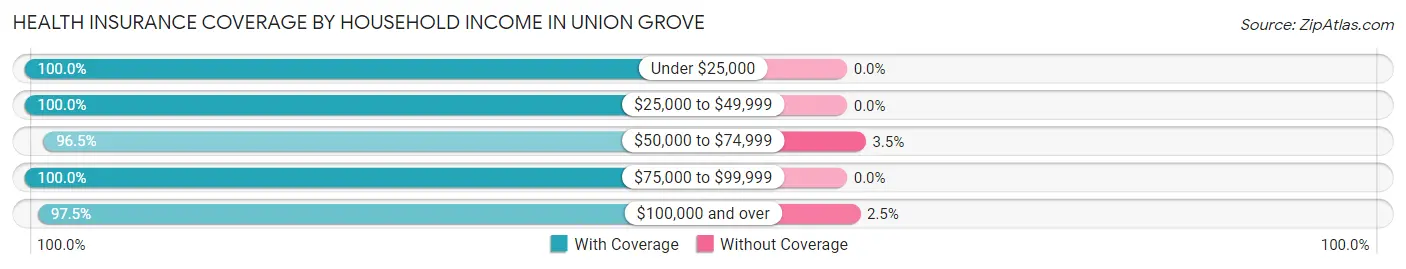
| Household Income | With Coverage | Without Coverage |
| Under $25,000 | 562 (100.0%) | 0 (0.0%) |
| $25,000 to $49,999 | 328 (100.0%) | 0 (0.0%) |
| $50,000 to $74,999 | 413 (96.5%) | 15 (3.5%) |
| $75,000 to $99,999 | 326 (100.0%) | 0 (0.0%) |
| $100,000 and over | 3,063 (97.5%) | 78 (2.5%) |
Public vs Private Health Insurance Coverage by Age in Union Grove
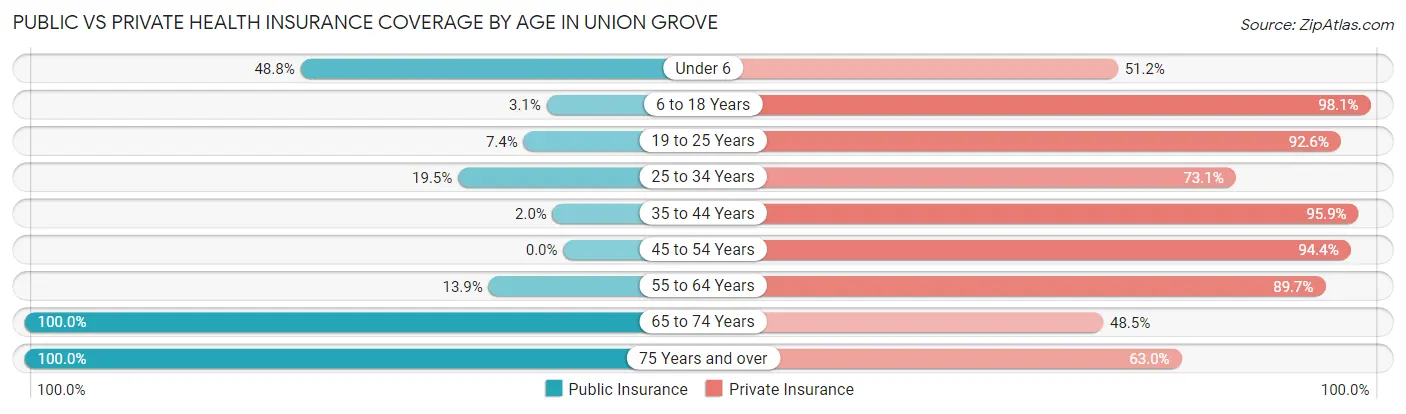
| Age Bracket | Public Insurance | Private Insurance |
| Under 6 | 101 (48.8%) | 106 (51.2%) |
| 6 to 18 Years | 33 (3.1%) | 1,044 (98.1%) |
| 19 to 25 Years | 37 (7.4%) | 464 (92.6%) |
| 25 to 34 Years | 119 (19.5%) | 445 (73.1%) |
| 35 to 44 Years | 14 (2.0%) | 677 (95.9%) |
| 45 to 54 Years | 0 (0.0%) | 557 (94.4%) |
| 55 to 64 Years | 73 (13.9%) | 472 (89.7%) |
| 65 to 74 Years | 398 (100.0%) | 193 (48.5%) |
| 75 Years and over | 184 (100.0%) | 116 (63.0%) |
| Total | 959 (20.0%) | 4,074 (85.1%) |
Disability Status by Sex by Age in Union Grove
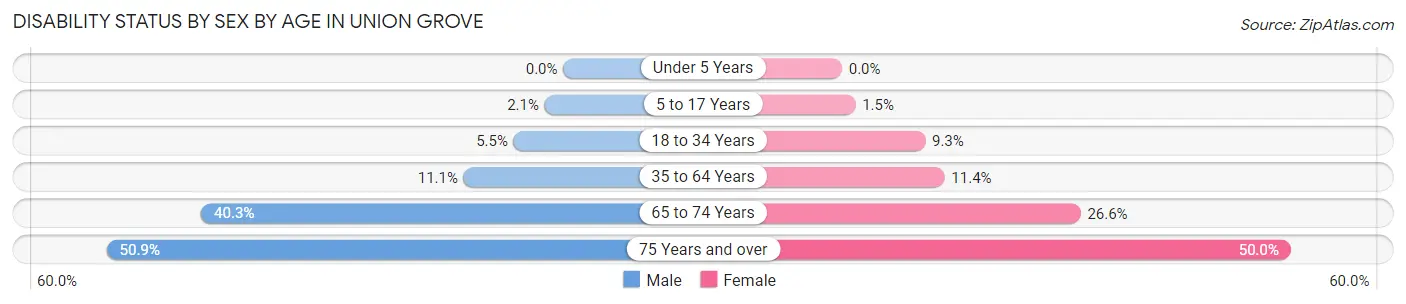
| Age Bracket | Male | Female |
| Under 5 Years | 0 (0.0%) | 0 (0.0%) |
| 5 to 17 Years | 11 (2.1%) | 7 (1.5%) |
| 18 to 34 Years | 34 (5.5%) | 56 (9.3%) |
| 35 to 64 Years | 104 (11.1%) | 101 (11.4%) |
| 65 to 74 Years | 71 (40.3%) | 59 (26.6%) |
| 75 Years and over | 59 (50.9%) | 34 (50.0%) |
Disability Class by Sex by Age in Union Grove
Disability Class: Hearing Difficulty
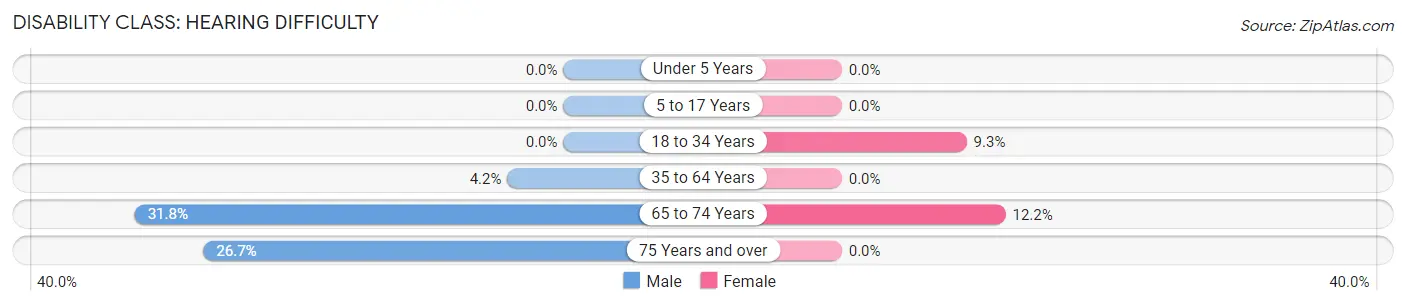
| Age Bracket | Male | Female |
| Under 5 Years | 0 (0.0%) | 0 (0.0%) |
| 5 to 17 Years | 0 (0.0%) | 0 (0.0%) |
| 18 to 34 Years | 0 (0.0%) | 56 (9.3%) |
| 35 to 64 Years | 39 (4.2%) | 0 (0.0%) |
| 65 to 74 Years | 56 (31.8%) | 27 (12.2%) |
| 75 Years and over | 31 (26.7%) | 0 (0.0%) |
Disability Class: Vision Difficulty
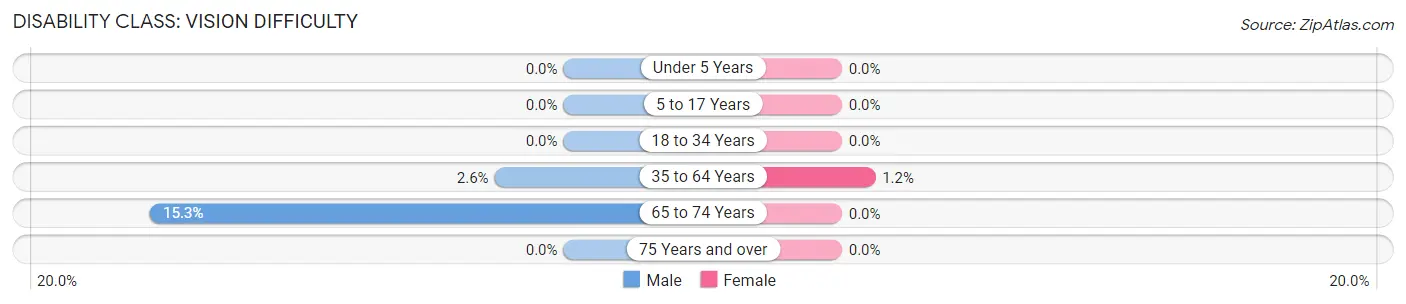
| Age Bracket | Male | Female |
| Under 5 Years | 0 (0.0%) | 0 (0.0%) |
| 5 to 17 Years | 0 (0.0%) | 0 (0.0%) |
| 18 to 34 Years | 0 (0.0%) | 0 (0.0%) |
| 35 to 64 Years | 24 (2.6%) | 11 (1.2%) |
| 65 to 74 Years | 27 (15.3%) | 0 (0.0%) |
| 75 Years and over | 0 (0.0%) | 0 (0.0%) |
Disability Class: Cognitive Difficulty
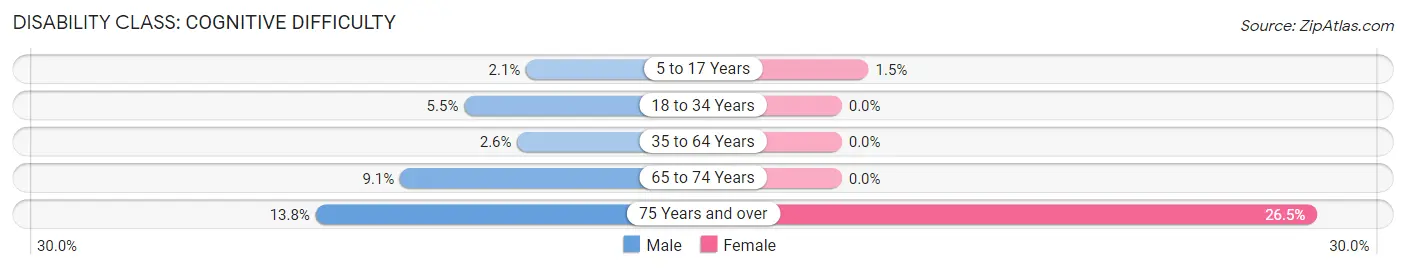
| Age Bracket | Male | Female |
| 5 to 17 Years | 11 (2.1%) | 7 (1.5%) |
| 18 to 34 Years | 34 (5.5%) | 0 (0.0%) |
| 35 to 64 Years | 24 (2.6%) | 0 (0.0%) |
| 65 to 74 Years | 16 (9.1%) | 0 (0.0%) |
| 75 Years and over | 16 (13.8%) | 18 (26.5%) |
Disability Class: Ambulatory Difficulty
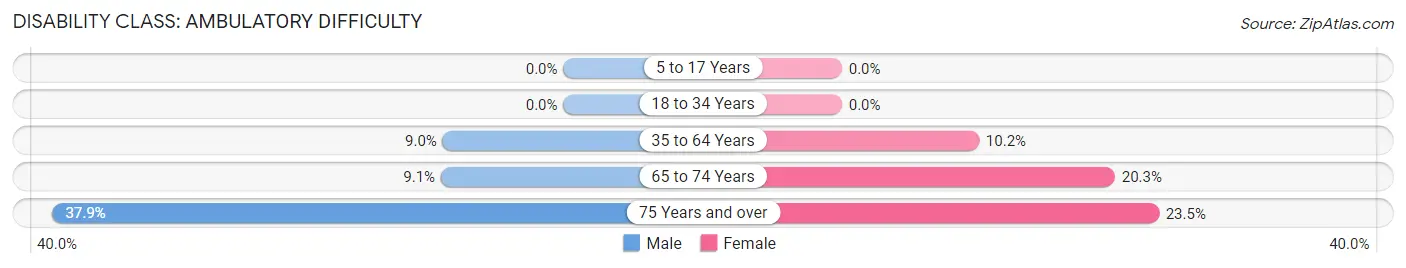
| Age Bracket | Male | Female |
| 5 to 17 Years | 0 (0.0%) | 0 (0.0%) |
| 18 to 34 Years | 0 (0.0%) | 0 (0.0%) |
| 35 to 64 Years | 84 (9.0%) | 90 (10.2%) |
| 65 to 74 Years | 16 (9.1%) | 45 (20.3%) |
| 75 Years and over | 44 (37.9%) | 16 (23.5%) |
Disability Class: Self-Care Difficulty
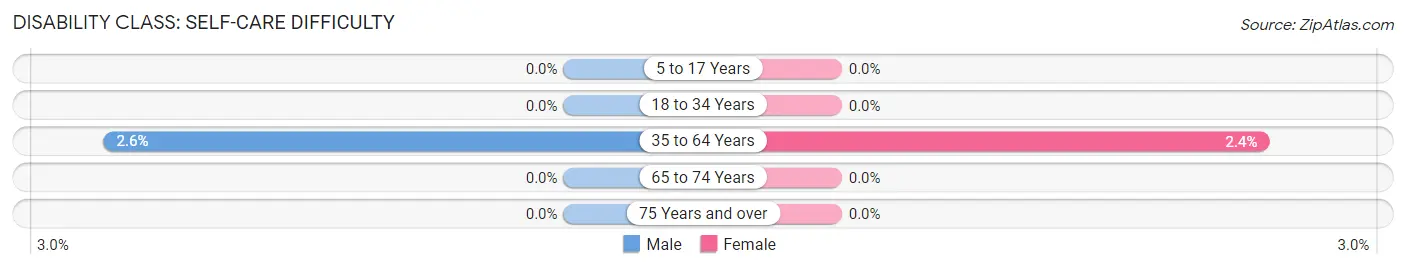
| Age Bracket | Male | Female |
| 5 to 17 Years | 0 (0.0%) | 0 (0.0%) |
| 18 to 34 Years | 0 (0.0%) | 0 (0.0%) |
| 35 to 64 Years | 24 (2.6%) | 21 (2.4%) |
| 65 to 74 Years | 0 (0.0%) | 0 (0.0%) |
| 75 Years and over | 0 (0.0%) | 0 (0.0%) |
Technology Access in Union Grove
Computing Device Access in Union Grove
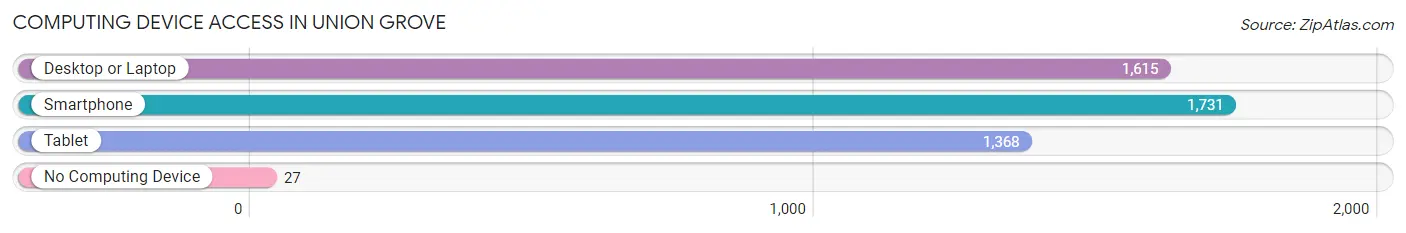
| Device Type | # Households | % Households |
| Desktop or Laptop | 1,615 | 86.6% |
| Smartphone | 1,731 | 92.8% |
| Tablet | 1,368 | 73.3% |
| No Computing Device | 27 | 1.5% |
| Total | 1,866 | 100.0% |
Internet Access in Union Grove
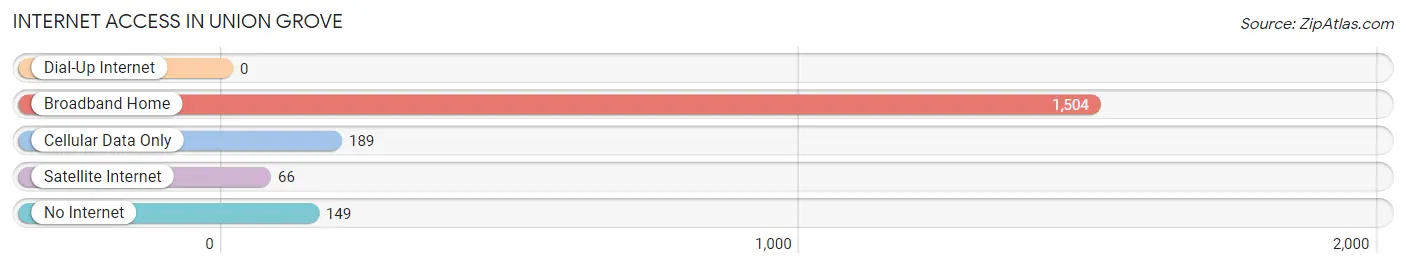
| Internet Type | # Households | % Households |
| Dial-Up Internet | 0 | 0.0% |
| Broadband Home | 1,504 | 80.6% |
| Cellular Data Only | 189 | 10.1% |
| Satellite Internet | 66 | 3.5% |
| No Internet | 149 | 8.0% |
| Total | 1,866 | 100.0% |
Union Grove Summary
History
Union Grove, Wisconsin is a small village located in Racine County, Wisconsin. It is situated on the banks of the Fox River, about 25 miles south of Milwaukee. The village was first settled in 1836 by a group of settlers from New York. The settlers were attracted to the area due to its fertile soil and abundant natural resources. The village was originally known as Unionville, but was later changed to Union Grove in 1845.
The village was incorporated in 1846 and quickly grew in population. By the late 1800s, Union Grove had become a thriving agricultural community. The village was home to several large farms, as well as a number of small businesses. The village also had a number of churches, schools, and other civic organizations.
In the early 1900s, Union Grove began to experience a period of growth and prosperity. The village was home to several factories, including a paper mill, a canning factory, and a brickyard. The village also had a number of stores, restaurants, and other businesses.
Geography
Union Grove is located in Racine County, Wisconsin. It is situated on the banks of the Fox River, about 25 miles south of Milwaukee. The village is located in the southeastern corner of the county, near the border with Kenosha County.
The village is surrounded by rolling hills and farmland. The Fox River runs through the village, providing a scenic backdrop. The village is also home to several parks, including Union Grove Park and Union Grove State Park.
Economy
Union Grove has a diverse economy. The village is home to several small businesses, including restaurants, retail stores, and service providers. The village also has a number of manufacturing and industrial businesses, including a paper mill, a canning factory, and a brickyard.
The village is also home to several farms, which produce a variety of crops, including corn, soybeans, and wheat. The village also has a number of recreational activities, including fishing, boating, and camping.
Demographics
As of the 2010 census, the population of Union Grove was 4,717. The village has a median age of 38.7 years, with a gender ratio of 49.3% male and 50.7% female. The median household income is $50,945, and the median home value is $179,400.
The village is predominantly white, with a population that is 94.3% white, 1.3% African American, 1.2% Hispanic, and 1.2% Asian. The village also has a small population of Native Americans, at 0.2%.
Conclusion
Union Grove, Wisconsin is a small village located in Racine County, Wisconsin. It is situated on the banks of the Fox River, about 25 miles south of Milwaukee. The village was first settled in 1836 by a group of settlers from New York. The village has a diverse economy, with a number of small businesses, manufacturing and industrial businesses, and farms. The village has a population of 4,717, with a median age of 38.7 years and a median household income of $50,945. The village is predominantly white, with a population that is 94.3% white, 1.3% African American, 1.2% Hispanic, and 1.2% Asian.
Common Questions
What is Per Capita Income in Union Grove?
Per Capita income in Union Grove is $39,143.
What is the Median Family Income in Union Grove?
Median Family Income in Union Grove is $103,422.
What is the Median Household income in Union Grove?
Median Household Income in Union Grove is $103,005.
What is Income or Wage Gap in Union Grove?
Income or Wage Gap in Union Grove is 44.7%.
Women in Union Grove earn 55.3 cents for every dollar earned by a man.
What is Inequality or Gini Index in Union Grove?
Inequality or Gini Index in Union Grove is 0.39.
What is the Total Population of Union Grove?
Total Population of Union Grove is 4,916.
What is the Total Male Population of Union Grove?
Total Male Population of Union Grove is 2,514.
What is the Total Female Population of Union Grove?
Total Female Population of Union Grove is 2,402.
What is the Ratio of Males per 100 Females in Union Grove?
There are 104.66 Males per 100 Females in Union Grove.
What is the Ratio of Females per 100 Males in Union Grove?
There are 95.54 Females per 100 Males in Union Grove.
What is the Median Population Age in Union Grove?
Median Population Age in Union Grove is 35.3 Years.
What is the Average Family Size in Union Grove
Average Family Size in Union Grove is 3.1 People.
What is the Average Household Size in Union Grove
Average Household Size in Union Grove is 2.6 People.
How Large is the Labor Force in Union Grove?
There are 2,692 People in the Labor Forcein in Union Grove.
What is the Percentage of People in the Labor Force in Union Grove?
71.3% of People are in the Labor Force in Union Grove.
What is the Unemployment Rate in Union Grove?
Unemployment Rate in Union Grove is 1.4%.