Hartford, WI Map & Demographics
Hartford Map
Hartford Overview
$35,960
PER CAPITA INCOME
$97,175
AVG FAMILY INCOME
$70,887
AVG HOUSEHOLD INCOME
32.4%
WAGE / INCOME GAP [ % ]
67.6¢/ $1
WAGE / INCOME GAP [ $ ]
0.39
INEQUALITY / GINI INDEX
15,667
TOTAL POPULATION
7,613
MALE POPULATION
8,054
FEMALE POPULATION
94.52
MALES / 100 FEMALES
105.79
FEMALES / 100 MALES
37.8
MEDIAN AGE
3.0
AVG FAMILY SIZE
2.4
AVG HOUSEHOLD SIZE
8,825
LABOR FORCE [ PEOPLE ]
71.3%
PERCENT IN LABOR FORCE
3.2%
UNEMPLOYMENT RATE
Hartford Zip Codes
Hartford Area Codes
Income in Hartford
Income Overview in Hartford
Per Capita Income in Hartford is $35,960, while median incomes of families and households are $97,175 and $70,887 respectively.
| Characteristic | Number | Measure |
| Per Capita Income | 15,667 | $35,960 |
| Median Family Income | 4,030 | $97,175 |
| Mean Family Income | 4,030 | $102,356 |
| Median Household Income | 6,380 | $70,887 |
| Mean Household Income | 6,380 | $85,902 |
| Income Deficit | 4,030 | $0 |
| Wage / Income Gap (%) | 15,667 | 32.43% |
| Wage / Income Gap ($) | 15,667 | 67.57¢ per $1 |
| Gini / Inequality Index | 15,667 | 0.39 |
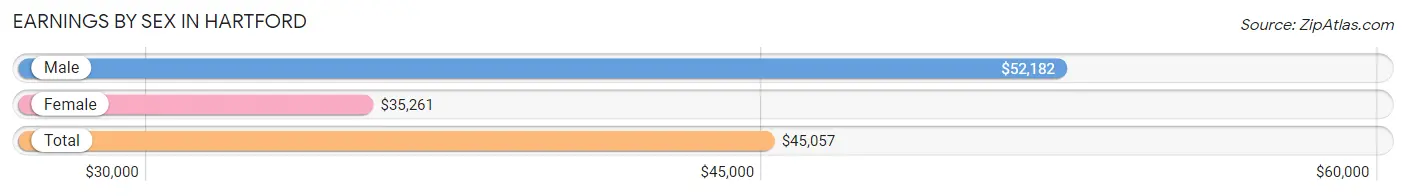
Earnings by Sex in Hartford
Average Earnings in Hartford are $45,057, $52,182 for men and $35,261 for women, a difference of 32.4%.
| Sex | Number | Average Earnings |
| Male | 4,670 (50.6%) | $52,182 |
| Female | 4,553 (49.4%) | $35,261 |
| Total | 9,223 (100.0%) | $45,057 |
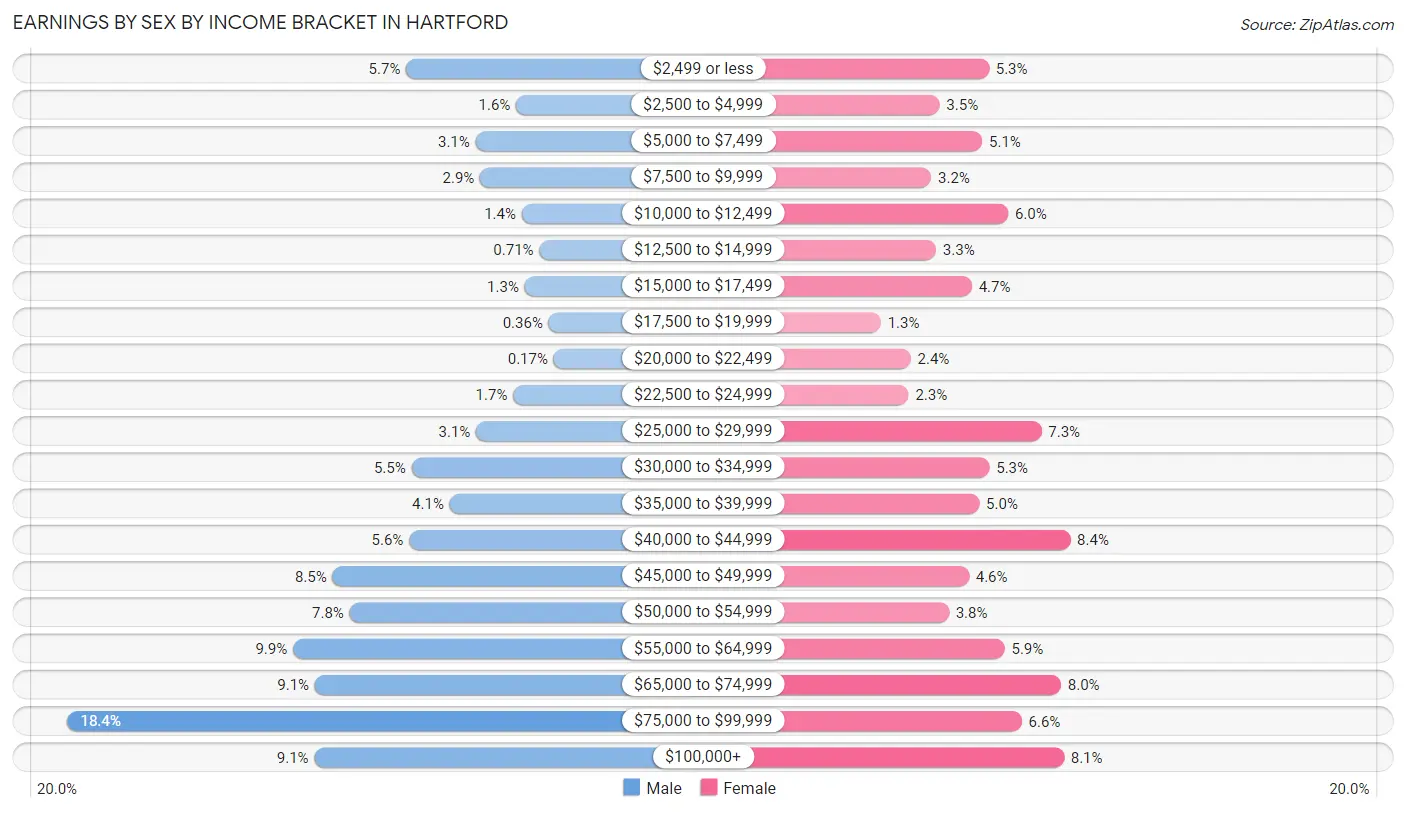
Earnings by Sex by Income Bracket in Hartford
The most common earnings brackets in Hartford are $75,000 to $99,999 for men (859 | 18.4%) and $40,000 to $44,999 for women (381 | 8.4%).
| Income | Male | Female |
| $2,499 or less | 266 (5.7%) | 242 (5.3%) |
| $2,500 to $4,999 | 74 (1.6%) | 158 (3.5%) |
| $5,000 to $7,499 | 145 (3.1%) | 231 (5.1%) |
| $7,500 to $9,999 | 137 (2.9%) | 144 (3.2%) |
| $10,000 to $12,499 | 64 (1.4%) | 275 (6.0%) |
| $12,500 to $14,999 | 33 (0.7%) | 152 (3.3%) |
| $15,000 to $17,499 | 59 (1.3%) | 213 (4.7%) |
| $17,500 to $19,999 | 17 (0.4%) | 58 (1.3%) |
| $20,000 to $22,499 | 8 (0.2%) | 109 (2.4%) |
| $22,500 to $24,999 | 79 (1.7%) | 105 (2.3%) |
| $25,000 to $29,999 | 144 (3.1%) | 332 (7.3%) |
| $30,000 to $34,999 | 257 (5.5%) | 243 (5.3%) |
| $35,000 to $39,999 | 190 (4.1%) | 226 (5.0%) |
| $40,000 to $44,999 | 261 (5.6%) | 381 (8.4%) |
| $45,000 to $49,999 | 395 (8.5%) | 208 (4.6%) |
| $50,000 to $54,999 | 365 (7.8%) | 174 (3.8%) |
| $55,000 to $64,999 | 464 (9.9%) | 269 (5.9%) |
| $65,000 to $74,999 | 426 (9.1%) | 365 (8.0%) |
| $75,000 to $99,999 | 859 (18.4%) | 298 (6.6%) |
| $100,000+ | 427 (9.1%) | 370 (8.1%) |
| Total | 4,670 (100.0%) | 4,553 (100.0%) |
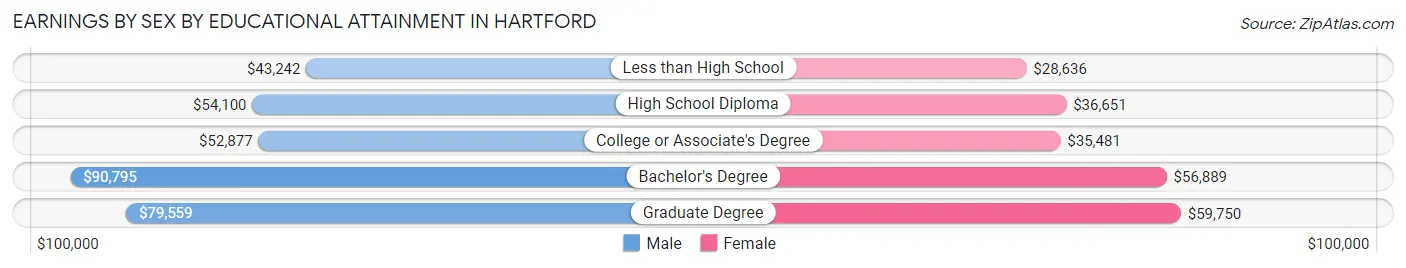
Earnings by Sex by Educational Attainment in Hartford
Average earnings in Hartford are $59,435 for men and $42,475 for women, a difference of 28.5%. Men with an educational attainment of bachelor's degree enjoy the highest average annual earnings of $90,795, while those with less than high school education earn the least with $43,242. Women with an educational attainment of graduate degree earn the most with the average annual earnings of $59,750, while those with less than high school education have the smallest earnings of $28,636.
| Educational Attainment | Male Income | Female Income |
| Less than High School | $43,242 | $28,636 |
| High School Diploma | $54,100 | $36,651 |
| College or Associate's Degree | $52,877 | $35,481 |
| Bachelor's Degree | $90,795 | $56,889 |
| Graduate Degree | $79,559 | $59,750 |
| Total | $59,435 | $42,475 |
Family Income in Hartford
Family Income Brackets in Hartford
According to the Hartford family income data, there are 1,136 families falling into the $100,000 to $149,999 income range, which is the most common income bracket and makes up 28.2% of all families. Conversely, the less than $10,000 income bracket is the least frequent group with only 77 families (1.9%) belonging to this category.
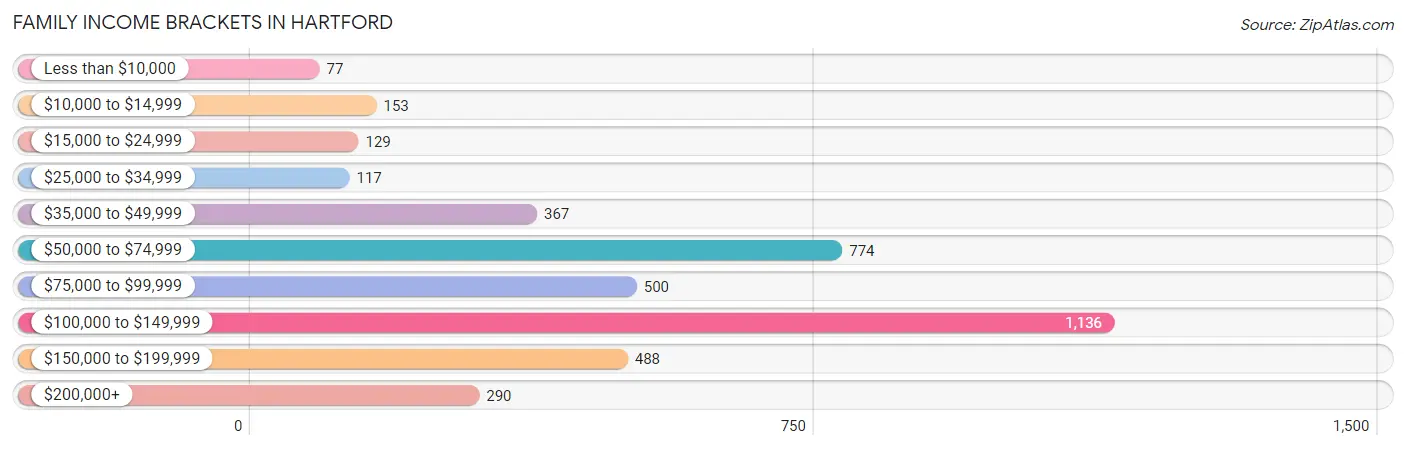
| Income Bracket | # Families | % Families |
| Less than $10,000 | 77 | 1.9% |
| $10,000 to $14,999 | 153 | 3.8% |
| $15,000 to $24,999 | 129 | 3.2% |
| $25,000 to $34,999 | 117 | 2.9% |
| $35,000 to $49,999 | 367 | 9.1% |
| $50,000 to $74,999 | 774 | 19.2% |
| $75,000 to $99,999 | 500 | 12.4% |
| $100,000 to $149,999 | 1,136 | 28.2% |
| $150,000 to $199,999 | 488 | 12.1% |
| $200,000+ | 290 | 7.2% |
Family Income by Famaliy Size in Hartford
6-person families (76 | 1.9%) account for the highest median family income in Hartford with $154,189 per family, while 4-person families (852 | 21.1%) have the highest median income of $33,950 per family member.
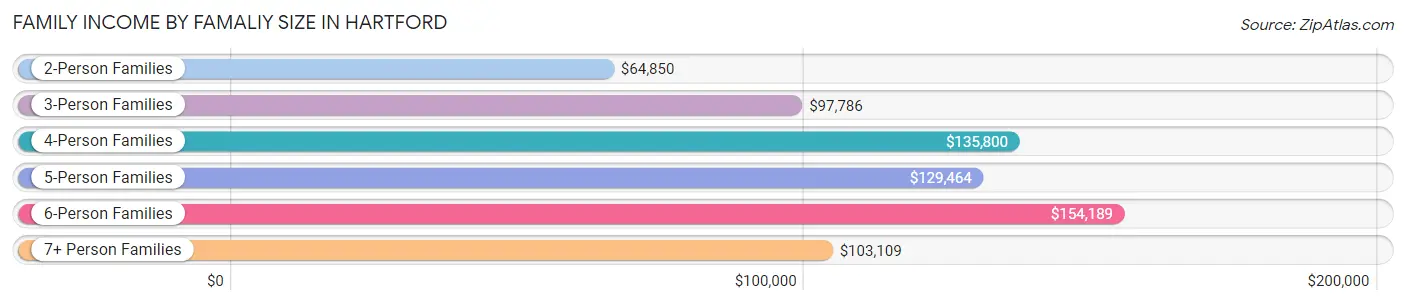
| Income Bracket | # Families | Median Income |
| 2-Person Families | 1,990 (49.4%) | $64,850 |
| 3-Person Families | 718 (17.8%) | $97,786 |
| 4-Person Families | 852 (21.1%) | $135,800 |
| 5-Person Families | 325 (8.1%) | $129,464 |
| 6-Person Families | 76 (1.9%) | $154,189 |
| 7+ Person Families | 69 (1.7%) | $103,109 |
| Total | 4,030 (100.0%) | $97,175 |
Family Income by Number of Earners in Hartford
The median family income in Hartford is $97,175, with families comprising 3+ earners (573) having the highest median family income of $136,042, while families with no earners (497) have the lowest median family income of $53,842, accounting for 14.2% and 12.3% of families, respectively.
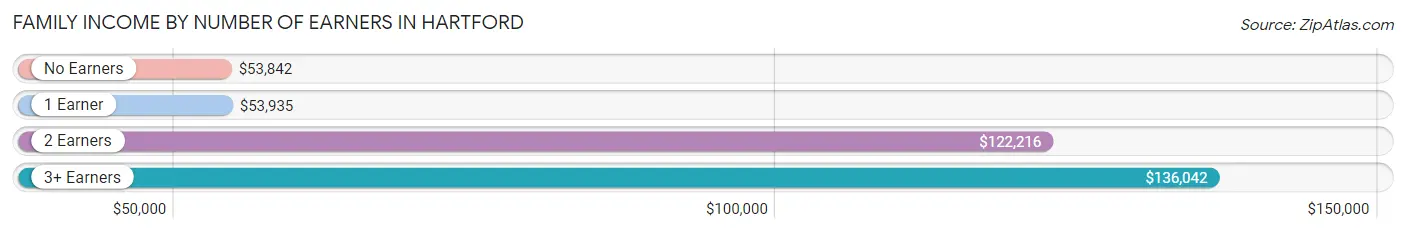
| Number of Earners | # Families | Median Income |
| No Earners | 497 (12.3%) | $53,842 |
| 1 Earner | 1,100 (27.3%) | $53,935 |
| 2 Earners | 1,860 (46.2%) | $122,216 |
| 3+ Earners | 573 (14.2%) | $136,042 |
| Total | 4,030 (100.0%) | $97,175 |
Household Income in Hartford
Household Income Brackets in Hartford
With 1,270 households falling in the category, the $100,000 to $149,999 income range is the most frequent in Hartford, accounting for 19.9% of all households. In contrast, only 249 households (3.9%) fall into the less than $10,000 income bracket, making it the least populous group.
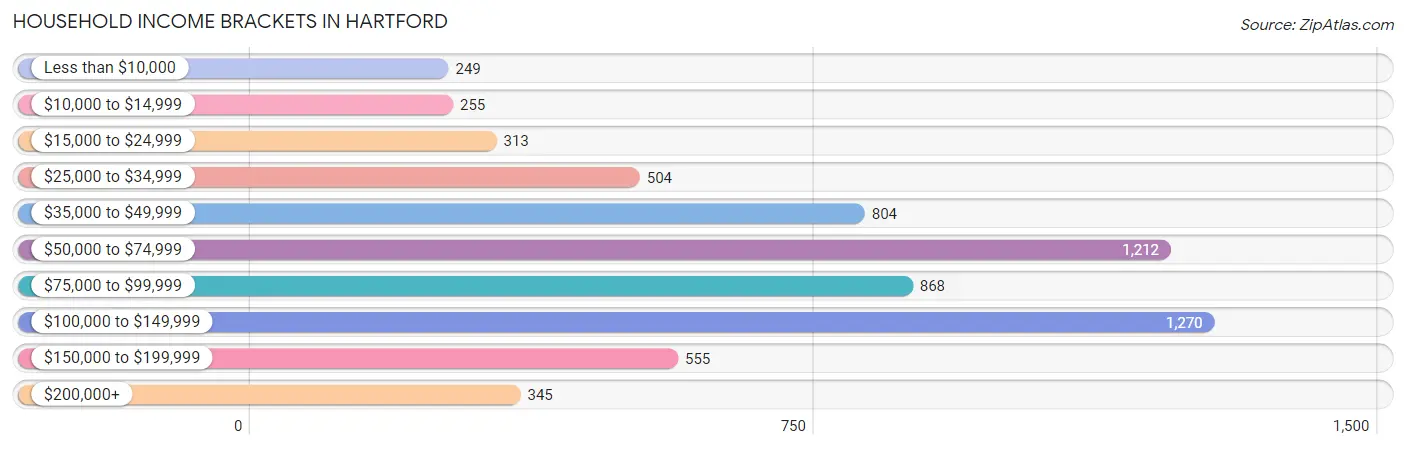
| Income Bracket | # Households | % Households |
| Less than $10,000 | 249 | 3.9% |
| $10,000 to $14,999 | 255 | 4.0% |
| $15,000 to $24,999 | 313 | 4.9% |
| $25,000 to $34,999 | 504 | 7.9% |
| $35,000 to $49,999 | 804 | 12.6% |
| $50,000 to $74,999 | 1,212 | 19.0% |
| $75,000 to $99,999 | 868 | 13.6% |
| $100,000 to $149,999 | 1,270 | 19.9% |
| $150,000 to $199,999 | 555 | 8.7% |
| $200,000+ | 345 | 5.4% |
Household Income by Householder Age in Hartford
The median household income in Hartford is $70,887, with the highest median household income of $98,382 found in the 45 to 64 years age bracket for the primary householder. A total of 2,188 households (34.3%) fall into this category. Meanwhile, the 15 to 24 years age bracket for the primary householder has the lowest median household income of $40,500, with 416 households (6.5%) in this group.
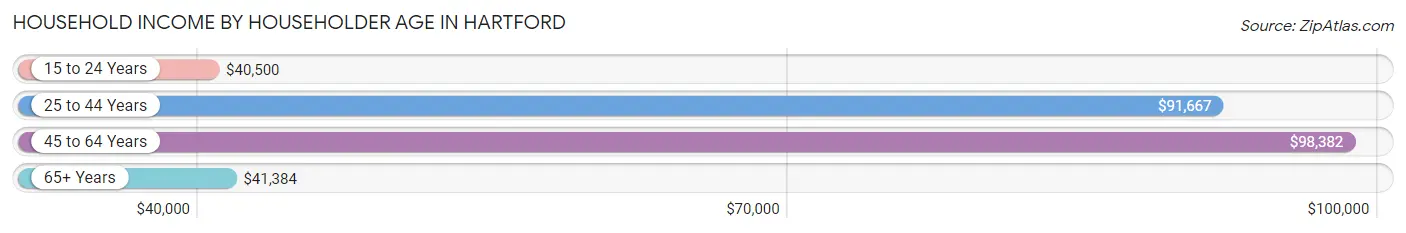
| Income Bracket | # Households | Median Income |
| 15 to 24 Years | 416 (6.5%) | $40,500 |
| 25 to 44 Years | 2,094 (32.8%) | $91,667 |
| 45 to 64 Years | 2,188 (34.3%) | $98,382 |
| 65+ Years | 1,682 (26.4%) | $41,384 |
| Total | 6,380 (100.0%) | $70,887 |
Poverty in Hartford
Income Below Poverty by Sex and Age in Hartford
With 7.7% poverty level for males and 9.7% for females among the residents of Hartford, 16 and 17 year old males and 25 to 34 year old females are the most vulnerable to poverty, with 98 males (30.0%) and 228 females (22.9%) in their respective age groups living below the poverty level.
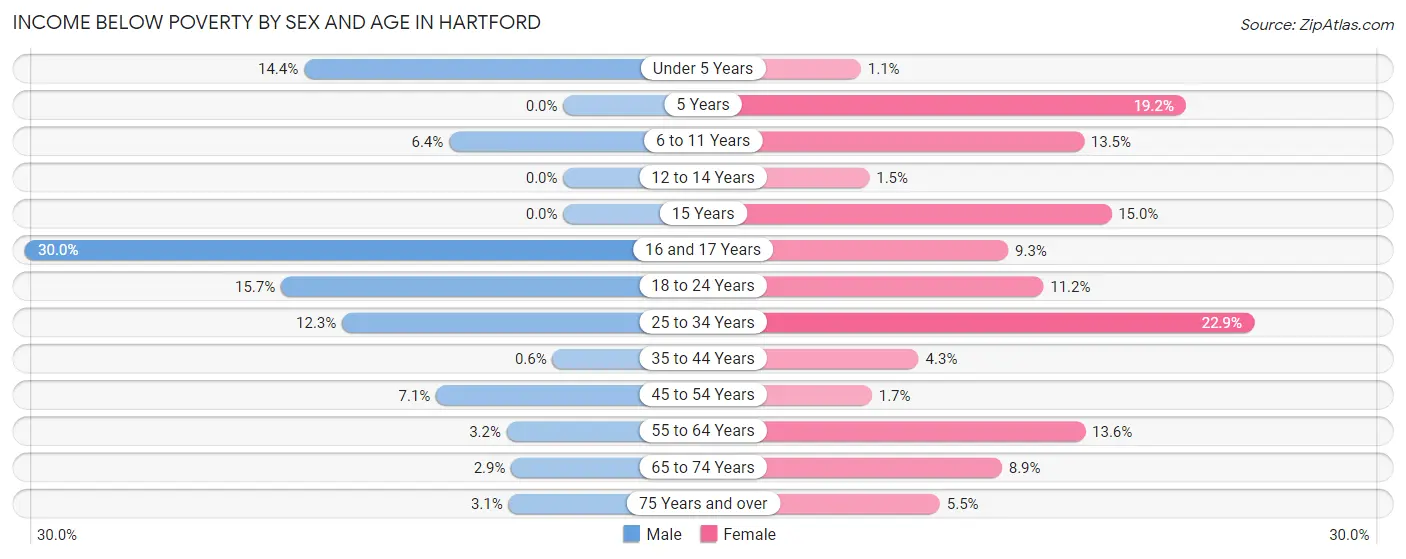
| Age Bracket | Male | Female |
| Under 5 Years | 78 (14.4%) | 3 (1.1%) |
| 5 Years | 0 (0.0%) | 18 (19.2%) |
| 6 to 11 Years | 41 (6.4%) | 117 (13.5%) |
| 12 to 14 Years | 0 (0.0%) | 5 (1.5%) |
| 15 Years | 0 (0.0%) | 6 (15.0%) |
| 16 and 17 Years | 98 (30.0%) | 20 (9.3%) |
| 18 to 24 Years | 97 (15.7%) | 95 (11.2%) |
| 25 to 34 Years | 130 (12.3%) | 228 (22.9%) |
| 35 to 44 Years | 6 (0.6%) | 51 (4.3%) |
| 45 to 54 Years | 82 (7.1%) | 14 (1.7%) |
| 55 to 64 Years | 26 (3.2%) | 123 (13.6%) |
| 65 to 74 Years | 14 (2.9%) | 57 (8.9%) |
| 75 Years and over | 14 (3.0%) | 41 (5.5%) |
| Total | 586 (7.7%) | 778 (9.7%) |
Income Above Poverty by Sex and Age in Hartford
According to the poverty statistics in Hartford, males aged 12 to 14 years and females aged under 5 years are the age groups that are most secure financially, with 100.0% of males and 98.9% of females in these age groups living above the poverty line.
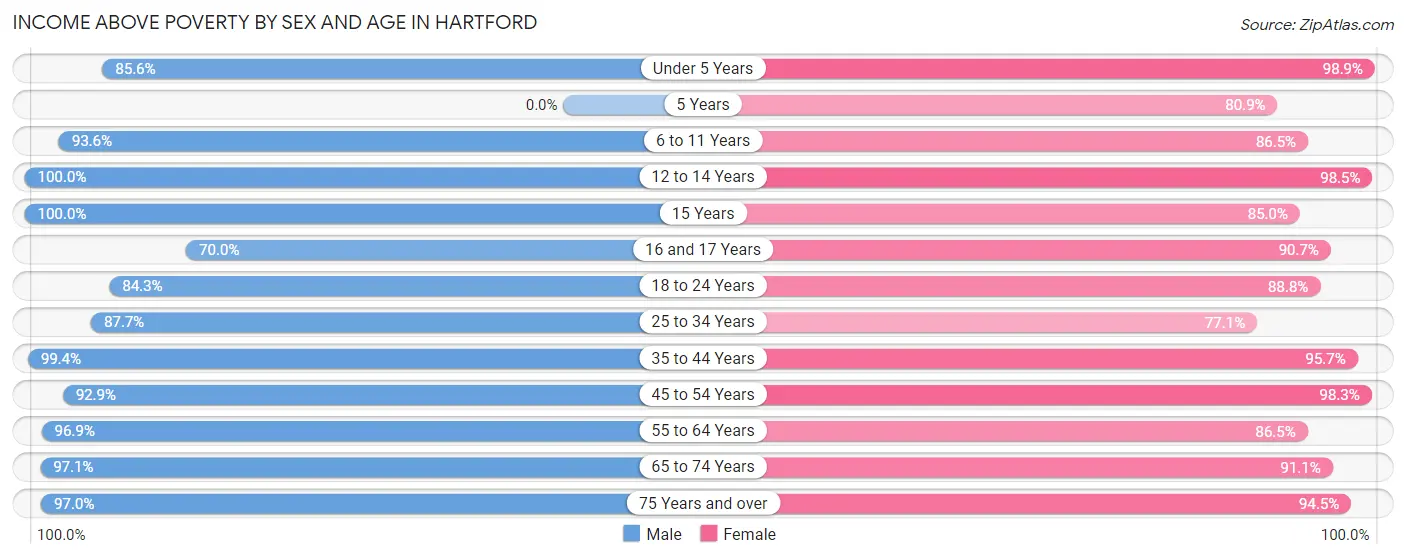
| Age Bracket | Male | Female |
| Under 5 Years | 462 (85.6%) | 279 (98.9%) |
| 5 Years | 0 (0.0%) | 76 (80.8%) |
| 6 to 11 Years | 604 (93.6%) | 751 (86.5%) |
| 12 to 14 Years | 393 (100.0%) | 321 (98.5%) |
| 15 Years | 67 (100.0%) | 34 (85.0%) |
| 16 and 17 Years | 229 (70.0%) | 196 (90.7%) |
| 18 to 24 Years | 520 (84.3%) | 752 (88.8%) |
| 25 to 34 Years | 925 (87.7%) | 766 (77.1%) |
| 35 to 44 Years | 988 (99.4%) | 1,140 (95.7%) |
| 45 to 54 Years | 1,077 (92.9%) | 822 (98.3%) |
| 55 to 64 Years | 800 (96.9%) | 785 (86.5%) |
| 65 to 74 Years | 468 (97.1%) | 583 (91.1%) |
| 75 Years and over | 445 (97.0%) | 710 (94.5%) |
| Total | 6,978 (92.2%) | 7,215 (90.3%) |
Income Below Poverty Among Married-Couple Families in Hartford
The poverty statistics for married-couple families in Hartford show that 0.8% or 25 of the total 3,007 families live below the poverty line. Families with 3 or 4 children have the highest poverty rate of 1.5%, comprising of 6 families. On the other hand, families with 5 or more children have the lowest poverty rate of 0.0%, which includes 0 families.
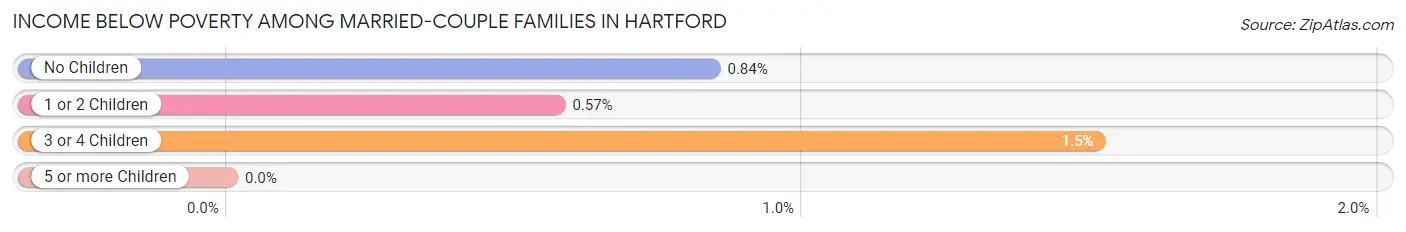
| Children | Above Poverty | Below Poverty |
| No Children | 1,533 (99.2%) | 13 (0.8%) |
| 1 or 2 Children | 1,050 (99.4%) | 6 (0.6%) |
| 3 or 4 Children | 392 (98.5%) | 6 (1.5%) |
| 5 or more Children | 7 (100.0%) | 0 (0.0%) |
| Total | 2,982 (99.2%) | 25 (0.8%) |
Income Below Poverty Among Single-Parent Households in Hartford
According to the poverty data in Hartford, 4.9% or 8 single-father households and 35.9% or 308 single-mother households are living below the poverty line. Among single-father households, those with no children have the highest poverty rate, with 8 households (9.9%) experiencing poverty. Likewise, among single-mother households, those with 1 or 2 children have the highest poverty rate, with 303 households (49.1%) falling below the poverty line.
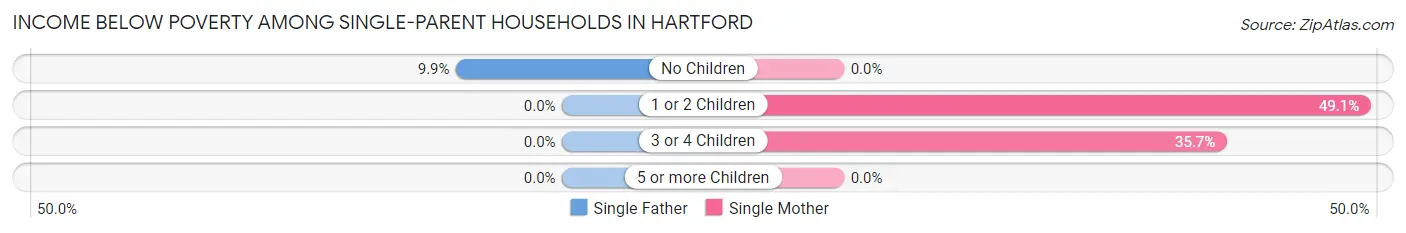
| Children | Single Father | Single Mother |
| No Children | 8 (9.9%) | 0 (0.0%) |
| 1 or 2 Children | 0 (0.0%) | 303 (49.1%) |
| 3 or 4 Children | 0 (0.0%) | 5 (35.7%) |
| 5 or more Children | 0 (0.0%) | 0 (0.0%) |
| Total | 8 (4.9%) | 308 (35.9%) |
Income Below Poverty Among Married-Couple vs Single-Parent Households in Hartford
The poverty data for Hartford shows that 25 of the married-couple family households (0.8%) and 316 of the single-parent households (30.9%) are living below the poverty level. Within the married-couple family households, those with 3 or 4 children have the highest poverty rate, with 6 households (1.5%) falling below the poverty line. Among the single-parent households, those with 1 or 2 children have the highest poverty rate, with 303 household (43.2%) living below poverty.
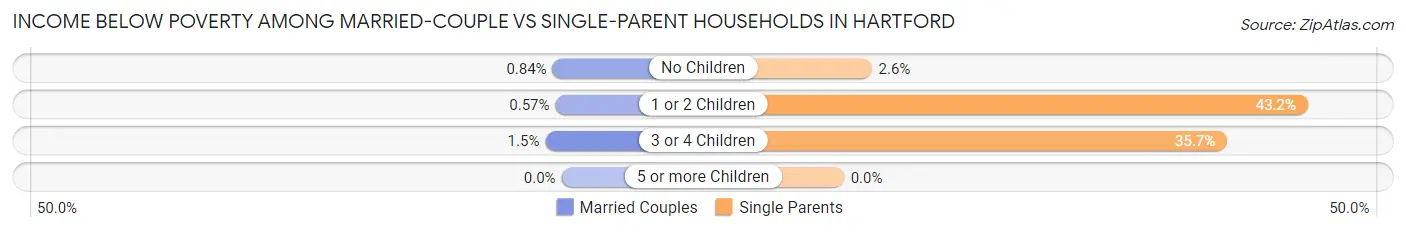
| Children | Married-Couple Families | Single-Parent Households |
| No Children | 13 (0.8%) | 8 (2.6%) |
| 1 or 2 Children | 6 (0.6%) | 303 (43.2%) |
| 3 or 4 Children | 6 (1.5%) | 5 (35.7%) |
| 5 or more Children | 0 (0.0%) | 0 (0.0%) |
| Total | 25 (0.8%) | 316 (30.9%) |
Race in Hartford
The most populous races in Hartford are White / Caucasian (14,139 | 90.2%), Two or more Races (774 | 4.9%), and Hispanic or Latino (747 | 4.8%).
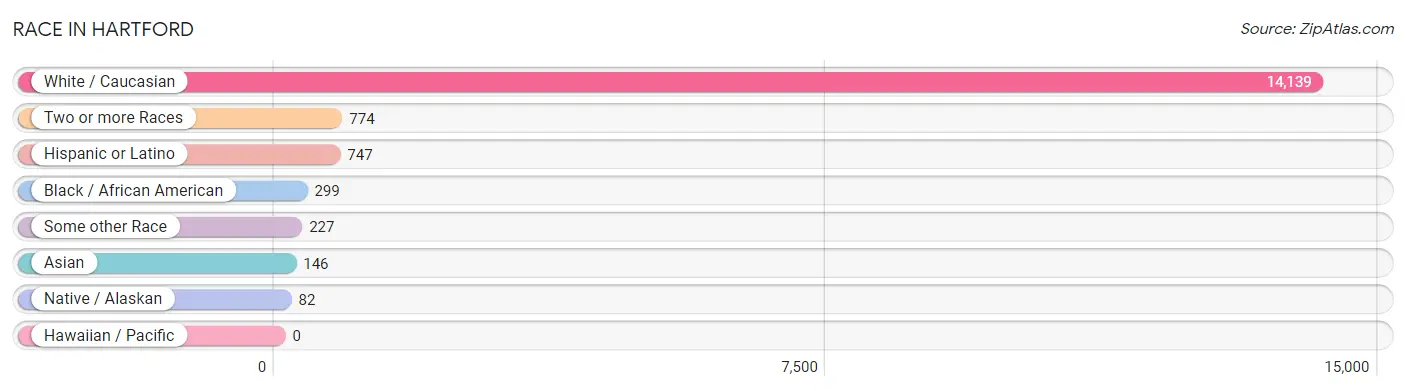
| Race | # Population | % Population |
| Asian | 146 | 0.9% |
| Black / African American | 299 | 1.9% |
| Hawaiian / Pacific | 0 | 0.0% |
| Hispanic or Latino | 747 | 4.8% |
| Native / Alaskan | 82 | 0.5% |
| White / Caucasian | 14,139 | 90.2% |
| Two or more Races | 774 | 4.9% |
| Some other Race | 227 | 1.5% |
| Total | 15,667 | 100.0% |
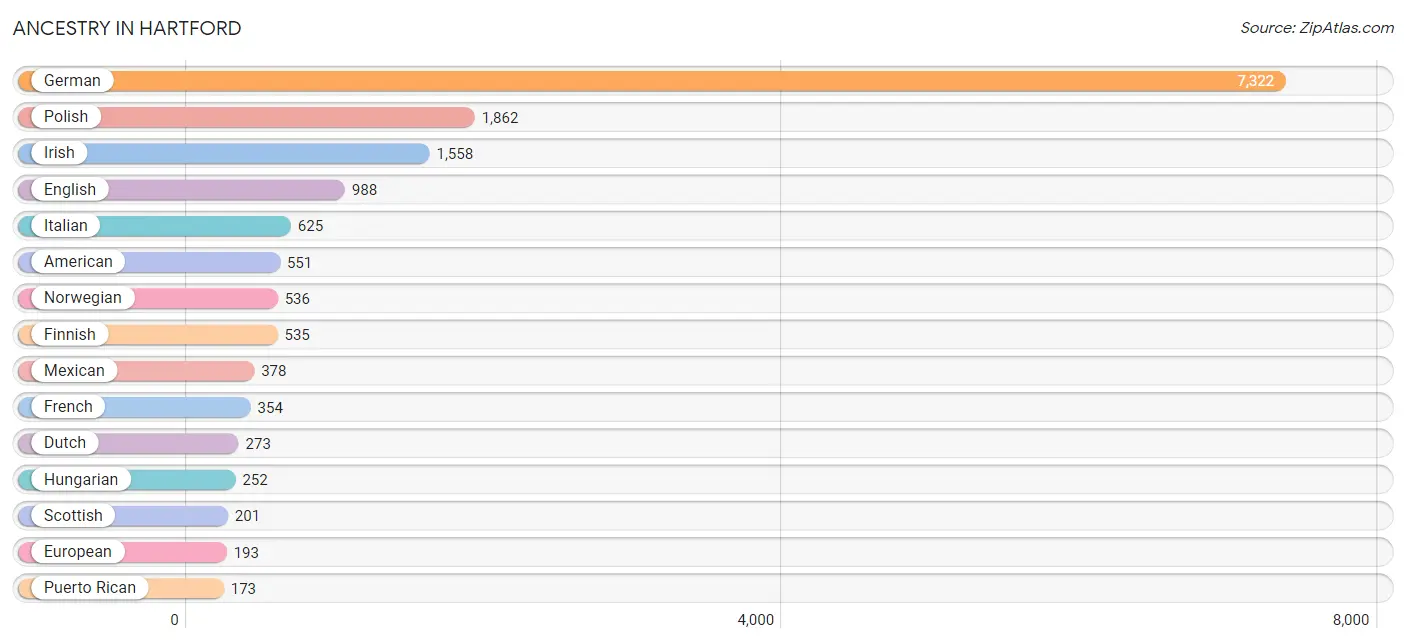
Ancestry in Hartford
The most populous ancestries reported in Hartford are German (7,322 | 46.7%), Polish (1,862 | 11.9%), Irish (1,558 | 9.9%), English (988 | 6.3%), and Italian (625 | 4.0%), together accounting for 78.9% of all Hartford residents.
| Ancestry | # Population | % Population |
| African | 14 | 0.1% |
| American | 551 | 3.5% |
| Apache | 63 | 0.4% |
| Austrian | 49 | 0.3% |
| Belgian | 16 | 0.1% |
| Bolivian | 46 | 0.3% |
| British | 25 | 0.2% |
| Burmese | 30 | 0.2% |
| Canadian | 14 | 0.1% |
| Central American | 57 | 0.4% |
| Cherokee | 19 | 0.1% |
| Chippewa | 137 | 0.9% |
| Comanche | 63 | 0.4% |
| Croatian | 32 | 0.2% |
| Czech | 31 | 0.2% |
| Czechoslovakian | 159 | 1.0% |
| Danish | 148 | 0.9% |
| Dutch | 273 | 1.7% |
| Eastern European | 18 | 0.1% |
| English | 988 | 6.3% |
| European | 193 | 1.2% |
| Finnish | 535 | 3.4% |
| French | 354 | 2.3% |
| French Canadian | 72 | 0.5% |
| German | 7,322 | 46.7% |
| Greek | 64 | 0.4% |
| Guatemalan | 57 | 0.4% |
| Hungarian | 252 | 1.6% |
| Icelander | 124 | 0.8% |
| Indian (Asian) | 73 | 0.5% |
| Irish | 1,558 | 9.9% |
| Iroquois | 27 | 0.2% |
| Italian | 625 | 4.0% |
| Korean | 119 | 0.8% |
| Lithuanian | 33 | 0.2% |
| Mexican | 378 | 2.4% |
| Mexican American Indian | 35 | 0.2% |
| Native Hawaiian | 23 | 0.2% |
| Nigerian | 34 | 0.2% |
| Northern European | 6 | 0.0% |
| Norwegian | 536 | 3.4% |
| Polish | 1,862 | 11.9% |
| Portuguese | 6 | 0.0% |
| Puerto Rican | 173 | 1.1% |
| Russian | 157 | 1.0% |
| Scandinavian | 19 | 0.1% |
| Scotch-Irish | 40 | 0.3% |
| Scottish | 201 | 1.3% |
| Slavic | 47 | 0.3% |
| Slovak | 27 | 0.2% |
| Slovene | 12 | 0.1% |
| South American | 79 | 0.5% |
| South American Indian | 46 | 0.3% |
| Spaniard | 27 | 0.2% |
| Spanish | 33 | 0.2% |
| Subsaharan African | 48 | 0.3% |
| Swedish | 156 | 1.0% |
| Swiss | 121 | 0.8% |
| Thai | 44 | 0.3% |
| Venezuelan | 33 | 0.2% |
| Welsh | 105 | 0.7% |
| Yugoslavian | 128 | 0.8% | View All 62 Rows |
Immigrants in Hartford
The most numerous immigrant groups reported in Hartford came from Latin America (156 | 1.0%), Europe (136 | 0.9%), Central America (117 | 0.7%), Mexico (85 | 0.5%), and Asia (64 | 0.4%), together accounting for 3.6% of all Hartford residents.
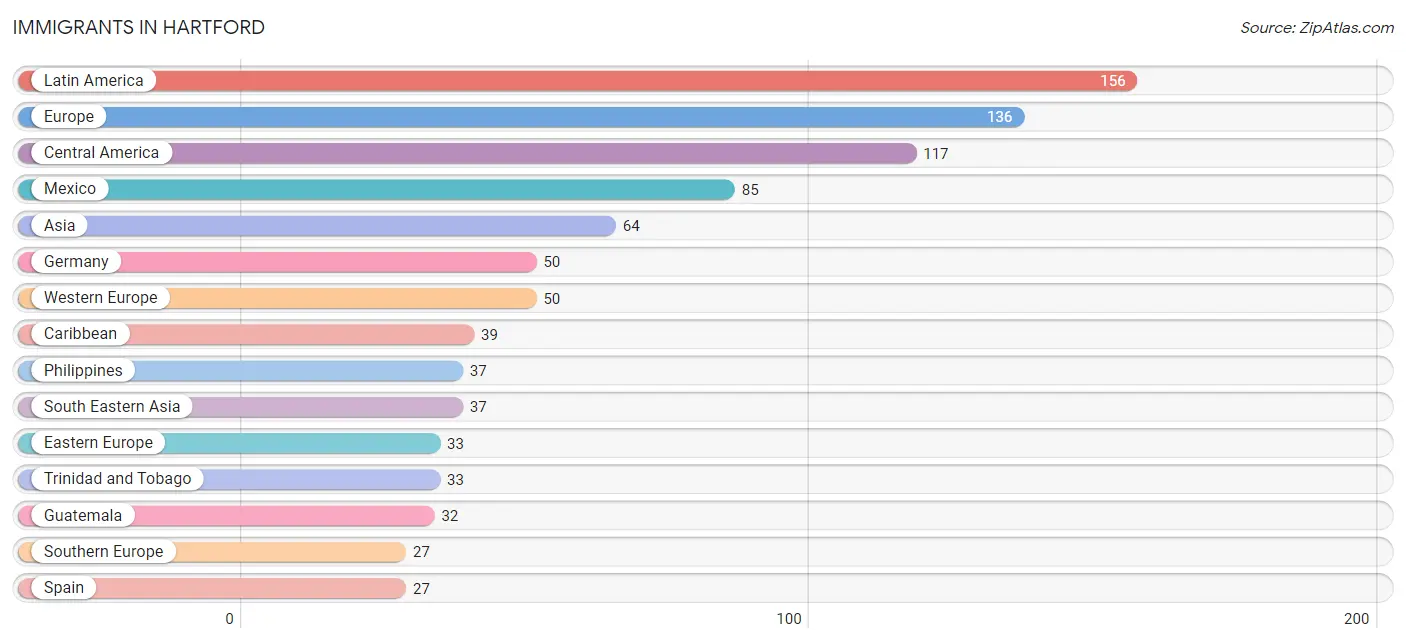
| Immigration Origin | # Population | % Population |
| Asia | 64 | 0.4% |
| Canada | 7 | 0.0% |
| Caribbean | 39 | 0.3% |
| Central America | 117 | 0.7% |
| China | 16 | 0.1% |
| Cuba | 6 | 0.0% |
| Czechoslovakia | 13 | 0.1% |
| Eastern Asia | 16 | 0.1% |
| Eastern Europe | 33 | 0.2% |
| Europe | 136 | 0.9% |
| Germany | 50 | 0.3% |
| Guatemala | 32 | 0.2% |
| India | 11 | 0.1% |
| Latin America | 156 | 1.0% |
| Mexico | 85 | 0.5% |
| Northern Europe | 26 | 0.2% |
| Philippines | 37 | 0.2% |
| Russia | 20 | 0.1% |
| South Central Asia | 11 | 0.1% |
| South Eastern Asia | 37 | 0.2% |
| Southern Europe | 27 | 0.2% |
| Spain | 27 | 0.2% |
| Taiwan | 16 | 0.1% |
| Trinidad and Tobago | 33 | 0.2% |
| Western Europe | 50 | 0.3% | View All 25 Rows |
Sex and Age in Hartford
Sex and Age in Hartford
The most populous age groups in Hartford are 25 to 29 Years (680 | 8.9%) for men and 10 to 14 Years (692 | 8.6%) for women.
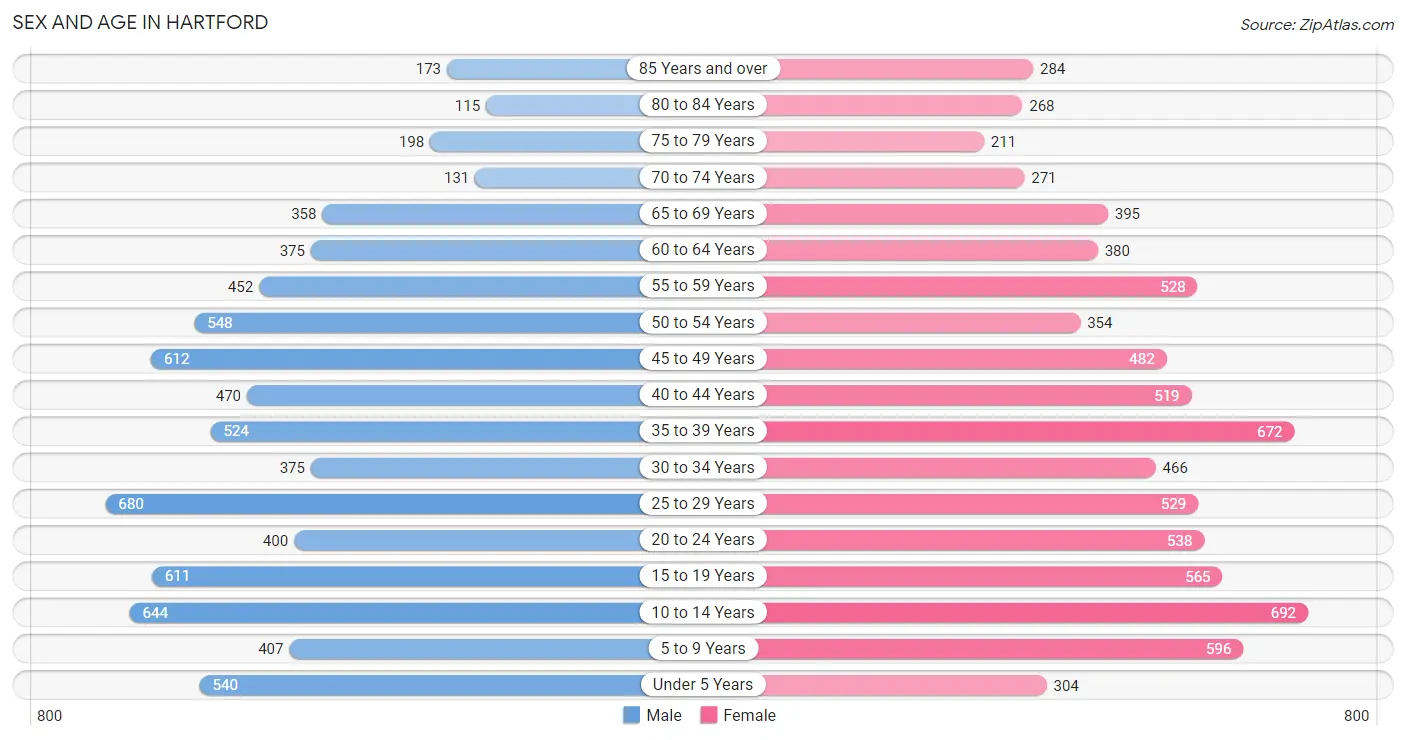
| Age Bracket | Male | Female |
| Under 5 Years | 540 (7.1%) | 304 (3.8%) |
| 5 to 9 Years | 407 (5.3%) | 596 (7.4%) |
| 10 to 14 Years | 644 (8.5%) | 692 (8.6%) |
| 15 to 19 Years | 611 (8.0%) | 565 (7.0%) |
| 20 to 24 Years | 400 (5.2%) | 538 (6.7%) |
| 25 to 29 Years | 680 (8.9%) | 529 (6.6%) |
| 30 to 34 Years | 375 (4.9%) | 466 (5.8%) |
| 35 to 39 Years | 524 (6.9%) | 672 (8.3%) |
| 40 to 44 Years | 470 (6.2%) | 519 (6.4%) |
| 45 to 49 Years | 612 (8.0%) | 482 (6.0%) |
| 50 to 54 Years | 548 (7.2%) | 354 (4.4%) |
| 55 to 59 Years | 452 (5.9%) | 528 (6.6%) |
| 60 to 64 Years | 375 (4.9%) | 380 (4.7%) |
| 65 to 69 Years | 358 (4.7%) | 395 (4.9%) |
| 70 to 74 Years | 131 (1.7%) | 271 (3.4%) |
| 75 to 79 Years | 198 (2.6%) | 211 (2.6%) |
| 80 to 84 Years | 115 (1.5%) | 268 (3.3%) |
| 85 Years and over | 173 (2.3%) | 284 (3.5%) |
| Total | 7,613 (100.0%) | 8,054 (100.0%) |
Families and Households in Hartford
Median Family Size in Hartford
The median family size in Hartford is 3.04 persons per family, with married-couple families (3,007 | 74.6%) accounting for the largest median family size of 3.28 persons per family. On the other hand, single female/mother families (858 | 21.3%) represent the smallest median family size with 2.28 persons per family.
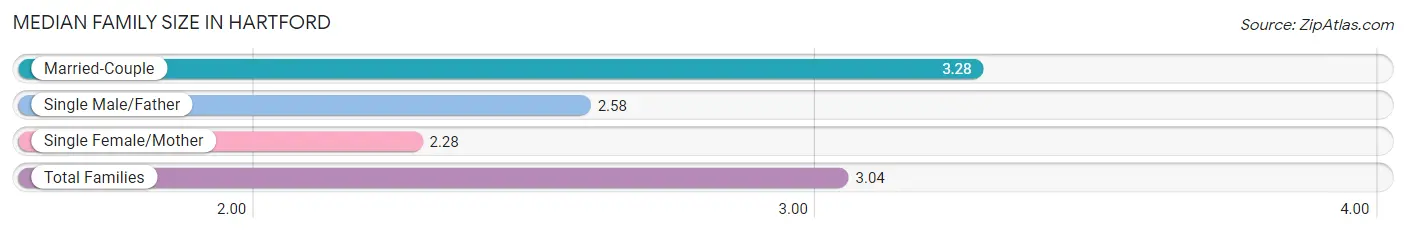
| Family Type | # Families | Family Size |
| Married-Couple | 3,007 (74.6%) | 3.28 |
| Single Male/Father | 165 (4.1%) | 2.58 |
| Single Female/Mother | 858 (21.3%) | 2.28 |
| Total Families | 4,030 (100.0%) | 3.04 |
Median Household Size in Hartford
The median household size in Hartford is 2.44 persons per household, with married-couple households (3,007 | 47.1%) accounting for the largest median household size of 3.3 persons per household. non-family households (2,350 | 36.8%) represent the smallest median household size with 1.29 persons per household.
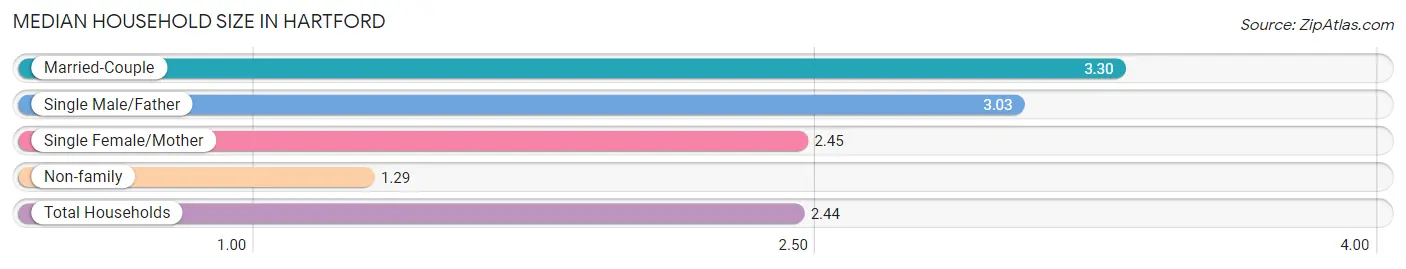
| Household Type | # Households | Household Size |
| Married-Couple | 3,007 (47.1%) | 3.30 |
| Single Male/Father | 165 (2.6%) | 3.03 |
| Single Female/Mother | 858 (13.5%) | 2.45 |
| Non-family | 2,350 (36.8%) | 1.29 |
| Total Households | 6,380 (100.0%) | 2.44 |
Household Size by Marriage Status in Hartford
Out of a total of 6,380 households in Hartford, 4,030 (63.2%) are family households, while 2,350 (36.8%) are nonfamily households. The most numerous type of family households are 2-person households, comprising 1,772, and the most common type of nonfamily households are 1-person households, comprising 1,794.
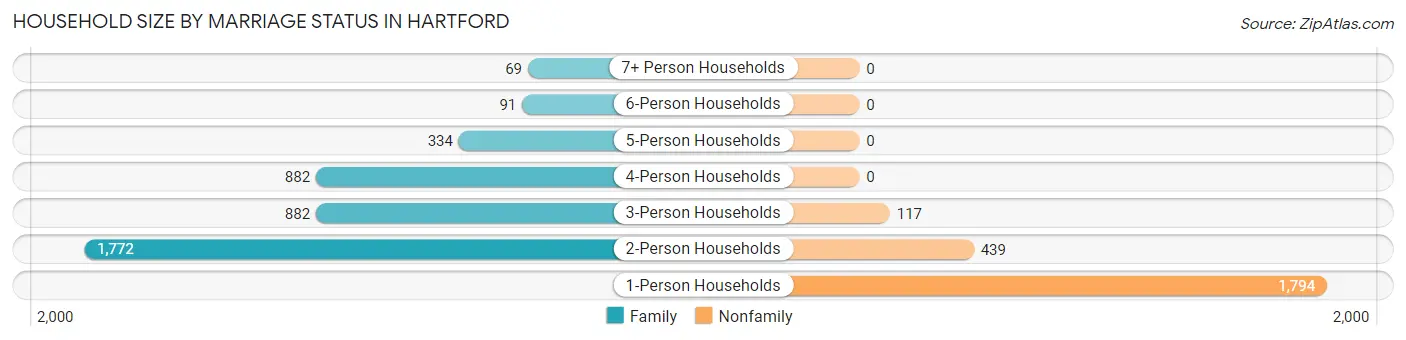
| Household Size | Family Households | Nonfamily Households |
| 1-Person Households | - | 1,794 (28.1%) |
| 2-Person Households | 1,772 (27.8%) | 439 (6.9%) |
| 3-Person Households | 882 (13.8%) | 117 (1.8%) |
| 4-Person Households | 882 (13.8%) | 0 (0.0%) |
| 5-Person Households | 334 (5.2%) | 0 (0.0%) |
| 6-Person Households | 91 (1.4%) | 0 (0.0%) |
| 7+ Person Households | 69 (1.1%) | 0 (0.0%) |
| Total | 4,030 (63.2%) | 2,350 (36.8%) |
Female Fertility in Hartford
Fertility by Age in Hartford
Average fertility rate in Hartford is 50.0 births per 1,000 women. Women in the age bracket of 20 to 34 years have the highest fertility rate with 102.0 births per 1,000 women. Women in the age bracket of 20 to 34 years acount for 80.4% of all women with births.
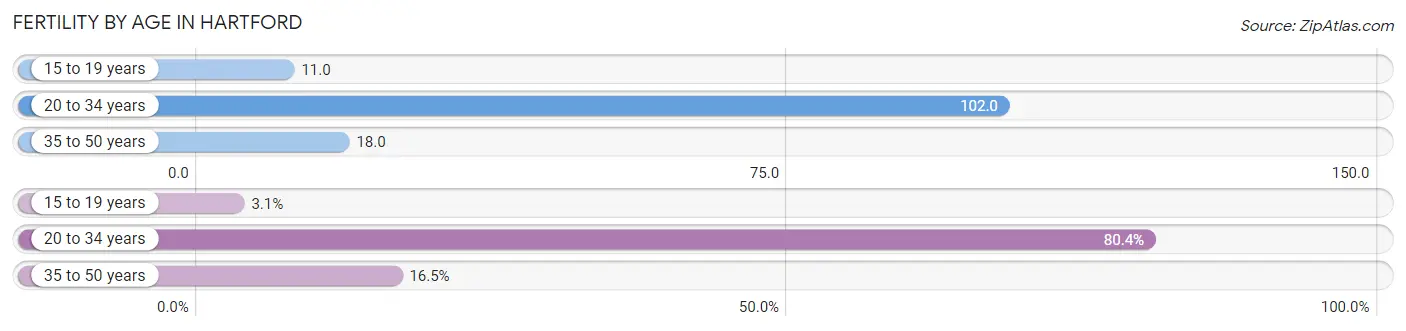
| Age Bracket | Women with Births | Births / 1,000 Women |
| 15 to 19 years | 6 (3.1%) | 11.0 |
| 20 to 34 years | 156 (80.4%) | 102.0 |
| 35 to 50 years | 32 (16.5%) | 18.0 |
| Total | 194 (100.0%) | 50.0 |
Fertility by Age by Marriage Status in Hartford
69.6% of women with births (194) in Hartford are married. The highest percentage of unmarried women with births falls into 15 to 19 years age bracket with 100.0% of them unmarried at the time of birth, while the lowest percentage of unmarried women with births belong to 35 to 50 years age bracket with 0.0% of them unmarried.
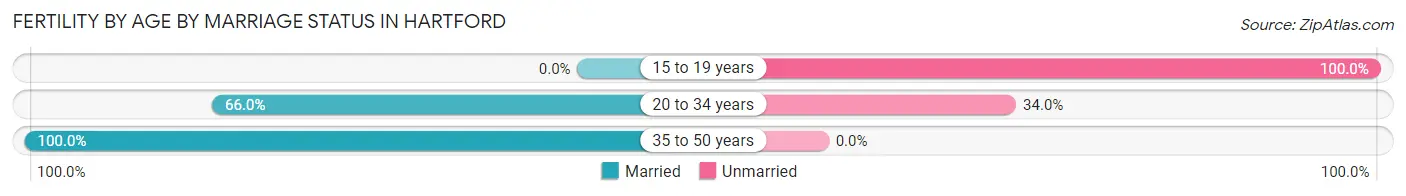
| Age Bracket | Married | Unmarried |
| 15 to 19 years | 0 (0.0%) | 6 (100.0%) |
| 20 to 34 years | 103 (66.0%) | 53 (34.0%) |
| 35 to 50 years | 32 (100.0%) | 0 (0.0%) |
| Total | 135 (69.6%) | 59 (30.4%) |
Fertility by Education in Hartford
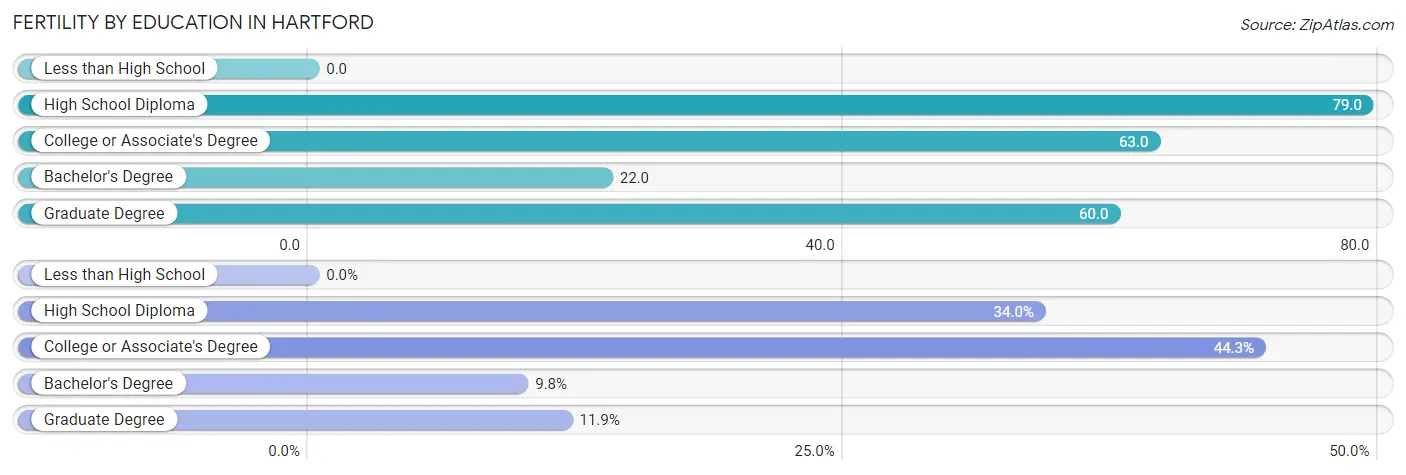
| Educational Attainment | Women with Births | Births / 1,000 Women |
| Less than High School | 0 (0.0%) | 0.0 |
| High School Diploma | 66 (34.0%) | 79.0 |
| College or Associate's Degree | 86 (44.3%) | 63.0 |
| Bachelor's Degree | 19 (9.8%) | 22.0 |
| Graduate Degree | 23 (11.9%) | 60.0 |
| Total | 194 (100.0%) | 50.0 |
Fertility by Education by Marriage Status in Hartford
30.4% of women with births in Hartford are unmarried. Women with the educational attainment of bachelor's degree are most likely to be married with 100.0% of them married at childbirth, while women with the educational attainment of graduate degree are least likely to be married with 100.0% of them unmarried at childbirth.
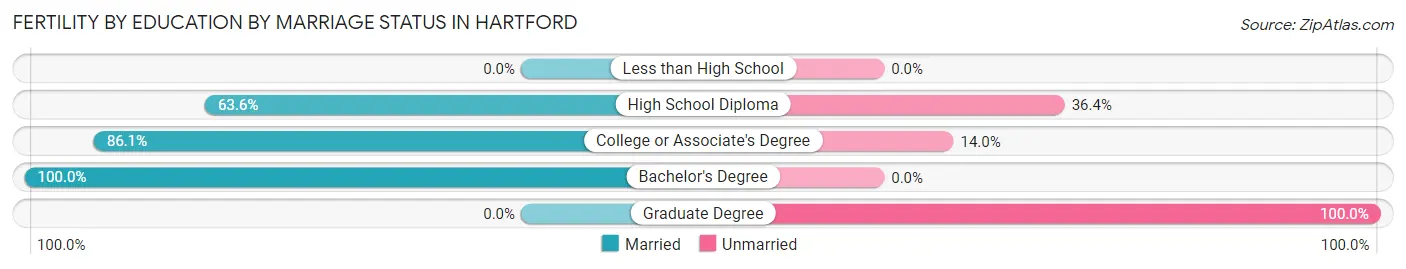
| Educational Attainment | Married | Unmarried |
| Less than High School | 0 (0.0%) | 0 (0.0%) |
| High School Diploma | 42 (63.6%) | 24 (36.4%) |
| College or Associate's Degree | 74 (86.1%) | 12 (14.0%) |
| Bachelor's Degree | 19 (100.0%) | 0 (0.0%) |
| Graduate Degree | 0 (0.0%) | 23 (100.0%) |
| Total | 135 (69.6%) | 59 (30.4%) |
Employment Characteristics in Hartford
Employment by Class of Employer in Hartford
Among the 8,397 employed individuals in Hartford, private company employees (6,467 | 77.0%), not-for-profit organizations (696 | 8.3%), and local government employees (539 | 6.4%) make up the most common classes of employment.
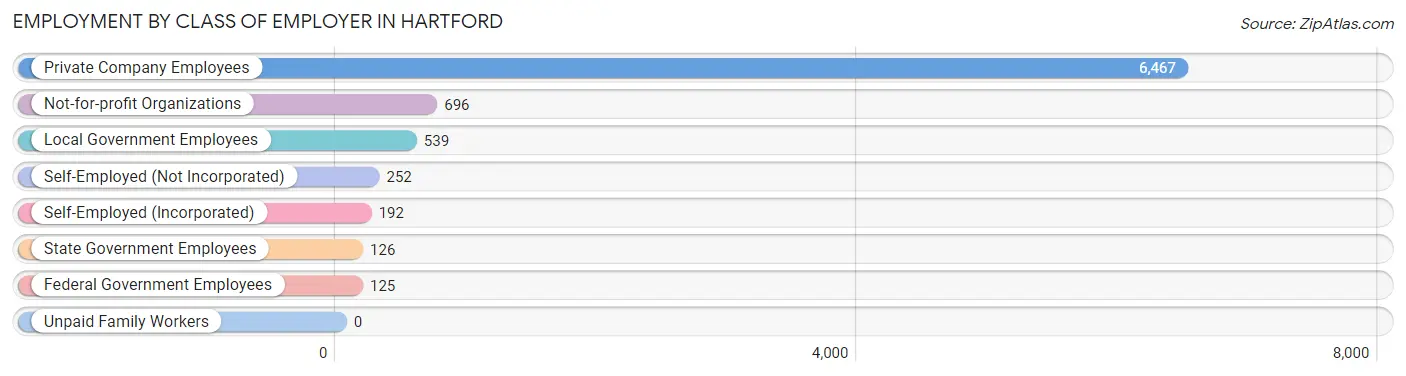
| Employer Class | # Employees | % Employees |
| Private Company Employees | 6,467 | 77.0% |
| Self-Employed (Incorporated) | 192 | 2.3% |
| Self-Employed (Not Incorporated) | 252 | 3.0% |
| Not-for-profit Organizations | 696 | 8.3% |
| Local Government Employees | 539 | 6.4% |
| State Government Employees | 126 | 1.5% |
| Federal Government Employees | 125 | 1.5% |
| Unpaid Family Workers | 0 | 0.0% |
| Total | 8,397 | 100.0% |
Employment Status by Age in Hartford
According to the labor force statistics for Hartford, out of the total population over 16 years of age (12,377), 71.3% or 8,825 individuals are in the labor force, with 3.2% or 282 of them unemployed. The age group with the highest labor force participation rate is 30 to 34 years, with 94.5% or 795 individuals in the labor force. Within the labor force, the 16 to 19 years age range has the highest percentage of unemployed individuals, with 12.1% or 75 of them being unemployed.
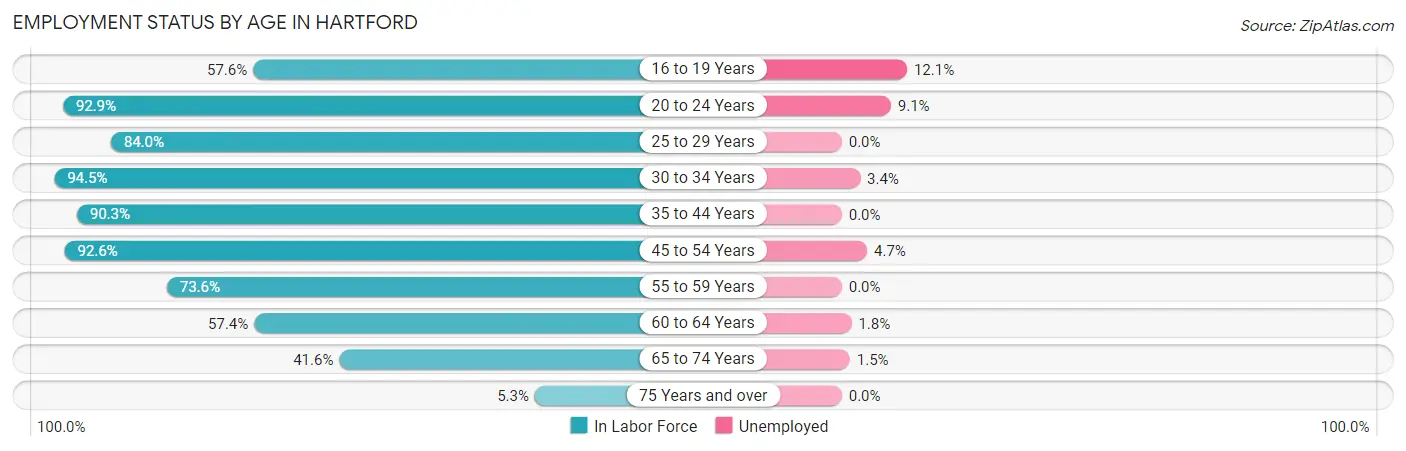
| Age Bracket | In Labor Force | Unemployed |
| 16 to 19 Years | 616 (57.6%) | 75 (12.1%) |
| 20 to 24 Years | 871 (92.9%) | 79 (9.1%) |
| 25 to 29 Years | 1,016 (84.0%) | 0 (0.0%) |
| 30 to 34 Years | 795 (94.5%) | 27 (3.4%) |
| 35 to 44 Years | 1,973 (90.3%) | 0 (0.0%) |
| 45 to 54 Years | 1,848 (92.6%) | 87 (4.7%) |
| 55 to 59 Years | 721 (73.6%) | 0 (0.0%) |
| 60 to 64 Years | 433 (57.4%) | 8 (1.8%) |
| 65 to 74 Years | 480 (41.6%) | 7 (1.5%) |
| 75 Years and over | 66 (5.3%) | 0 (0.0%) |
| Total | 8,825 (71.3%) | 282 (3.2%) |
Employment Status by Educational Attainment in Hartford
According to labor force statistics for Hartford, 85.2% of individuals (6,787) out of the total population between 25 and 64 years of age (7,966) are in the labor force, with 1.8% or 122 of them being unemployed. The group with the highest labor force participation rate are those with the educational attainment of bachelor's degree or higher, with 90.5% or 2,176 individuals in the labor force. Within the labor force, individuals with less than high school education have the highest percentage of unemployment, with 25.0% or 76 of them being unemployed.
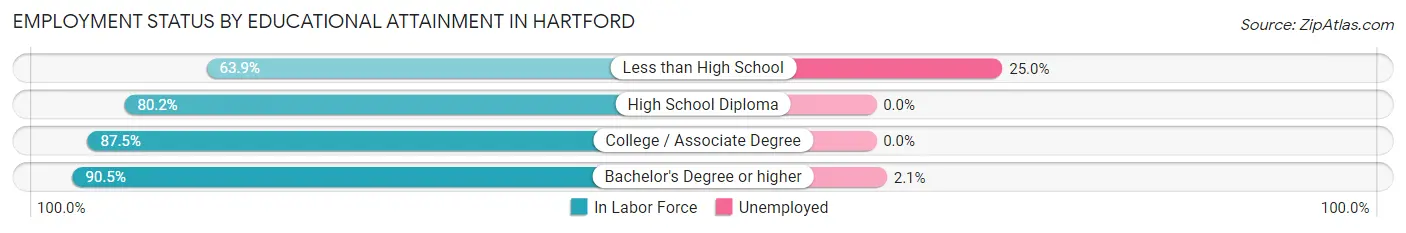
| Educational Attainment | In Labor Force | Unemployed |
| Less than High School | 304 (63.9%) | 119 (25.0%) |
| High School Diploma | 1,594 (80.2%) | 0 (0.0%) |
| College / Associate Degree | 2,711 (87.5%) | 0 (0.0%) |
| Bachelor's Degree or higher | 2,176 (90.5%) | 50 (2.1%) |
| Total | 6,787 (85.2%) | 143 (1.8%) |
Employment Occupations by Sex in Hartford
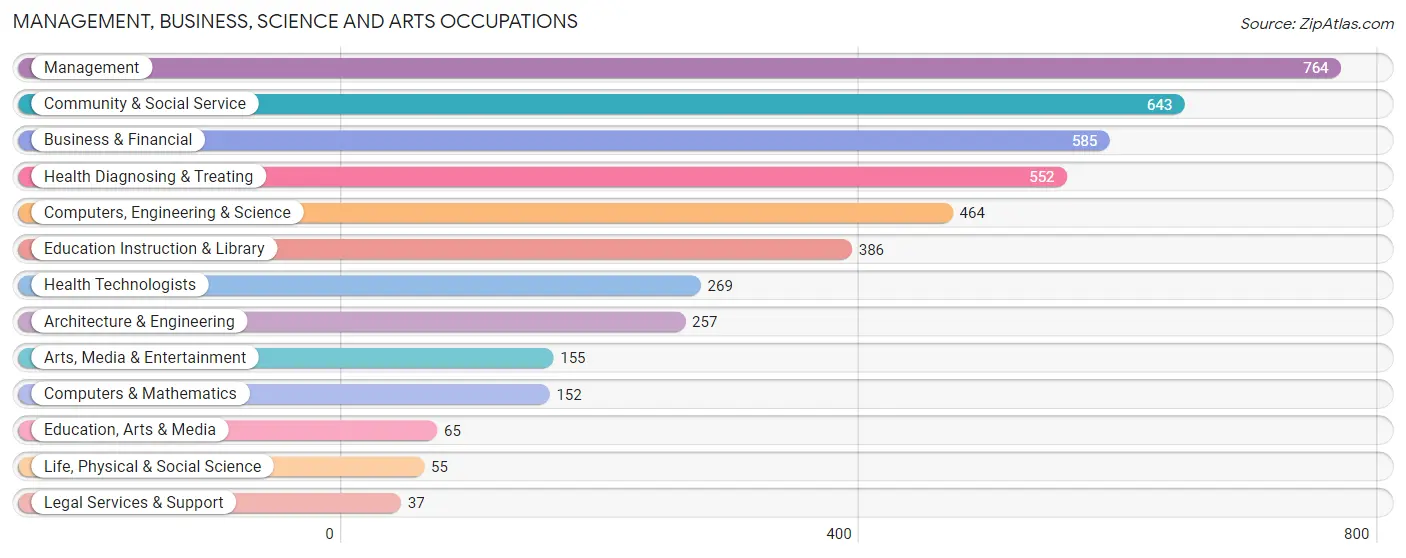
Management, Business, Science and Arts Occupations
The most common Management, Business, Science and Arts occupations in Hartford are Management (764 | 9.0%), Community & Social Service (643 | 7.5%), Business & Financial (585 | 6.9%), Health Diagnosing & Treating (552 | 6.5%), and Computers, Engineering & Science (464 | 5.4%).
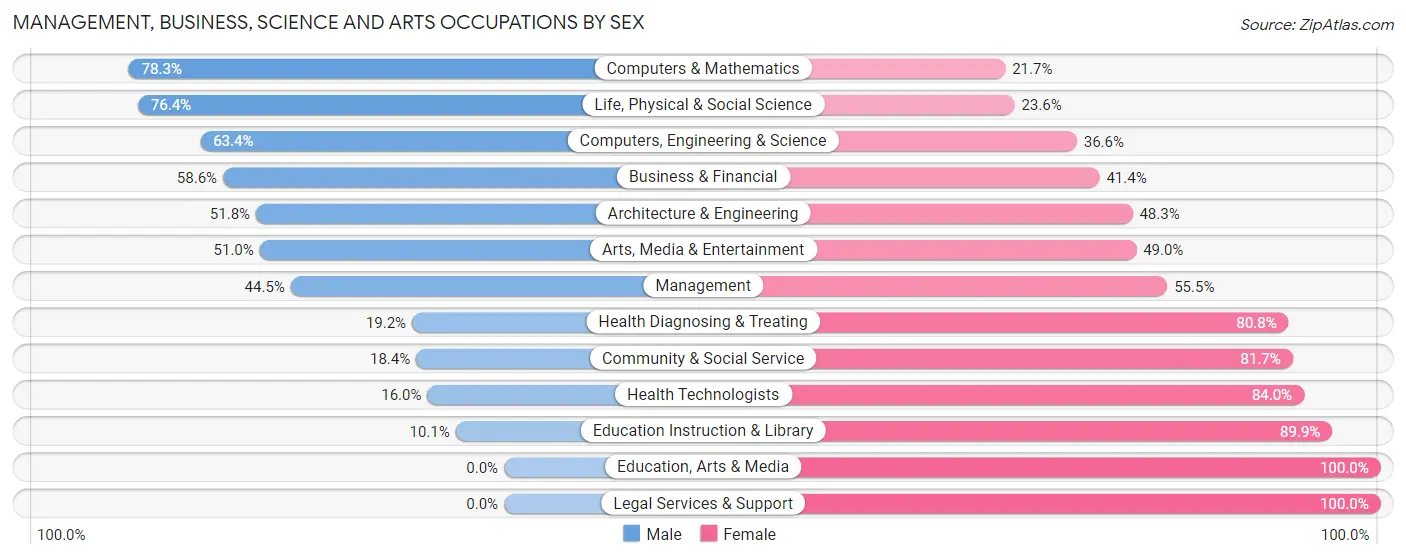
Management, Business, Science and Arts Occupations by Sex
Within the Management, Business, Science and Arts occupations in Hartford, the most male-oriented occupations are Computers & Mathematics (78.3%), Life, Physical & Social Science (76.4%), and Computers, Engineering & Science (63.4%), while the most female-oriented occupations are Education, Arts & Media (100.0%), Legal Services & Support (100.0%), and Education Instruction & Library (89.9%).
| Occupation | Male | Female |
| Management | 340 (44.5%) | 424 (55.5%) |
| Business & Financial | 343 (58.6%) | 242 (41.4%) |
| Computers, Engineering & Science | 294 (63.4%) | 170 (36.6%) |
| Computers & Mathematics | 119 (78.3%) | 33 (21.7%) |
| Architecture & Engineering | 133 (51.7%) | 124 (48.2%) |
| Life, Physical & Social Science | 42 (76.4%) | 13 (23.6%) |
| Community & Social Service | 118 (18.3%) | 525 (81.7%) |
| Education, Arts & Media | 0 (0.0%) | 65 (100.0%) |
| Legal Services & Support | 0 (0.0%) | 37 (100.0%) |
| Education Instruction & Library | 39 (10.1%) | 347 (89.9%) |
| Arts, Media & Entertainment | 79 (51.0%) | 76 (49.0%) |
| Health Diagnosing & Treating | 106 (19.2%) | 446 (80.8%) |
| Health Technologists | 43 (16.0%) | 226 (84.0%) |
| Total (Category) | 1,201 (39.9%) | 1,807 (60.1%) |
| Total (Overall) | 4,331 (50.8%) | 4,194 (49.2%) |
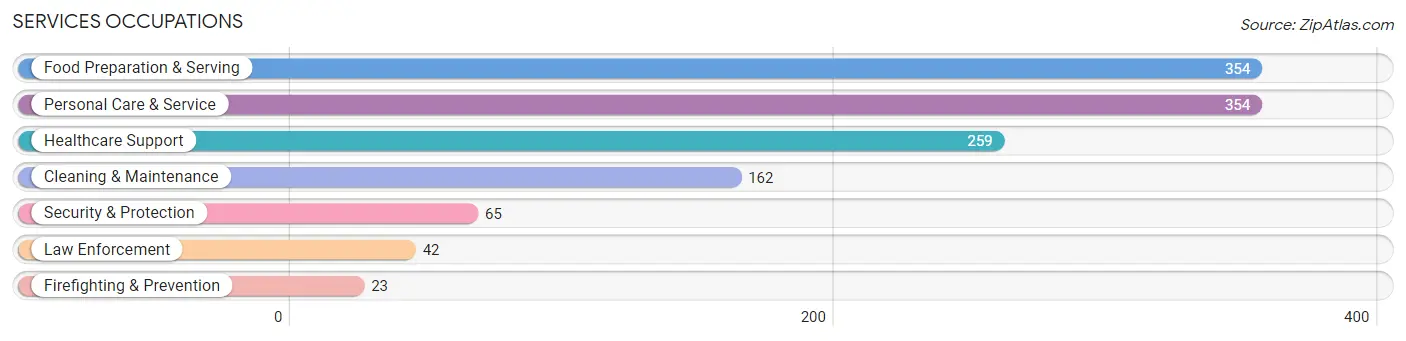
Services Occupations
The most common Services occupations in Hartford are Food Preparation & Serving (354 | 4.2%), Personal Care & Service (354 | 4.2%), Healthcare Support (259 | 3.0%), Cleaning & Maintenance (162 | 1.9%), and Security & Protection (65 | 0.8%).
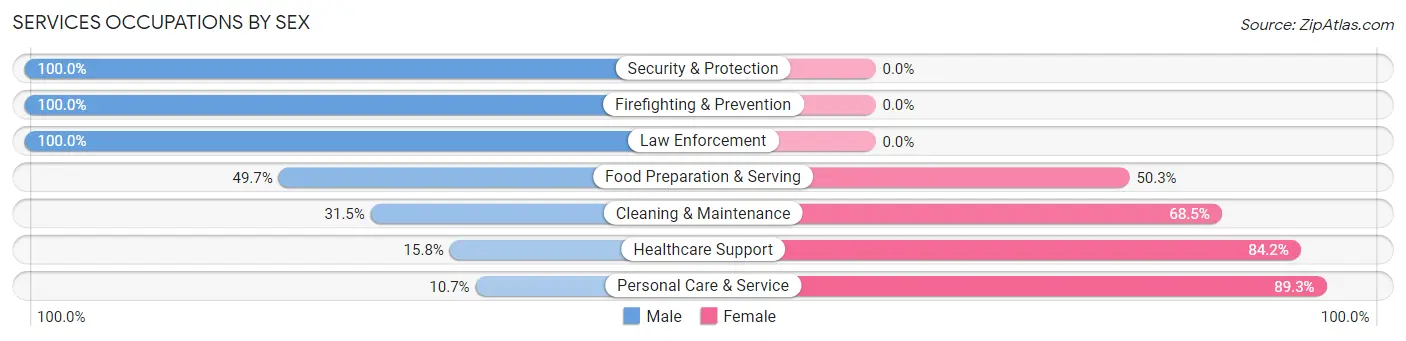
Services Occupations by Sex
Within the Services occupations in Hartford, the most male-oriented occupations are Security & Protection (100.0%), Firefighting & Prevention (100.0%), and Law Enforcement (100.0%), while the most female-oriented occupations are Personal Care & Service (89.3%), Healthcare Support (84.2%), and Cleaning & Maintenance (68.5%).
| Occupation | Male | Female |
| Healthcare Support | 41 (15.8%) | 218 (84.2%) |
| Security & Protection | 65 (100.0%) | 0 (0.0%) |
| Firefighting & Prevention | 23 (100.0%) | 0 (0.0%) |
| Law Enforcement | 42 (100.0%) | 0 (0.0%) |
| Food Preparation & Serving | 176 (49.7%) | 178 (50.3%) |
| Cleaning & Maintenance | 51 (31.5%) | 111 (68.5%) |
| Personal Care & Service | 38 (10.7%) | 316 (89.3%) |
| Total (Category) | 371 (31.1%) | 823 (68.9%) |
| Total (Overall) | 4,331 (50.8%) | 4,194 (49.2%) |
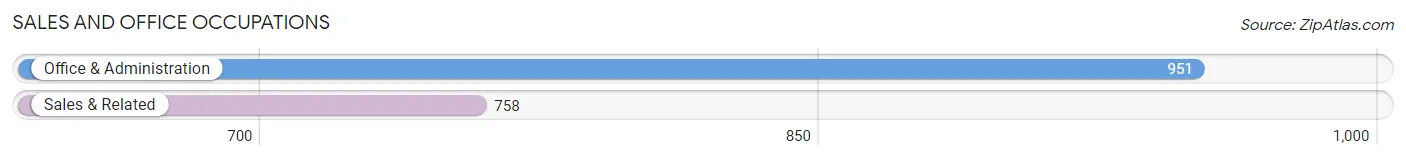
Sales and Office Occupations
The most common Sales and Office occupations in Hartford are Office & Administration (951 | 11.2%), and Sales & Related (758 | 8.9%).
Sales and Office Occupations by Sex
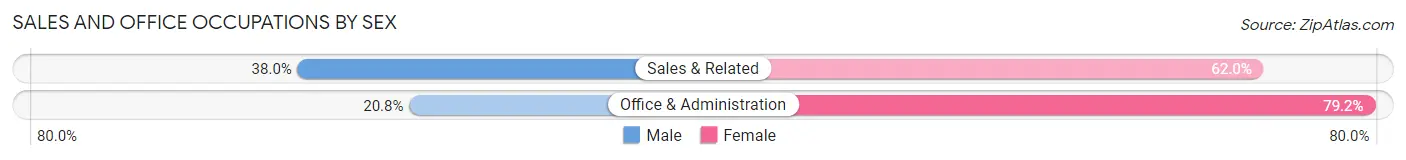
| Occupation | Male | Female |
| Sales & Related | 288 (38.0%) | 470 (62.0%) |
| Office & Administration | 198 (20.8%) | 753 (79.2%) |
| Total (Category) | 486 (28.4%) | 1,223 (71.6%) |
| Total (Overall) | 4,331 (50.8%) | 4,194 (49.2%) |
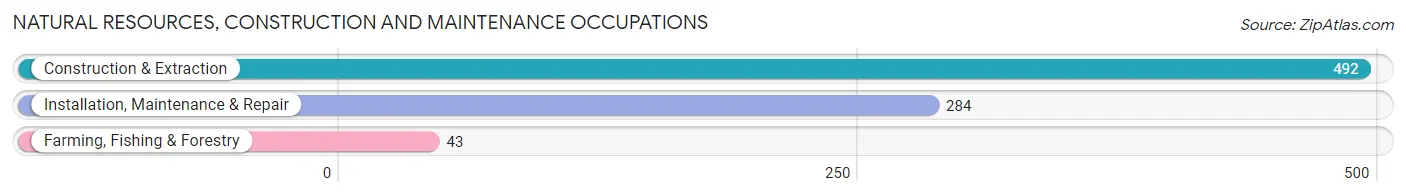
Natural Resources, Construction and Maintenance Occupations
The most common Natural Resources, Construction and Maintenance occupations in Hartford are Construction & Extraction (492 | 5.8%), Installation, Maintenance & Repair (284 | 3.3%), and Farming, Fishing & Forestry (43 | 0.5%).
Natural Resources, Construction and Maintenance Occupations by Sex
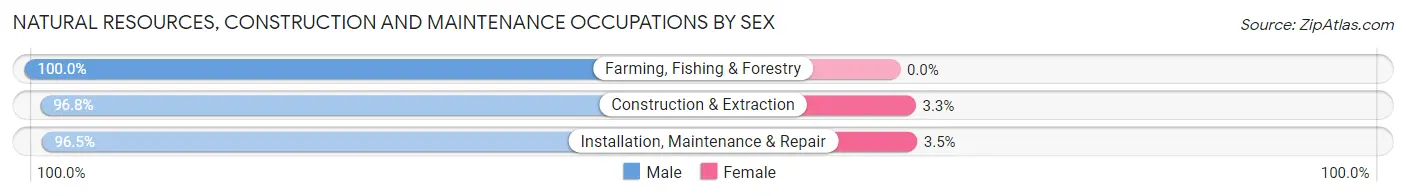
| Occupation | Male | Female |
| Farming, Fishing & Forestry | 43 (100.0%) | 0 (0.0%) |
| Construction & Extraction | 476 (96.8%) | 16 (3.3%) |
| Installation, Maintenance & Repair | 274 (96.5%) | 10 (3.5%) |
| Total (Category) | 793 (96.8%) | 26 (3.2%) |
| Total (Overall) | 4,331 (50.8%) | 4,194 (49.2%) |
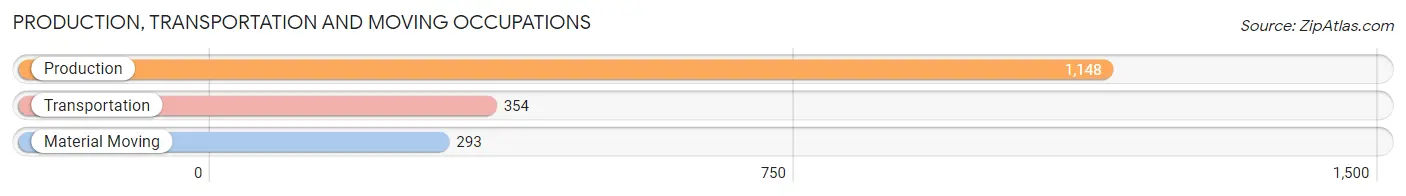
Production, Transportation and Moving Occupations
The most common Production, Transportation and Moving occupations in Hartford are Production (1,148 | 13.5%), Transportation (354 | 4.2%), and Material Moving (293 | 3.4%).
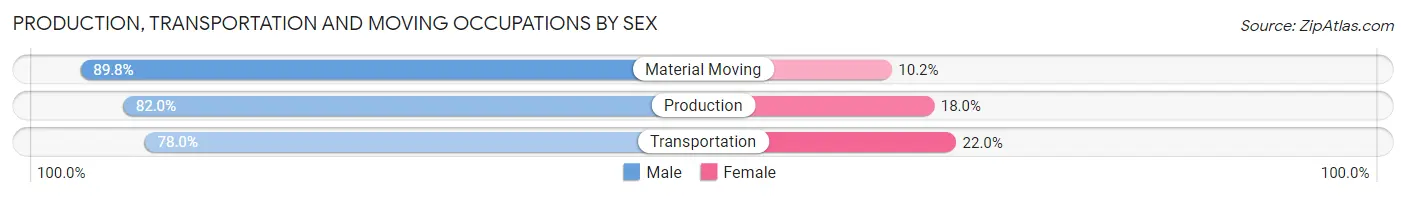
Production, Transportation and Moving Occupations by Sex
| Occupation | Male | Female |
| Production | 941 (82.0%) | 207 (18.0%) |
| Transportation | 276 (78.0%) | 78 (22.0%) |
| Material Moving | 263 (89.8%) | 30 (10.2%) |
| Total (Category) | 1,480 (82.5%) | 315 (17.5%) |
| Total (Overall) | 4,331 (50.8%) | 4,194 (49.2%) |
Employment Industries by Sex in Hartford
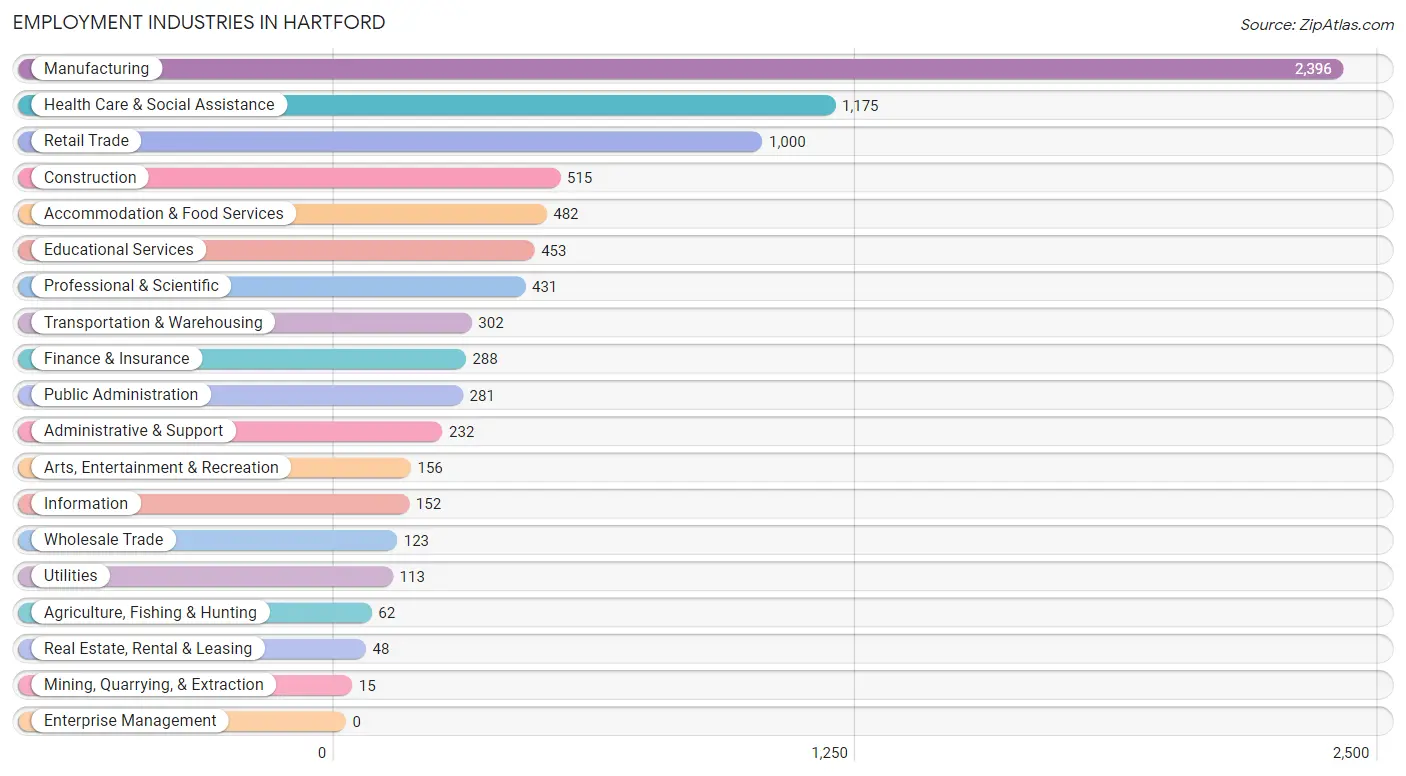
Employment Industries in Hartford
The major employment industries in Hartford include Manufacturing (2,396 | 28.1%), Health Care & Social Assistance (1,175 | 13.8%), Retail Trade (1,000 | 11.7%), Construction (515 | 6.0%), and Accommodation & Food Services (482 | 5.7%).
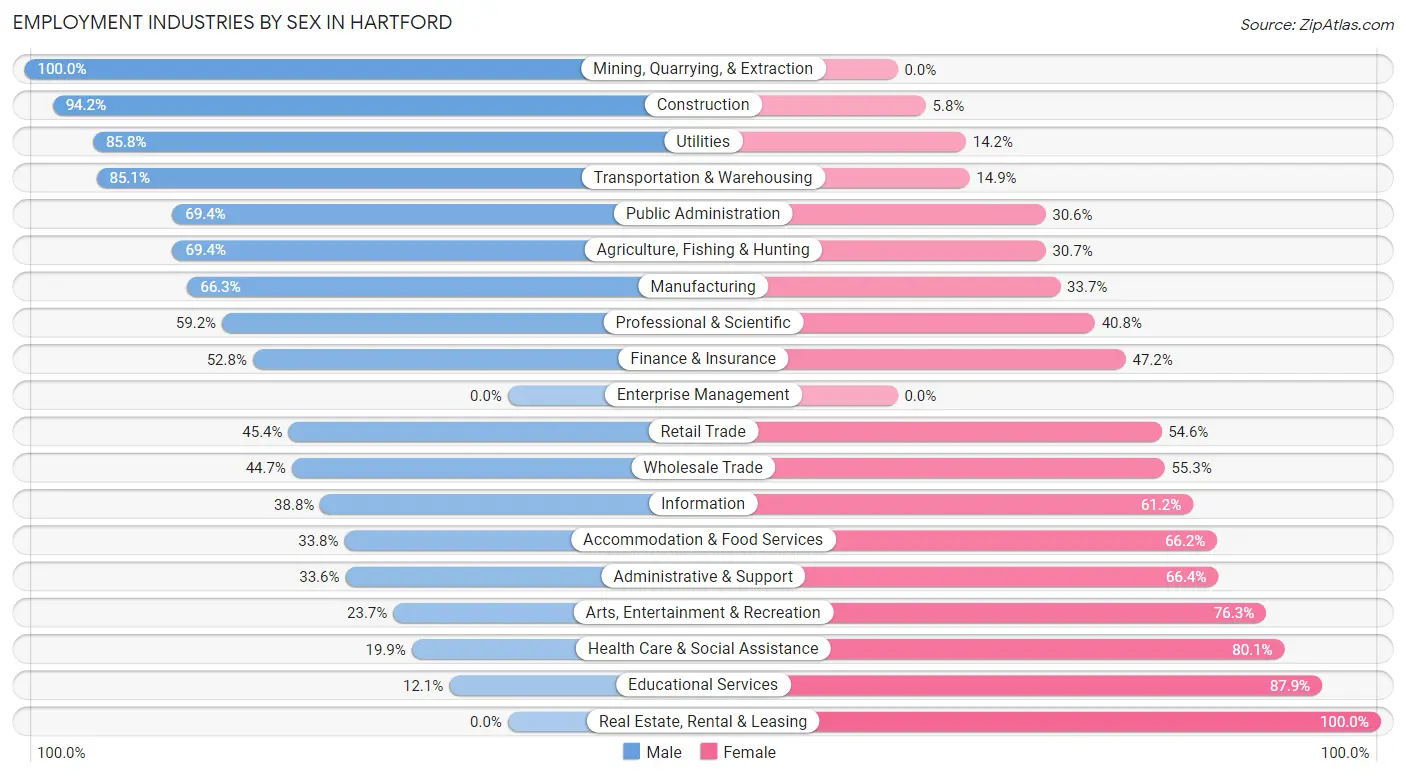
Employment Industries by Sex in Hartford
The Hartford industries that see more men than women are Mining, Quarrying, & Extraction (100.0%), Construction (94.2%), and Utilities (85.8%), whereas the industries that tend to have a higher number of women are Real Estate, Rental & Leasing (100.0%), Educational Services (87.9%), and Health Care & Social Assistance (80.1%).
| Industry | Male | Female |
| Agriculture, Fishing & Hunting | 43 (69.4%) | 19 (30.6%) |
| Mining, Quarrying, & Extraction | 15 (100.0%) | 0 (0.0%) |
| Construction | 485 (94.2%) | 30 (5.8%) |
| Manufacturing | 1,589 (66.3%) | 807 (33.7%) |
| Wholesale Trade | 55 (44.7%) | 68 (55.3%) |
| Retail Trade | 454 (45.4%) | 546 (54.6%) |
| Transportation & Warehousing | 257 (85.1%) | 45 (14.9%) |
| Utilities | 97 (85.8%) | 16 (14.2%) |
| Information | 59 (38.8%) | 93 (61.2%) |
| Finance & Insurance | 152 (52.8%) | 136 (47.2%) |
| Real Estate, Rental & Leasing | 0 (0.0%) | 48 (100.0%) |
| Professional & Scientific | 255 (59.2%) | 176 (40.8%) |
| Enterprise Management | 0 (0.0%) | 0 (0.0%) |
| Administrative & Support | 78 (33.6%) | 154 (66.4%) |
| Educational Services | 55 (12.1%) | 398 (87.9%) |
| Health Care & Social Assistance | 234 (19.9%) | 941 (80.1%) |
| Arts, Entertainment & Recreation | 37 (23.7%) | 119 (76.3%) |
| Accommodation & Food Services | 163 (33.8%) | 319 (66.2%) |
| Public Administration | 195 (69.4%) | 86 (30.6%) |
| Total | 4,331 (50.8%) | 4,194 (49.2%) |
Education in Hartford
School Enrollment in Hartford
The most common levels of schooling among the 3,926 students in Hartford are middle school (1,054 | 26.9%), elementary school (990 | 25.2%), and high school (914 | 23.3%).
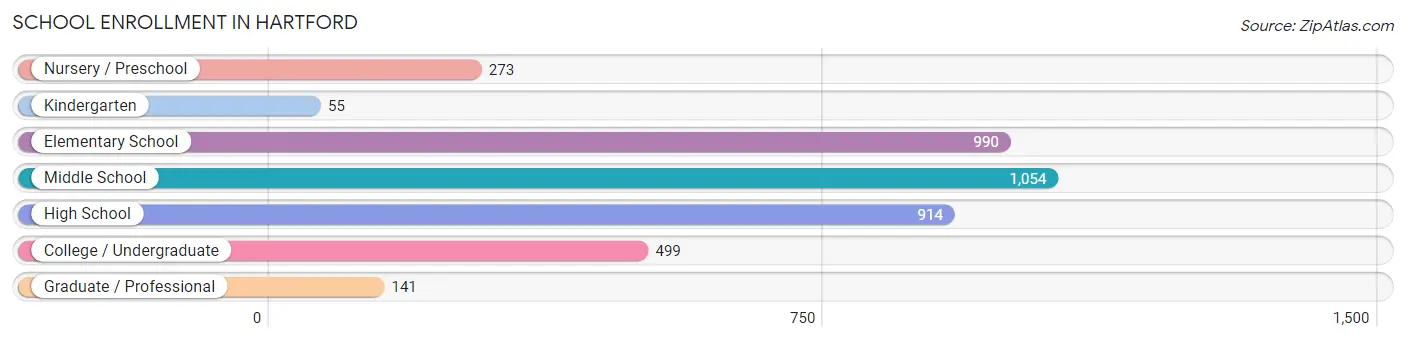
| School Level | # Students | % Students |
| Nursery / Preschool | 273 | 7.0% |
| Kindergarten | 55 | 1.4% |
| Elementary School | 990 | 25.2% |
| Middle School | 1,054 | 26.9% |
| High School | 914 | 23.3% |
| College / Undergraduate | 499 | 12.7% |
| Graduate / Professional | 141 | 3.6% |
| Total | 3,926 | 100.0% |
School Enrollment by Age by Funding Source in Hartford
Out of a total of 3,926 students who are enrolled in schools in Hartford, 612 (15.6%) attend a private institution, while the remaining 3,314 (84.4%) are enrolled in public schools. The age group of 35 years and over has the highest likelihood of being enrolled in private schools, with 74 (58.3% in the age bracket) enrolled. Conversely, the age group of 10 to 14 year olds has the lowest likelihood of being enrolled in a private school, with 1,251 (93.6% in the age bracket) attending a public institution.
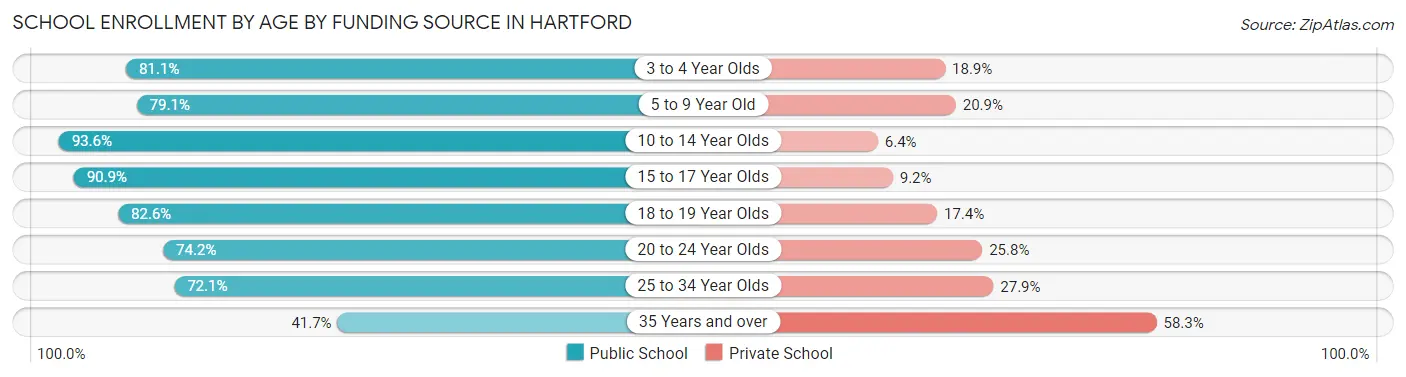
| Age Bracket | Public School | Private School |
| 3 to 4 Year Olds | 176 (81.1%) | 41 (18.9%) |
| 5 to 9 Year Old | 739 (79.1%) | 195 (20.9%) |
| 10 to 14 Year Olds | 1,251 (93.6%) | 85 (6.4%) |
| 15 to 17 Year Olds | 576 (90.8%) | 58 (9.1%) |
| 18 to 19 Year Olds | 209 (82.6%) | 44 (17.4%) |
| 20 to 24 Year Olds | 161 (74.2%) | 56 (25.8%) |
| 25 to 34 Year Olds | 150 (72.1%) | 58 (27.9%) |
| 35 Years and over | 53 (41.7%) | 74 (58.3%) |
| Total | 3,314 (84.4%) | 612 (15.6%) |
Educational Attainment by Field of Study in Hartford
Business (506 | 17.0%), education (427 | 14.4%), science & technology (309 | 10.4%), computers & mathematics (303 | 10.2%), and arts & humanities (226 | 7.6%) are the most common fields of study among 2,969 individuals in Hartford who have obtained a bachelor's degree or higher.
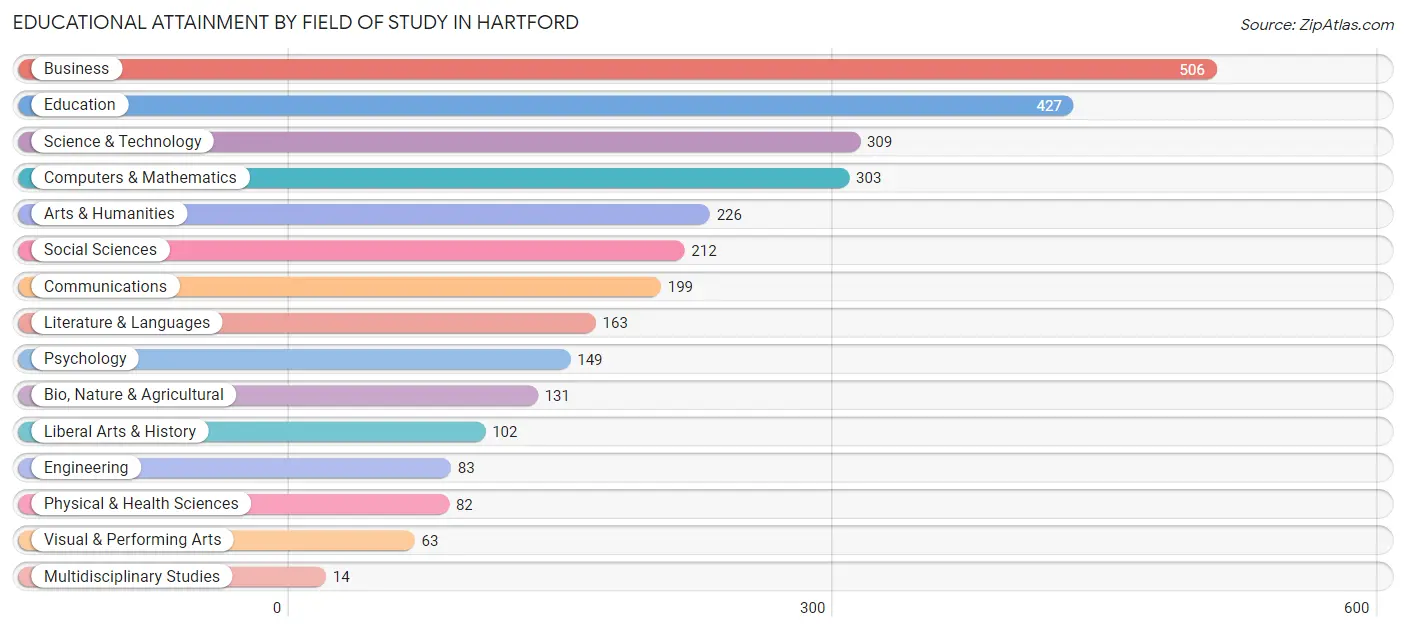
| Field of Study | # Graduates | % Graduates |
| Computers & Mathematics | 303 | 10.2% |
| Bio, Nature & Agricultural | 131 | 4.4% |
| Physical & Health Sciences | 82 | 2.8% |
| Psychology | 149 | 5.0% |
| Social Sciences | 212 | 7.1% |
| Engineering | 83 | 2.8% |
| Multidisciplinary Studies | 14 | 0.5% |
| Science & Technology | 309 | 10.4% |
| Business | 506 | 17.0% |
| Education | 427 | 14.4% |
| Literature & Languages | 163 | 5.5% |
| Liberal Arts & History | 102 | 3.4% |
| Visual & Performing Arts | 63 | 2.1% |
| Communications | 199 | 6.7% |
| Arts & Humanities | 226 | 7.6% |
| Total | 2,969 | 100.0% |
Transportation & Commute in Hartford
Vehicle Availability by Sex in Hartford
The most prevalent vehicle ownership categories in Hartford are males with 2 vehicles (2,077, accounting for 48.1%) and females with 2 vehicles (2,093, making up 51.2%).
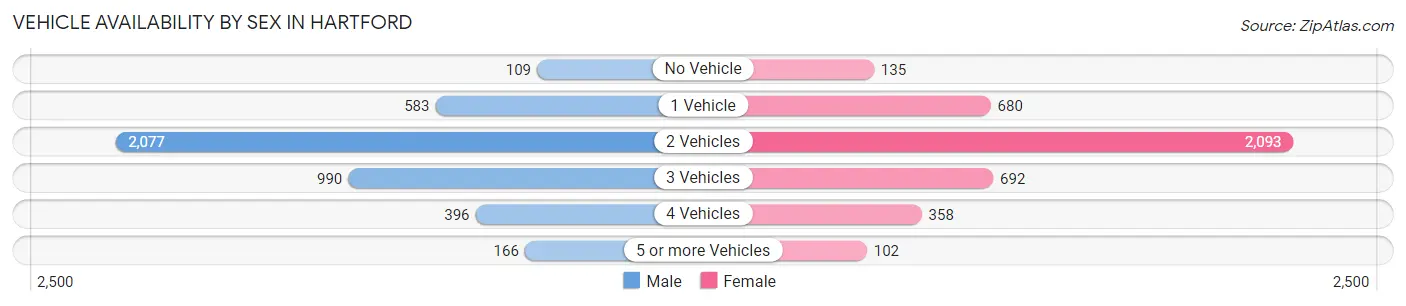
| Vehicles Available | Male | Female |
| No Vehicle | 109 (2.5%) | 135 (3.3%) |
| 1 Vehicle | 583 (13.5%) | 680 (16.8%) |
| 2 Vehicles | 2,077 (48.1%) | 2,093 (51.5%) |
| 3 Vehicles | 990 (22.9%) | 692 (17.0%) |
| 4 Vehicles | 396 (9.2%) | 358 (8.8%) |
| 5 or more Vehicles | 166 (3.8%) | 102 (2.5%) |
| Total | 4,321 (100.0%) | 4,060 (100.0%) |
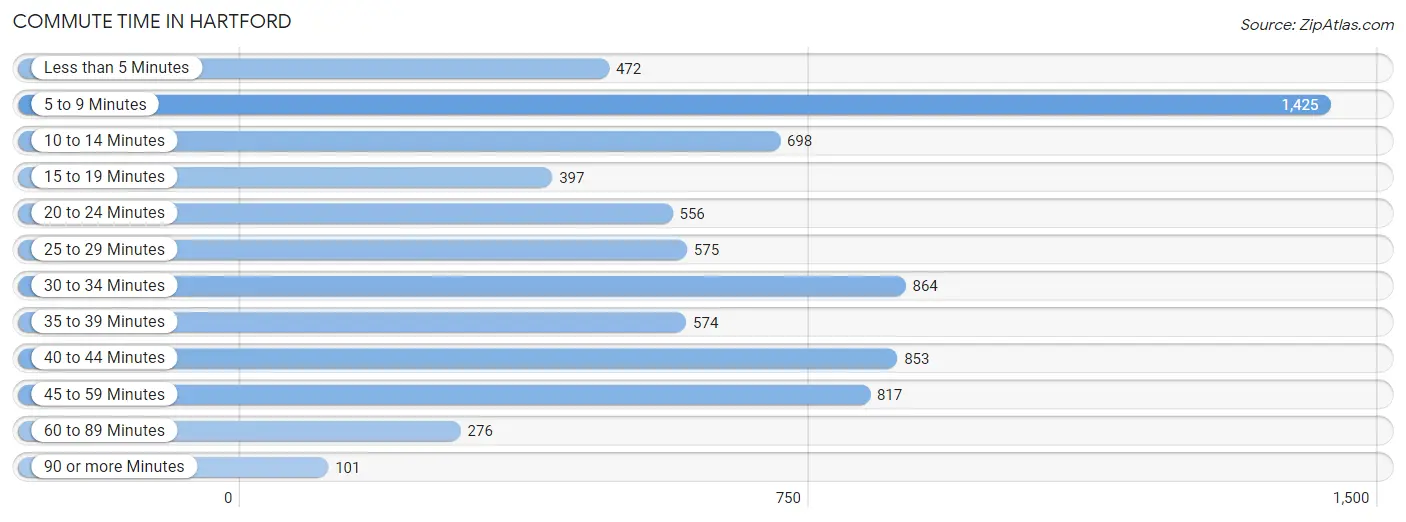
Commute Time in Hartford
The most frequently occuring commute durations in Hartford are 5 to 9 minutes (1,425 commuters, 18.7%), 30 to 34 minutes (864 commuters, 11.4%), and 40 to 44 minutes (853 commuters, 11.2%).
| Commute Time | # Commuters | % Commuters |
| Less than 5 Minutes | 472 | 6.2% |
| 5 to 9 Minutes | 1,425 | 18.7% |
| 10 to 14 Minutes | 698 | 9.2% |
| 15 to 19 Minutes | 397 | 5.2% |
| 20 to 24 Minutes | 556 | 7.3% |
| 25 to 29 Minutes | 575 | 7.6% |
| 30 to 34 Minutes | 864 | 11.4% |
| 35 to 39 Minutes | 574 | 7.5% |
| 40 to 44 Minutes | 853 | 11.2% |
| 45 to 59 Minutes | 817 | 10.7% |
| 60 to 89 Minutes | 276 | 3.6% |
| 90 or more Minutes | 101 | 1.3% |
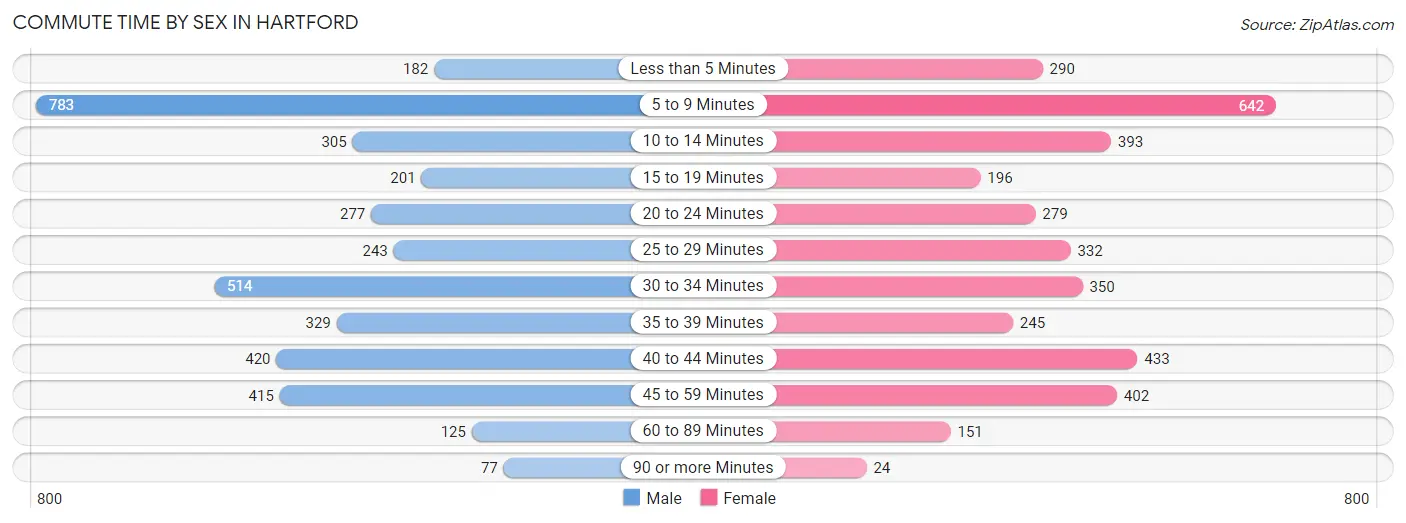
Commute Time by Sex in Hartford
The most common commute times in Hartford are 5 to 9 minutes (783 commuters, 20.2%) for males and 5 to 9 minutes (642 commuters, 17.2%) for females.
| Commute Time | Male | Female |
| Less than 5 Minutes | 182 (4.7%) | 290 (7.8%) |
| 5 to 9 Minutes | 783 (20.2%) | 642 (17.2%) |
| 10 to 14 Minutes | 305 (7.9%) | 393 (10.5%) |
| 15 to 19 Minutes | 201 (5.2%) | 196 (5.2%) |
| 20 to 24 Minutes | 277 (7.2%) | 279 (7.5%) |
| 25 to 29 Minutes | 243 (6.3%) | 332 (8.9%) |
| 30 to 34 Minutes | 514 (13.3%) | 350 (9.4%) |
| 35 to 39 Minutes | 329 (8.5%) | 245 (6.6%) |
| 40 to 44 Minutes | 420 (10.8%) | 433 (11.6%) |
| 45 to 59 Minutes | 415 (10.7%) | 402 (10.8%) |
| 60 to 89 Minutes | 125 (3.2%) | 151 (4.0%) |
| 90 or more Minutes | 77 (2.0%) | 24 (0.6%) |
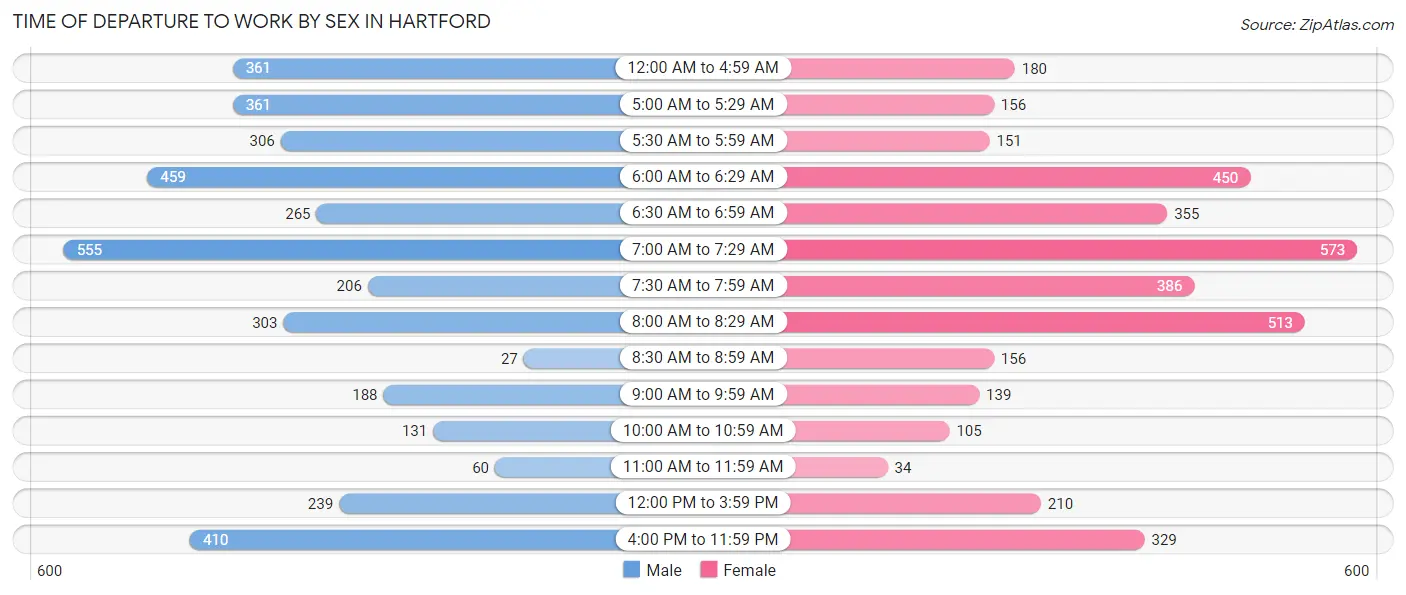
Time of Departure to Work by Sex in Hartford
The most frequent times of departure to work in Hartford are 7:00 AM to 7:29 AM (555, 14.3%) for males and 7:00 AM to 7:29 AM (573, 15.3%) for females.
| Time of Departure | Male | Female |
| 12:00 AM to 4:59 AM | 361 (9.3%) | 180 (4.8%) |
| 5:00 AM to 5:29 AM | 361 (9.3%) | 156 (4.2%) |
| 5:30 AM to 5:59 AM | 306 (7.9%) | 151 (4.0%) |
| 6:00 AM to 6:29 AM | 459 (11.9%) | 450 (12.0%) |
| 6:30 AM to 6:59 AM | 265 (6.9%) | 355 (9.5%) |
| 7:00 AM to 7:29 AM | 555 (14.3%) | 573 (15.3%) |
| 7:30 AM to 7:59 AM | 206 (5.3%) | 386 (10.3%) |
| 8:00 AM to 8:29 AM | 303 (7.8%) | 513 (13.7%) |
| 8:30 AM to 8:59 AM | 27 (0.7%) | 156 (4.2%) |
| 9:00 AM to 9:59 AM | 188 (4.9%) | 139 (3.7%) |
| 10:00 AM to 10:59 AM | 131 (3.4%) | 105 (2.8%) |
| 11:00 AM to 11:59 AM | 60 (1.5%) | 34 (0.9%) |
| 12:00 PM to 3:59 PM | 239 (6.2%) | 210 (5.6%) |
| 4:00 PM to 11:59 PM | 410 (10.6%) | 329 (8.8%) |
| Total | 3,871 (100.0%) | 3,737 (100.0%) |
Housing Occupancy in Hartford
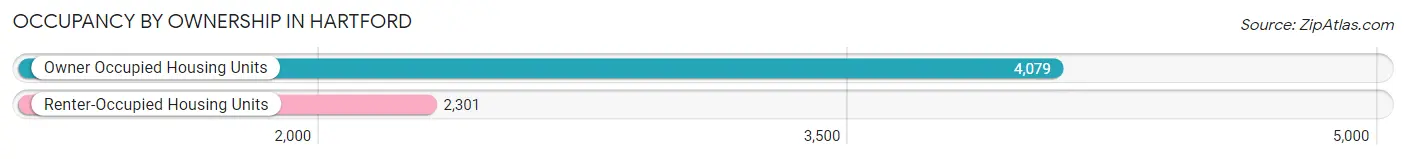
Occupancy by Ownership in Hartford
Of the total 6,380 dwellings in Hartford, owner-occupied units account for 4,079 (63.9%), while renter-occupied units make up 2,301 (36.1%).
| Occupancy | # Housing Units | % Housing Units |
| Owner Occupied Housing Units | 4,079 | 63.9% |
| Renter-Occupied Housing Units | 2,301 | 36.1% |
| Total Occupied Housing Units | 6,380 | 100.0% |
Occupancy by Household Size in Hartford

| Household Size | # Housing Units | % Housing Units |
| 1-Person Household | 1,794 | 28.1% |
| 2-Person Household | 2,211 | 34.7% |
| 3-Person Household | 999 | 15.7% |
| 4+ Person Household | 1,376 | 21.6% |
| Total Housing Units | 6,380 | 100.0% |
Occupancy by Ownership by Household Size in Hartford

| Household Size | Owner-occupied | Renter-occupied |
| 1-Person Household | 816 (45.5%) | 978 (54.5%) |
| 2-Person Household | 1,382 (62.5%) | 829 (37.5%) |
| 3-Person Household | 647 (64.8%) | 352 (35.2%) |
| 4+ Person Household | 1,234 (89.7%) | 142 (10.3%) |
| Total Housing Units | 4,079 (63.9%) | 2,301 (36.1%) |
Occupancy by Educational Attainment in Hartford
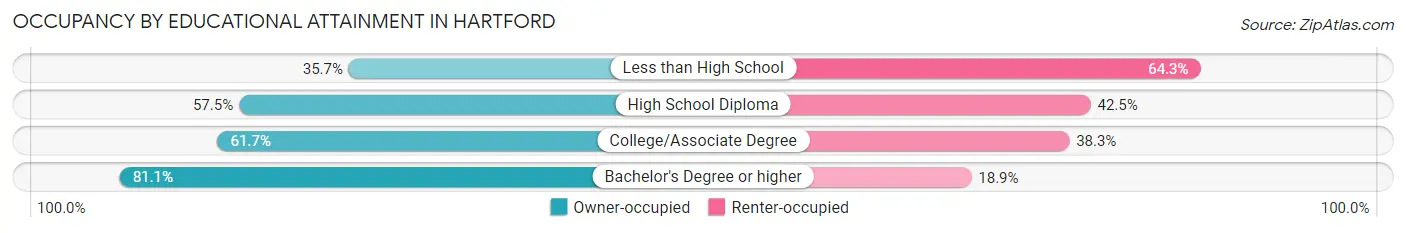
| Household Size | Owner-occupied | Renter-occupied |
| Less than High School | 149 (35.7%) | 268 (64.3%) |
| High School Diploma | 1,100 (57.5%) | 813 (42.5%) |
| College/Associate Degree | 1,450 (61.7%) | 899 (38.3%) |
| Bachelor's Degree or higher | 1,380 (81.1%) | 321 (18.9%) |
Occupancy by Age of Householder in Hartford
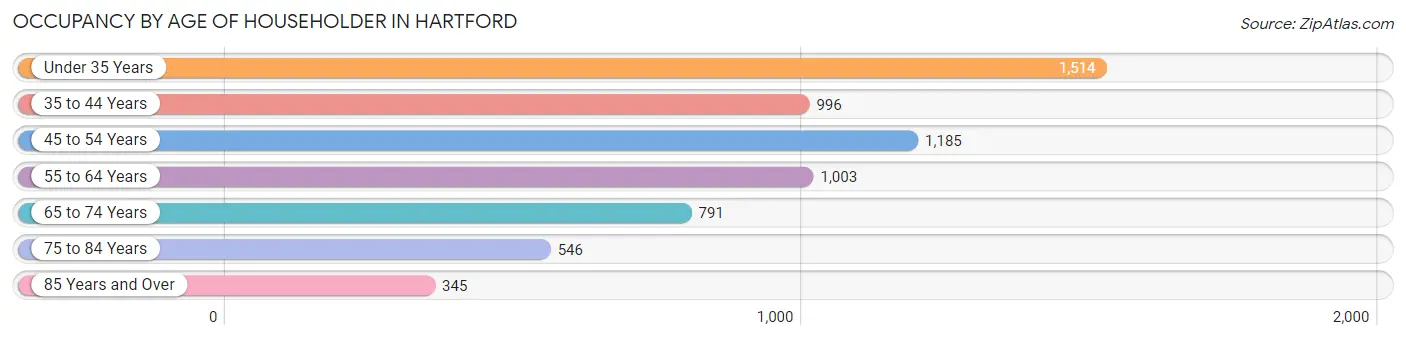
| Age Bracket | # Households | % Households |
| Under 35 Years | 1,514 | 23.7% |
| 35 to 44 Years | 996 | 15.6% |
| 45 to 54 Years | 1,185 | 18.6% |
| 55 to 64 Years | 1,003 | 15.7% |
| 65 to 74 Years | 791 | 12.4% |
| 75 to 84 Years | 546 | 8.6% |
| 85 Years and Over | 345 | 5.4% |
| Total | 6,380 | 100.0% |
Housing Finances in Hartford
Median Income by Occupancy in Hartford
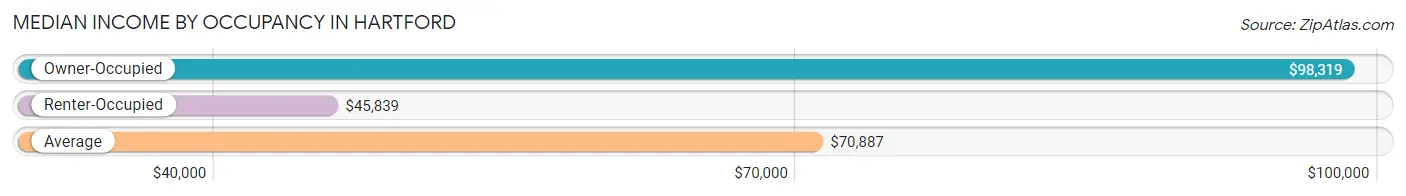
| Occupancy Type | # Households | Median Income |
| Owner-Occupied | 4,079 (63.9%) | $98,319 |
| Renter-Occupied | 2,301 (36.1%) | $45,839 |
| Average | 6,380 (100.0%) | $70,887 |
Occupancy by Householder Income Bracket in Hartford
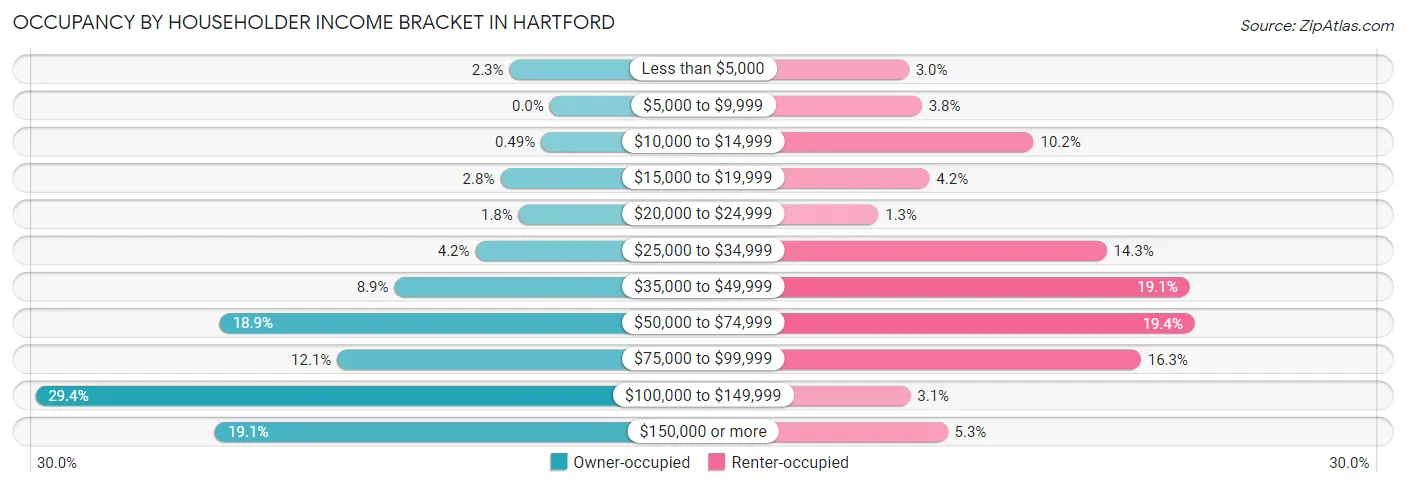
| Income Bracket | Owner-occupied | Renter-occupied |
| Less than $5,000 | 94 (2.3%) | 70 (3.0%) |
| $5,000 to $9,999 | 0 (0.0%) | 87 (3.8%) |
| $10,000 to $14,999 | 20 (0.5%) | 234 (10.2%) |
| $15,000 to $19,999 | 115 (2.8%) | 97 (4.2%) |
| $20,000 to $24,999 | 72 (1.8%) | 30 (1.3%) |
| $25,000 to $34,999 | 173 (4.2%) | 330 (14.3%) |
| $35,000 to $49,999 | 362 (8.9%) | 439 (19.1%) |
| $50,000 to $74,999 | 769 (18.9%) | 446 (19.4%) |
| $75,000 to $99,999 | 495 (12.1%) | 375 (16.3%) |
| $100,000 to $149,999 | 1,199 (29.4%) | 72 (3.1%) |
| $150,000 or more | 780 (19.1%) | 121 (5.3%) |
| Total | 4,079 (100.0%) | 2,301 (100.0%) |
Monthly Housing Cost Tiers in Hartford
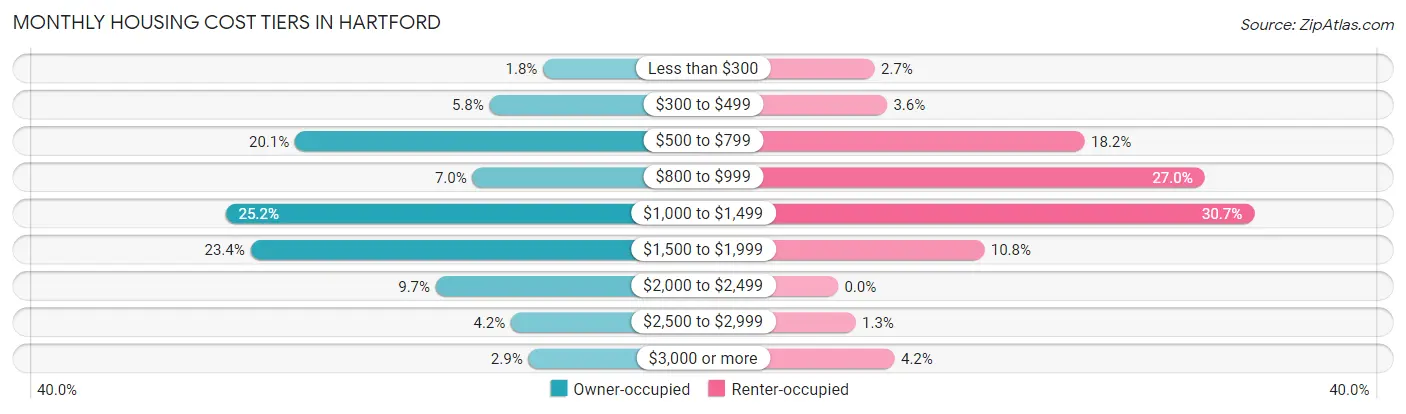
| Monthly Cost | Owner-occupied | Renter-occupied |
| Less than $300 | 74 (1.8%) | 62 (2.7%) |
| $300 to $499 | 235 (5.8%) | 83 (3.6%) |
| $500 to $799 | 819 (20.1%) | 418 (18.2%) |
| $800 to $999 | 286 (7.0%) | 622 (27.0%) |
| $1,000 to $1,499 | 1,028 (25.2%) | 706 (30.7%) |
| $1,500 to $1,999 | 953 (23.4%) | 248 (10.8%) |
| $2,000 to $2,499 | 396 (9.7%) | 0 (0.0%) |
| $2,500 to $2,999 | 170 (4.2%) | 30 (1.3%) |
| $3,000 or more | 118 (2.9%) | 96 (4.2%) |
| Total | 4,079 (100.0%) | 2,301 (100.0%) |
Physical Housing Characteristics in Hartford
Housing Structures in Hartford
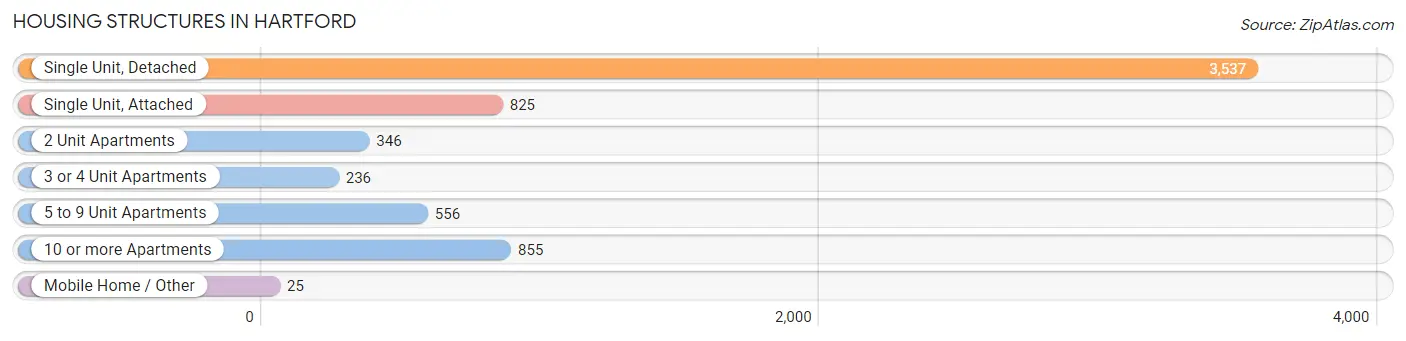
| Structure Type | # Housing Units | % Housing Units |
| Single Unit, Detached | 3,537 | 55.4% |
| Single Unit, Attached | 825 | 12.9% |
| 2 Unit Apartments | 346 | 5.4% |
| 3 or 4 Unit Apartments | 236 | 3.7% |
| 5 to 9 Unit Apartments | 556 | 8.7% |
| 10 or more Apartments | 855 | 13.4% |
| Mobile Home / Other | 25 | 0.4% |
| Total | 6,380 | 100.0% |
Housing Structures by Occupancy in Hartford
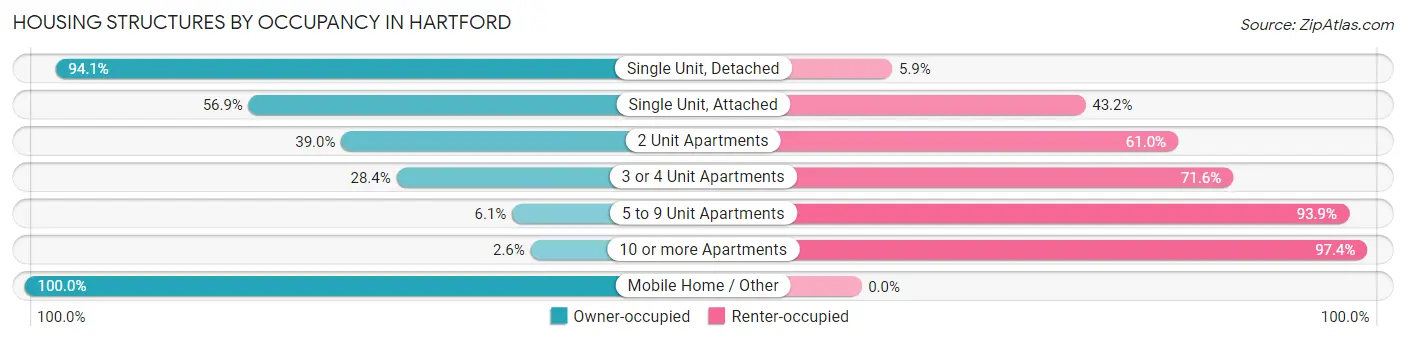
| Structure Type | Owner-occupied | Renter-occupied |
| Single Unit, Detached | 3,327 (94.1%) | 210 (5.9%) |
| Single Unit, Attached | 469 (56.9%) | 356 (43.1%) |
| 2 Unit Apartments | 135 (39.0%) | 211 (61.0%) |
| 3 or 4 Unit Apartments | 67 (28.4%) | 169 (71.6%) |
| 5 to 9 Unit Apartments | 34 (6.1%) | 522 (93.9%) |
| 10 or more Apartments | 22 (2.6%) | 833 (97.4%) |
| Mobile Home / Other | 25 (100.0%) | 0 (0.0%) |
| Total | 4,079 (63.9%) | 2,301 (36.1%) |
Housing Structures by Number of Rooms in Hartford
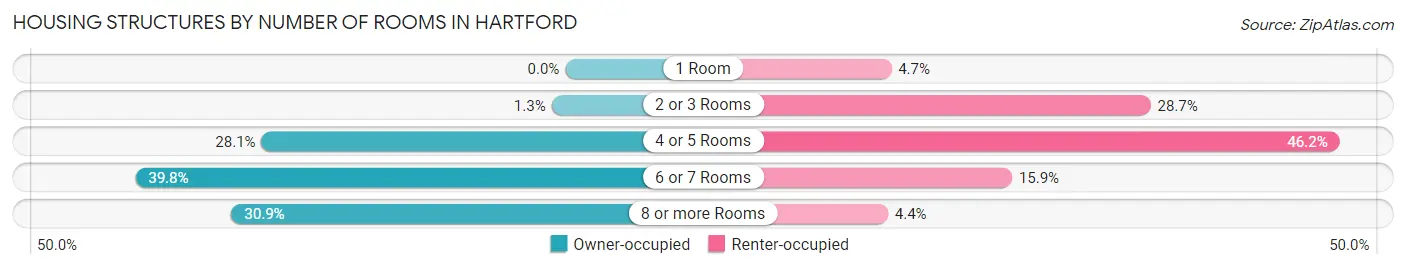
| Number of Rooms | Owner-occupied | Renter-occupied |
| 1 Room | 0 (0.0%) | 109 (4.7%) |
| 2 or 3 Rooms | 52 (1.3%) | 661 (28.7%) |
| 4 or 5 Rooms | 1,146 (28.1%) | 1,063 (46.2%) |
| 6 or 7 Rooms | 1,622 (39.8%) | 366 (15.9%) |
| 8 or more Rooms | 1,259 (30.9%) | 102 (4.4%) |
| Total | 4,079 (100.0%) | 2,301 (100.0%) |
Housing Structure by Heating Type in Hartford
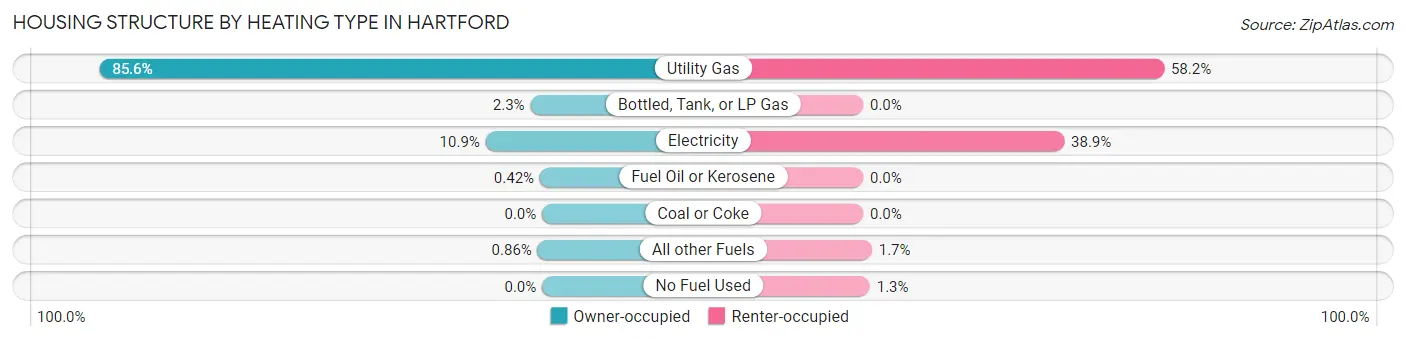
| Heating Type | Owner-occupied | Renter-occupied |
| Utility Gas | 3,490 (85.6%) | 1,338 (58.2%) |
| Bottled, Tank, or LP Gas | 92 (2.3%) | 0 (0.0%) |
| Electricity | 445 (10.9%) | 894 (38.9%) |
| Fuel Oil or Kerosene | 17 (0.4%) | 0 (0.0%) |
| Coal or Coke | 0 (0.0%) | 0 (0.0%) |
| All other Fuels | 35 (0.9%) | 39 (1.7%) |
| No Fuel Used | 0 (0.0%) | 30 (1.3%) |
| Total | 4,079 (100.0%) | 2,301 (100.0%) |
Household Vehicle Usage in Hartford
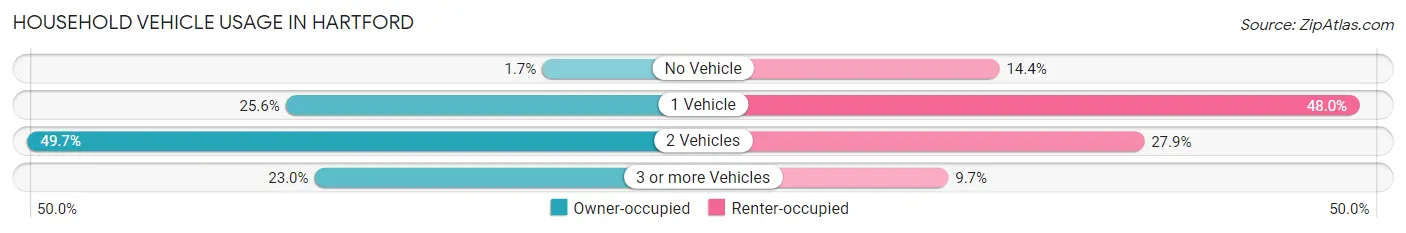
| Vehicles per Household | Owner-occupied | Renter-occupied |
| No Vehicle | 69 (1.7%) | 332 (14.4%) |
| 1 Vehicle | 1,046 (25.6%) | 1,104 (48.0%) |
| 2 Vehicles | 2,028 (49.7%) | 643 (27.9%) |
| 3 or more Vehicles | 936 (23.0%) | 222 (9.7%) |
| Total | 4,079 (100.0%) | 2,301 (100.0%) |
Real Estate & Mortgages in Hartford
Real Estate and Mortgage Overview in Hartford
| Characteristic | Without Mortgage | With Mortgage |
| Housing Units | 1,220 | 2,859 |
| Median Property Value | $239,700 | $247,200 |
| Median Household Income | $72,167 | $676 |
| Monthly Housing Costs | $607 | $102 |
| Real Estate Taxes | $3,390 | $11 |
Property Value by Mortgage Status in Hartford
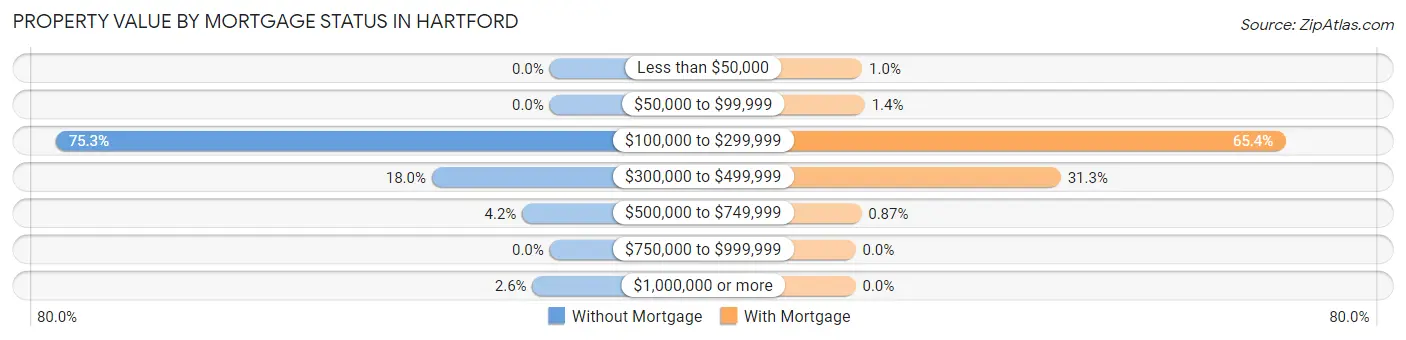
| Property Value | Without Mortgage | With Mortgage |
| Less than $50,000 | 0 (0.0%) | 29 (1.0%) |
| $50,000 to $99,999 | 0 (0.0%) | 40 (1.4%) |
| $100,000 to $299,999 | 918 (75.2%) | 1,871 (65.4%) |
| $300,000 to $499,999 | 219 (17.9%) | 894 (31.3%) |
| $500,000 to $749,999 | 51 (4.2%) | 25 (0.9%) |
| $750,000 to $999,999 | 0 (0.0%) | 0 (0.0%) |
| $1,000,000 or more | 32 (2.6%) | 0 (0.0%) |
| Total | 1,220 (100.0%) | 2,859 (100.0%) |
Household Income by Mortgage Status in Hartford
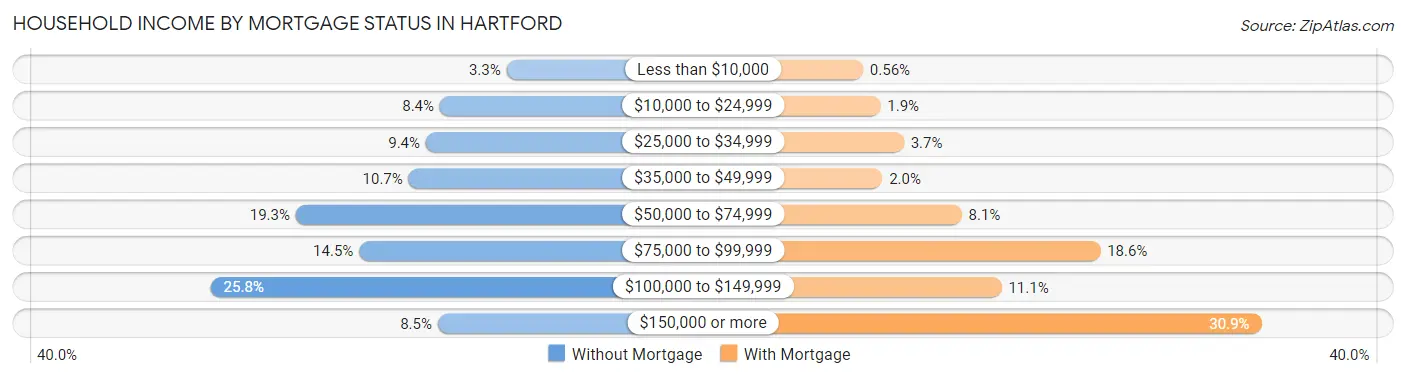
| Household Income | Without Mortgage | With Mortgage |
| Less than $10,000 | 40 (3.3%) | 16 (0.6%) |
| $10,000 to $24,999 | 102 (8.4%) | 54 (1.9%) |
| $25,000 to $34,999 | 115 (9.4%) | 105 (3.7%) |
| $35,000 to $49,999 | 131 (10.7%) | 58 (2.0%) |
| $50,000 to $74,999 | 236 (19.3%) | 231 (8.1%) |
| $75,000 to $99,999 | 177 (14.5%) | 533 (18.6%) |
| $100,000 to $149,999 | 315 (25.8%) | 318 (11.1%) |
| $150,000 or more | 104 (8.5%) | 884 (30.9%) |
| Total | 1,220 (100.0%) | 2,859 (100.0%) |
Property Value to Household Income Ratio in Hartford
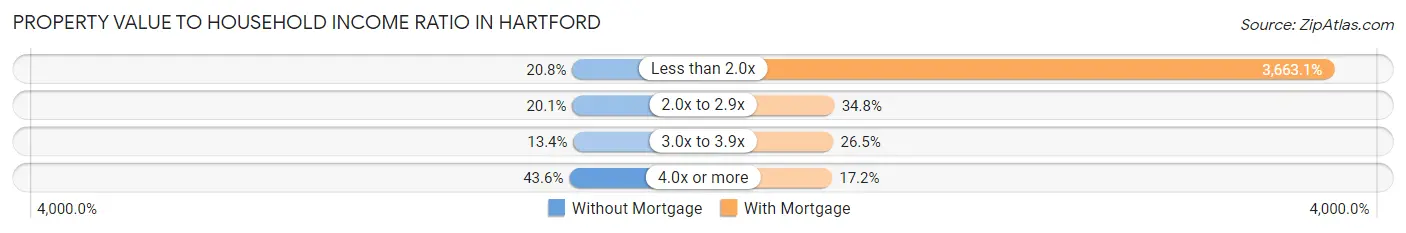
| Value-to-Income Ratio | Without Mortgage | With Mortgage |
| Less than 2.0x | 254 (20.8%) | 104,728 (3,663.1%) |
| 2.0x to 2.9x | 245 (20.1%) | 996 (34.8%) |
| 3.0x to 3.9x | 164 (13.4%) | 757 (26.5%) |
| 4.0x or more | 532 (43.6%) | 493 (17.2%) |
| Total | 1,220 (100.0%) | 2,859 (100.0%) |
Real Estate Taxes by Mortgage Status in Hartford
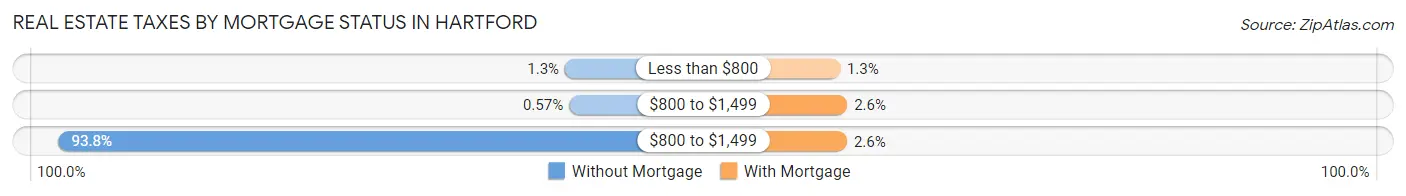
| Property Taxes | Without Mortgage | With Mortgage |
| Less than $800 | 16 (1.3%) | 36 (1.3%) |
| $800 to $1,499 | 7 (0.6%) | 74 (2.6%) |
| $800 to $1,499 | 1,144 (93.8%) | 73 (2.5%) |
| Total | 1,220 (100.0%) | 2,859 (100.0%) |
Health & Disability in Hartford
Health Insurance Coverage by Age in Hartford
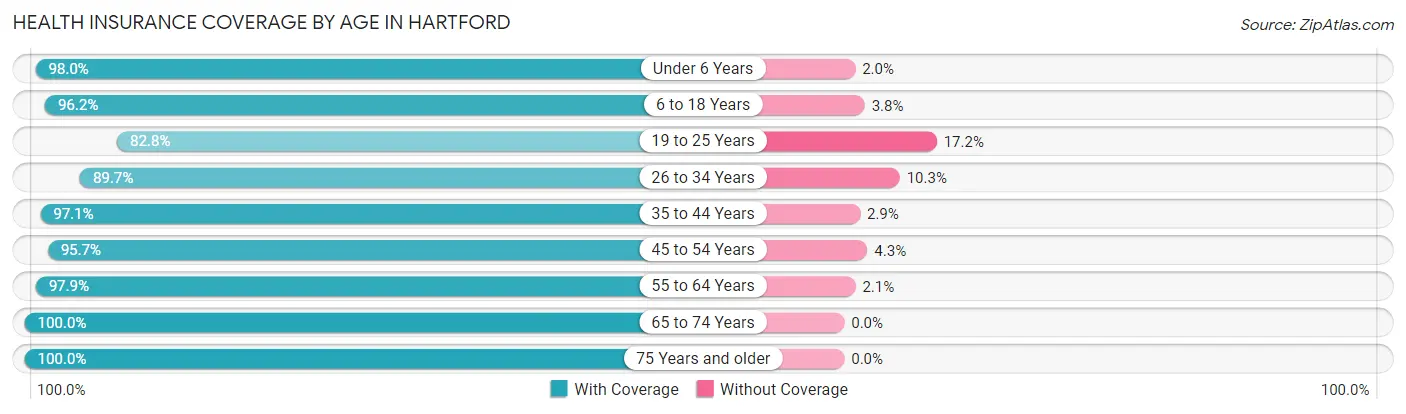
| Age Bracket | With Coverage | Without Coverage |
| Under 6 Years | 919 (98.0%) | 19 (2.0%) |
| 6 to 18 Years | 3,108 (96.2%) | 123 (3.8%) |
| 19 to 25 Years | 1,186 (82.8%) | 247 (17.2%) |
| 26 to 34 Years | 1,552 (89.7%) | 179 (10.3%) |
| 35 to 44 Years | 2,121 (97.1%) | 64 (2.9%) |
| 45 to 54 Years | 1,909 (95.7%) | 86 (4.3%) |
| 55 to 64 Years | 1,698 (97.9%) | 36 (2.1%) |
| 65 to 74 Years | 1,122 (100.0%) | 0 (0.0%) |
| 75 Years and older | 1,210 (100.0%) | 0 (0.0%) |
| Total | 14,825 (95.2%) | 754 (4.8%) |
Health Insurance Coverage by Citizenship Status in Hartford
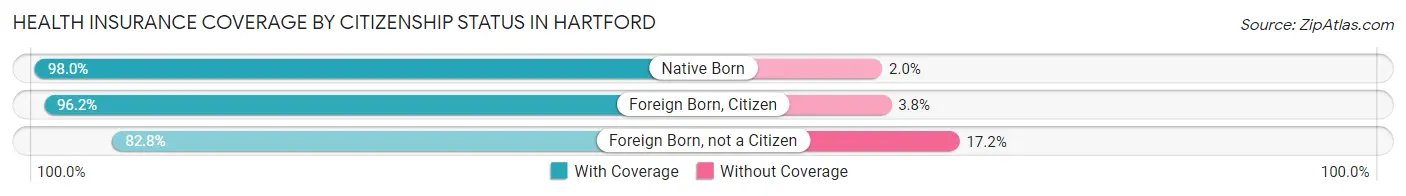
| Citizenship Status | With Coverage | Without Coverage |
| Native Born | 919 (98.0%) | 19 (2.0%) |
| Foreign Born, Citizen | 3,108 (96.2%) | 123 (3.8%) |
| Foreign Born, not a Citizen | 1,186 (82.8%) | 247 (17.2%) |
Health Insurance Coverage by Household Income in Hartford
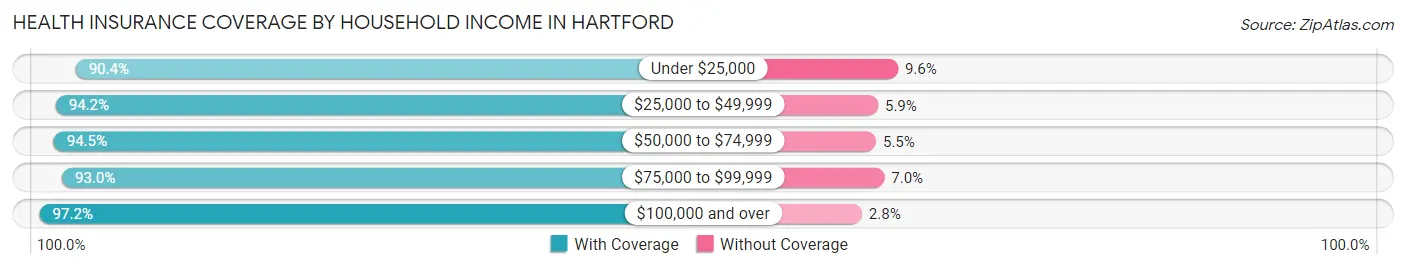
| Household Income | With Coverage | Without Coverage |
| Under $25,000 | 1,065 (90.4%) | 113 (9.6%) |
| $25,000 to $49,999 | 2,010 (94.2%) | 125 (5.9%) |
| $50,000 to $74,999 | 2,519 (94.5%) | 146 (5.5%) |
| $75,000 to $99,999 | 2,207 (93.0%) | 167 (7.0%) |
| $100,000 and over | 6,977 (97.2%) | 203 (2.8%) |
Public vs Private Health Insurance Coverage by Age in Hartford
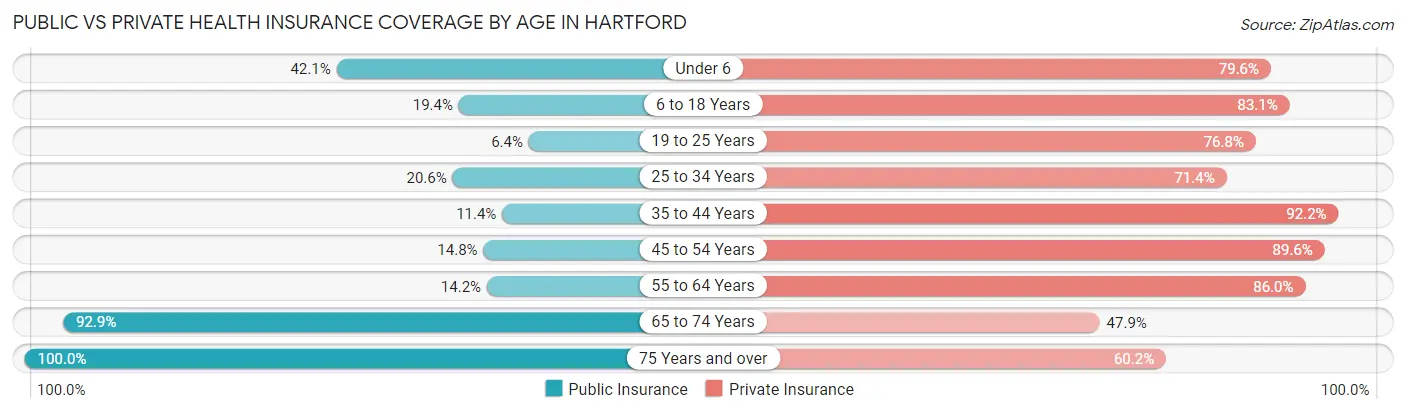
| Age Bracket | Public Insurance | Private Insurance |
| Under 6 | 395 (42.1%) | 747 (79.6%) |
| 6 to 18 Years | 627 (19.4%) | 2,685 (83.1%) |
| 19 to 25 Years | 92 (6.4%) | 1,101 (76.8%) |
| 25 to 34 Years | 356 (20.6%) | 1,236 (71.4%) |
| 35 to 44 Years | 248 (11.4%) | 2,014 (92.2%) |
| 45 to 54 Years | 296 (14.8%) | 1,788 (89.6%) |
| 55 to 64 Years | 246 (14.2%) | 1,492 (86.0%) |
| 65 to 74 Years | 1,042 (92.9%) | 537 (47.9%) |
| 75 Years and over | 1,210 (100.0%) | 728 (60.2%) |
| Total | 4,512 (29.0%) | 12,328 (79.1%) |
Disability Status by Sex by Age in Hartford
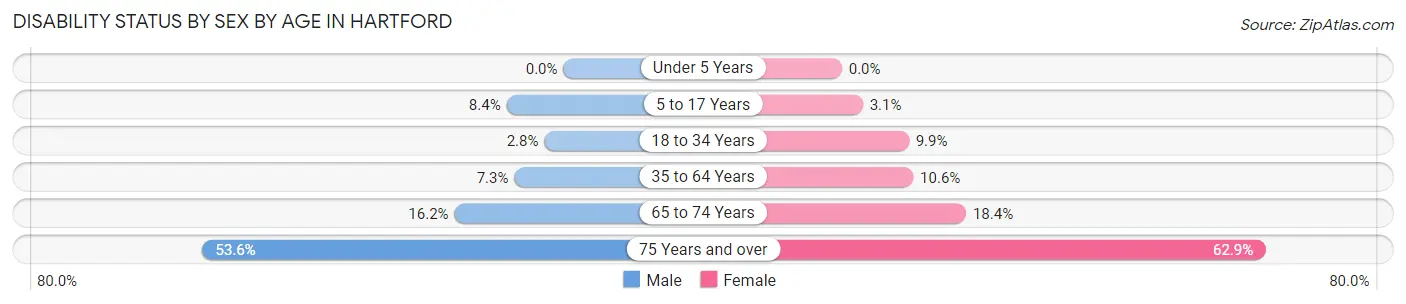
| Age Bracket | Male | Female |
| Under 5 Years | 0 (0.0%) | 0 (0.0%) |
| 5 to 17 Years | 122 (8.4%) | 48 (3.1%) |
| 18 to 34 Years | 47 (2.8%) | 183 (9.9%) |
| 35 to 64 Years | 217 (7.3%) | 311 (10.6%) |
| 65 to 74 Years | 78 (16.2%) | 118 (18.4%) |
| 75 Years and over | 246 (53.6%) | 472 (62.8%) |
Disability Class by Sex by Age in Hartford
Disability Class: Hearing Difficulty
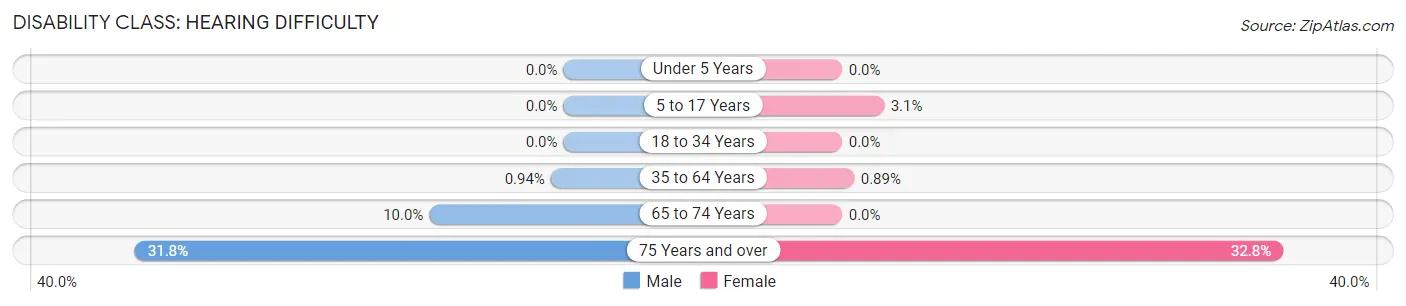
| Age Bracket | Male | Female |
| Under 5 Years | 0 (0.0%) | 0 (0.0%) |
| 5 to 17 Years | 0 (0.0%) | 48 (3.1%) |
| 18 to 34 Years | 0 (0.0%) | 0 (0.0%) |
| 35 to 64 Years | 28 (0.9%) | 26 (0.9%) |
| 65 to 74 Years | 48 (10.0%) | 0 (0.0%) |
| 75 Years and over | 146 (31.8%) | 246 (32.8%) |
Disability Class: Vision Difficulty
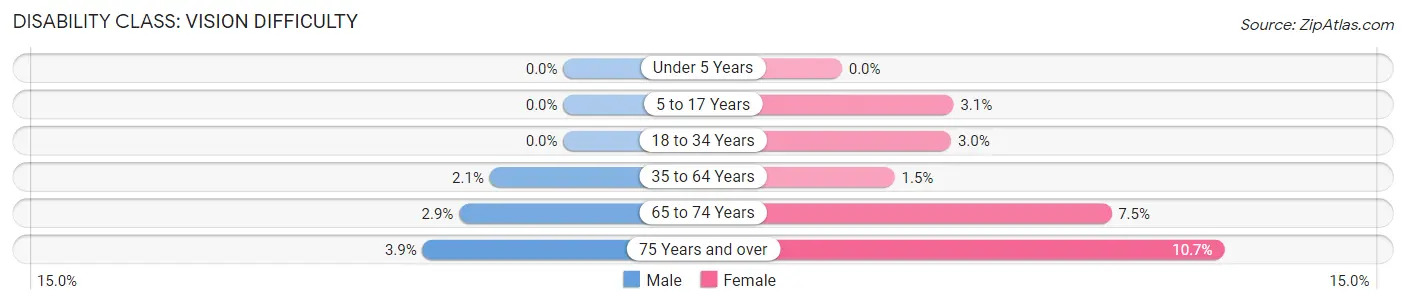
| Age Bracket | Male | Female |
| Under 5 Years | 0 (0.0%) | 0 (0.0%) |
| 5 to 17 Years | 0 (0.0%) | 48 (3.1%) |
| 18 to 34 Years | 0 (0.0%) | 56 (3.0%) |
| 35 to 64 Years | 61 (2.1%) | 43 (1.5%) |
| 65 to 74 Years | 14 (2.9%) | 48 (7.5%) |
| 75 Years and over | 18 (3.9%) | 80 (10.6%) |
Disability Class: Cognitive Difficulty
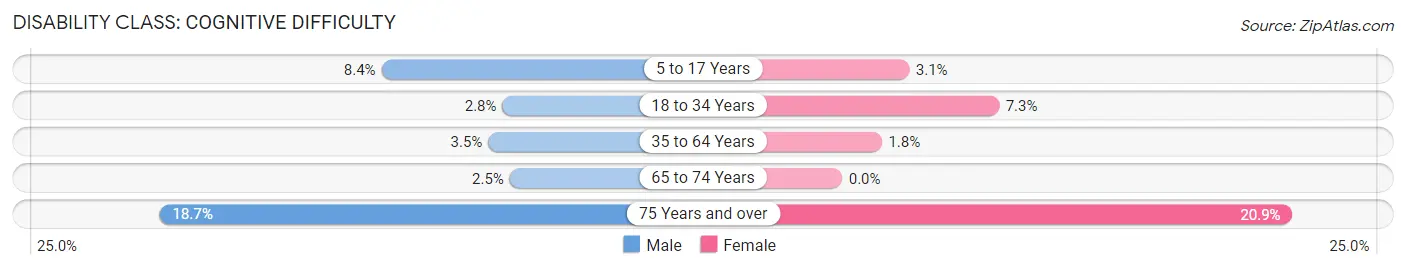
| Age Bracket | Male | Female |
| 5 to 17 Years | 122 (8.4%) | 48 (3.1%) |
| 18 to 34 Years | 47 (2.8%) | 134 (7.3%) |
| 35 to 64 Years | 104 (3.5%) | 54 (1.8%) |
| 65 to 74 Years | 12 (2.5%) | 0 (0.0%) |
| 75 Years and over | 86 (18.7%) | 157 (20.9%) |
Disability Class: Ambulatory Difficulty
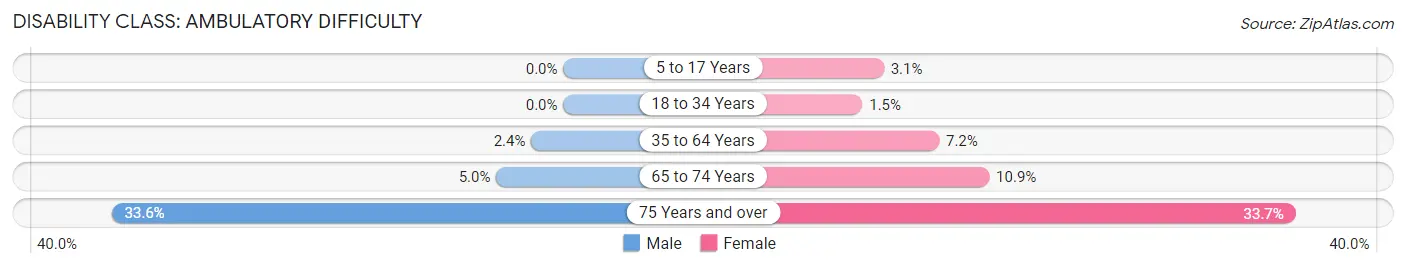
| Age Bracket | Male | Female |
| 5 to 17 Years | 0 (0.0%) | 48 (3.1%) |
| 18 to 34 Years | 0 (0.0%) | 28 (1.5%) |
| 35 to 64 Years | 71 (2.4%) | 212 (7.2%) |
| 65 to 74 Years | 24 (5.0%) | 70 (10.9%) |
| 75 Years and over | 154 (33.6%) | 253 (33.7%) |
Disability Class: Self-Care Difficulty
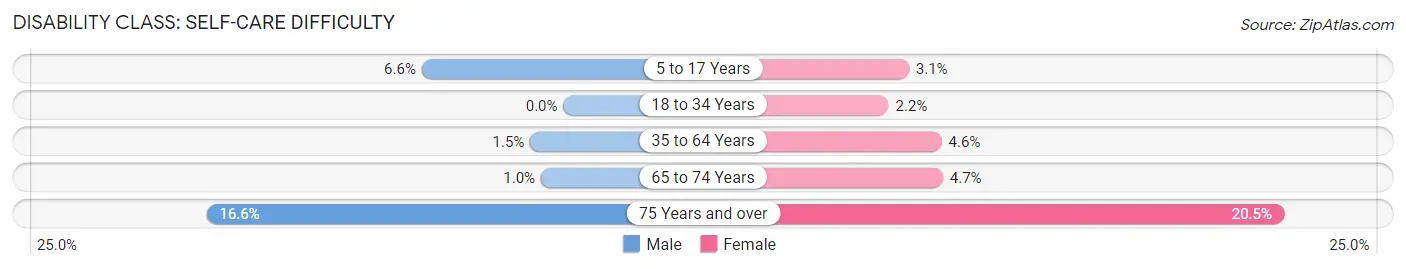
| Age Bracket | Male | Female |
| 5 to 17 Years | 95 (6.6%) | 48 (3.1%) |
| 18 to 34 Years | 0 (0.0%) | 40 (2.2%) |
| 35 to 64 Years | 46 (1.5%) | 136 (4.6%) |
| 65 to 74 Years | 5 (1.0%) | 30 (4.7%) |
| 75 Years and over | 76 (16.6%) | 154 (20.5%) |
Technology Access in Hartford
Computing Device Access in Hartford
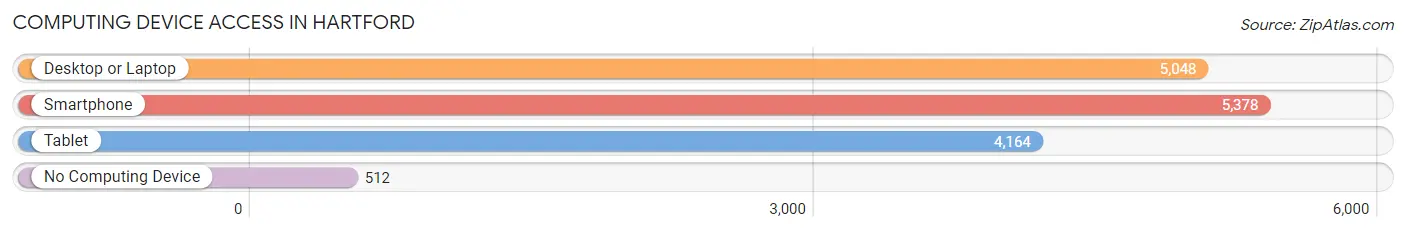
| Device Type | # Households | % Households |
| Desktop or Laptop | 5,048 | 79.1% |
| Smartphone | 5,378 | 84.3% |
| Tablet | 4,164 | 65.3% |
| No Computing Device | 512 | 8.0% |
| Total | 6,380 | 100.0% |
Internet Access in Hartford
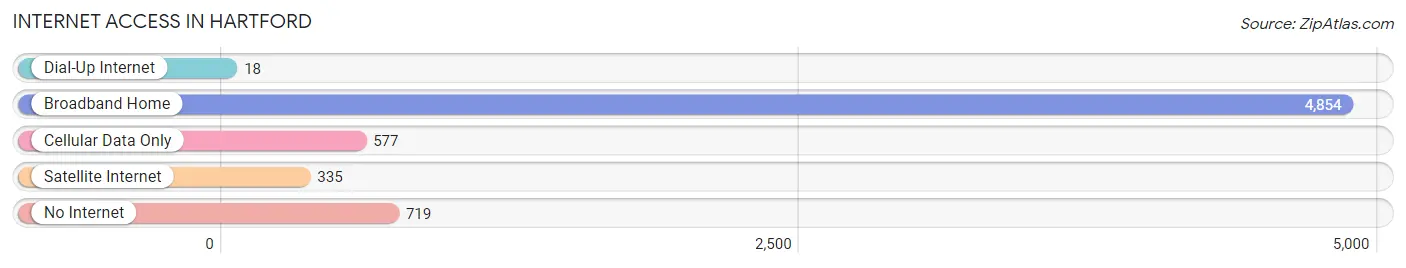
| Internet Type | # Households | % Households |
| Dial-Up Internet | 18 | 0.3% |
| Broadband Home | 4,854 | 76.1% |
| Cellular Data Only | 577 | 9.0% |
| Satellite Internet | 335 | 5.2% |
| No Internet | 719 | 11.3% |
| Total | 6,380 | 100.0% |
Hartford Summary
Hartford, Wisconsin is a city located in Washington County, Wisconsin, United States. It is the county seat of Washington County and is located on the Rock River. As of the 2010 census, the city had a population of 14,223.
History
The area that is now Hartford was first settled in 1836 by a group of settlers from New York. The settlers named the area Hartford after their hometown of Hartford, Connecticut. The city was officially incorporated in 1848.
In the late 19th century, Hartford was a major center for the production of agricultural equipment. The city was home to several factories, including the Hart-Parr Company, which produced the first gasoline-powered tractors in the United States.
Geography
Hartford is located at 43°20'N 88°17'W (43.33, -88.28). According to the United States Census Bureau, the city has a total area of 8.2 square miles (21.2 km2), of which 8.1 square miles (21.0 km2) is land and 0.1 square miles (0.2 km2) is water.
Economy
Hartford is a major center for manufacturing and agriculture. The city is home to several factories, including the Hart-Parr Company, which produces agricultural equipment. The city is also home to several food processing plants, including the Kraft Heinz Company, which produces a variety of food products.
The city is also home to several retail stores, including Walmart, Target, and Kohl's. The city is also home to several restaurants, including Applebee's, Olive Garden, and Red Lobster.
Demographics
As of the 2010 census, there were 14,223 people, 5,845 households, and 3,717 families residing in the city. The population density was 1,749.3 people per square mile (675.2/km2). There were 6,093 housing units at an average density of 751.2 per square mile (290.2/km2). The racial makeup of the city was 94.2% White, 0.7% African American, 0.4% Native American, 0.7% Asian, 2.3% from other races, and 1.6% from two or more races. Hispanic or Latino of any race were 5.2% of the population.
There were 5,845 households, out of which 30.2% had children under the age of 18 living with them, 46.2% were married couples living together, 11.7% had a female householder with no husband present, and 37.2% were non-families. 32.2% of all households were made up of individuals, and 14.2% had someone living alone who was 65 years of age or older. The average household size was 2.37 and the average family size was 2.98.
In the city, the population was spread out, with 24.2% under the age of 18, 8.2% from 18 to 24, 28.2% from 25 to 44, 21.7% from 45 to 64, and 17.7% who were 65 years of age or older. The median age was 38 years. For every 100 females, there were 91.2 males. For every 100 females age 18 and over, there were 87.7 males.
The median income for a household in the city was $41,945, and the median income for a family was $51,945. Males had a median income of $37,945 versus $25,945 for females. The per capita income for the city was $20,945. About 5.2% of families and 7.2% of the population were below the poverty line, including 9.2% of those under age 18 and 6.2% of those age 65 or over.
Common Questions
What is Per Capita Income in Hartford?
Per Capita income in Hartford is $35,960.
What is the Median Family Income in Hartford?
Median Family Income in Hartford is $97,175.
What is the Median Household income in Hartford?
Median Household Income in Hartford is $70,887.
What is Income or Wage Gap in Hartford?
Income or Wage Gap in Hartford is 32.4%.
Women in Hartford earn 67.6 cents for every dollar earned by a man.
What is Inequality or Gini Index in Hartford?
Inequality or Gini Index in Hartford is 0.39.
What is the Total Population of Hartford?
Total Population of Hartford is 15,667.
What is the Total Male Population of Hartford?
Total Male Population of Hartford is 7,613.
What is the Total Female Population of Hartford?
Total Female Population of Hartford is 8,054.
What is the Ratio of Males per 100 Females in Hartford?
There are 94.52 Males per 100 Females in Hartford.
What is the Ratio of Females per 100 Males in Hartford?
There are 105.79 Females per 100 Males in Hartford.
What is the Median Population Age in Hartford?
Median Population Age in Hartford is 37.8 Years.
What is the Average Family Size in Hartford
Average Family Size in Hartford is 3.0 People.
What is the Average Household Size in Hartford
Average Household Size in Hartford is 2.4 People.
How Large is the Labor Force in Hartford?
There are 8,825 People in the Labor Forcein in Hartford.
What is the Percentage of People in the Labor Force in Hartford?
71.3% of People are in the Labor Force in Hartford.
What is the Unemployment Rate in Hartford?
Unemployment Rate in Hartford is 3.2%.