Sioux Unemployment Among Women with Children Ages 6 to 17 years

COMPARE

Sioux
Race
Ancestry
AfghanAfricanAlaska NativeAlaskan AthabascanAlbanianAleutAlsatianAmericanApacheArabArapahoArgentineanArmenianAssyrian/Chaldean/SyriacAustralianAustrianBahamianBangladeshiBarbadianBasqueBelgianBelizeanBermudanBhutaneseBlackfeetBolivianBrazilianBritishBritish West IndianBulgarianBurmeseCajunCambodianCanadianCape VerdeanCarpatho RusynCelticCentral AmericanCentral American IndianCherokeeCheyenneChickasawChileanChineseChippewaChoctawColombianColvilleComancheCosta RicanCreeCreekCroatianCrowCubanCypriotCzechCzechoslovakianDanishDelawareDominicanDutchDutch West IndianEastern EuropeanEcuadorianEgyptianEnglishEstonianEthiopianEuropeanFijianFilipinoFinnishFrenchFrench American IndianFrench CanadianGermanGerman RussianGhanaianGreekGuamanian/ChamorroGuatemalanGuyaneseHaitianHmongHonduranHopiHoumaHungarianIcelanderIndian (Asian)IndonesianInupiatIranianIraqiIrishIroquoisIsraeliItalianJamaicanJapaneseJordanianKenyanKiowaKoreanLaotianLatvianLebaneseLiberianLithuanianLumbeeLuxembourgerMacedonianMalaysianMalteseMarshalleseMenomineeMexicanMexican American IndianMongolianMoroccanNative HawaiianNavajoNepaleseNew ZealanderNicaraguanNigerianNorthern EuropeanNorwegianOkinawanOsageOttawaPaiutePakistaniPalestinianPanamanianParaguayanPennsylvania GermanPeruvianPimaPolishPortuguesePotawatomiPuebloPuerto RicanPuget Sound SalishRomanianRussianSalvadoranSamoanScandinavianScotch-IrishScottishSeminoleSenegaleseSerbianShoshoneSierra LeoneanSiouxSlavicSlovakSloveneSomaliSouth AfricanSouth AmericanSouth American IndianSoviet UnionSpaniardSpanishSpanish AmericanSpanish American IndianSri LankanSubsaharan AfricanSudaneseSwedishSwissSyrianTaiwaneseThaiTlingit-HaidaTohono O'OdhamTonganTrinidadian and TobagonianTsimshianTurkishU.S. Virgin IslanderUgandanUkrainianUruguayanUteVenezuelanVietnameseWelshWest IndianYakamaYaquiYugoslavianYumanYup'ikZimbabwean
Immigration
NonimmigrantsImmigrantsAfghanistanAfricaAlbaniaArgentinaArmeniaAsiaAustraliaAustriaBahamasBangladeshBarbadosBelarusBelgiumBelizeBoliviaBosnia and HerzegovinaBrazilBulgariaBurma/MyanmarCabo VerdeCambodiaCameroonCanadaCaribbeanCentral AmericaChileChinaColombiaCongoCosta RicaCroatiaCubaCzechoslovakiaDenmarkDominicaDominican RepublicEastern AfricaEastern AsiaEastern EuropeEcuadorEgyptEl SalvadorEnglandEritreaEthiopiaEuropeFijiFranceGermanyGhanaGreeceGrenadaGuatemalaGuyanaHaitiHondurasHong KongHungaryIndiaIndonesiaIranIraqIrelandIsraelItalyJamaicaJapanJordanKazakhstanKenyaKoreaKuwaitLaosLatin AmericaLatviaLebanonLiberiaLithuaniaMalaysiaMexicoMicronesiaMiddle AfricaMoldovaMoroccoNepalNetherlandsNicaraguaNigeriaNorth AmericaNorth MacedoniaNorthern AfricaNorthern EuropeNorwayOceaniaPakistanPanamaPeruPhilippinesPolandPortugalRomaniaRussiaSaudi ArabiaScotlandSenegalSerbiaSierra LeoneSingaporeSomaliaSouth AfricaSouth AmericaSouth Central AsiaSouth Eastern AsiaSouthern EuropeSpainSri LankaSt. Vincent and the GrenadinesSudanSwedenSwitzerlandSyriaTaiwanThailandTrinidad and TobagoTurkeyUgandaUkraineUruguayUzbekistanVenezuelaVietnamWest IndiesWestern AfricaWestern AsiaWestern EuropeYemenZaireZimbabweAzores
Select to Compare
Race
Ancestry
AfghanAfricanAlaska NativeAlaskan AthabascanAlbanianAleutAlsatianAmericanApacheArabArapahoArgentineanArmenianAssyrian/Chaldean/SyriacAustralianAustrianBahamianBangladeshiBarbadianBasqueBelgianBelizeanBermudanBhutaneseBlackfeetBolivianBrazilianBritishBritish West IndianBulgarianBurmeseCajunCambodianCanadianCape VerdeanCarpatho RusynCelticCentral AmericanCentral American IndianCherokeeCheyenneChickasawChileanChineseChippewaChoctawColombianColvilleComancheCosta RicanCreeCreekCroatianCrowCubanCypriotCzechCzechoslovakianDanishDelawareDominicanDutchDutch West IndianEastern EuropeanEcuadorianEgyptianEnglishEstonianEthiopianEuropeanFijianFilipinoFinnishFrenchFrench American IndianFrench CanadianGermanGerman RussianGhanaianGreekGuamanian/ChamorroGuatemalanGuyaneseHaitianHmongHonduranHopiHoumaHungarianIcelanderIndian (Asian)IndonesianInupiatIranianIraqiIrishIroquoisIsraeliItalianJamaicanJapaneseJordanianKenyanKiowaKoreanLaotianLatvianLebaneseLiberianLithuanianLumbeeLuxembourgerMacedonianMalaysianMalteseMarshalleseMenomineeMexicanMexican American IndianMongolianMoroccanNative HawaiianNavajoNepaleseNew ZealanderNicaraguanNigerianNorthern EuropeanNorwegianOkinawanOsageOttawaPaiutePakistaniPalestinianPanamanianParaguayanPennsylvania GermanPeruvianPimaPolishPortuguesePotawatomiPuebloPuerto RicanPuget Sound SalishRomanianRussianSalvadoranSamoanScandinavianScotch-IrishScottishSeminoleSenegaleseSerbianShoshoneSierra LeoneanSlavicSlovakSloveneSomaliSouth AfricanSouth AmericanSouth American IndianSoviet UnionSpaniardSpanishSpanish AmericanSpanish American IndianSri LankanSubsaharan AfricanSudaneseSwedishSwissSyrianTaiwaneseThaiTlingit-HaidaTohono O'OdhamTonganTrinidadian and TobagonianTsimshianTurkishU.S. Virgin IslanderUgandanUkrainianUruguayanUteVenezuelanVietnameseWelshWest IndianYakamaYaquiYugoslavianYumanYup'ikZimbabwean
Immigration
NonimmigrantsImmigrantsAfghanistanAfricaAlbaniaArgentinaArmeniaAsiaAustraliaAustriaBahamasBangladeshBarbadosBelarusBelgiumBelizeBoliviaBosnia and HerzegovinaBrazilBulgariaBurma/MyanmarCabo VerdeCambodiaCameroonCanadaCaribbeanCentral AmericaChileChinaColombiaCongoCosta RicaCroatiaCubaCzechoslovakiaDenmarkDominicaDominican RepublicEastern AfricaEastern AsiaEastern EuropeEcuadorEgyptEl SalvadorEnglandEritreaEthiopiaEuropeFijiFranceGermanyGhanaGreeceGrenadaGuatemalaGuyanaHaitiHondurasHong KongHungaryIndiaIndonesiaIranIraqIrelandIsraelItalyJamaicaJapanJordanKazakhstanKenyaKoreaKuwaitLaosLatin AmericaLatviaLebanonLiberiaLithuaniaMalaysiaMexicoMicronesiaMiddle AfricaMoldovaMoroccoNepalNetherlandsNicaraguaNigeriaNorth AmericaNorth MacedoniaNorthern AfricaNorthern EuropeNorwayOceaniaPakistanPanamaPeruPhilippinesPolandPortugalRomaniaRussiaSaudi ArabiaScotlandSenegalSerbiaSierra LeoneSingaporeSomaliaSouth AfricaSouth AmericaSouth Central AsiaSouth Eastern AsiaSouthern EuropeSpainSri LankaSt. Vincent and the GrenadinesSudanSwedenSwitzerlandSyriaTaiwanThailandTrinidad and TobagoTurkeyUgandaUkraineUruguayUzbekistanVenezuelaVietnamWest IndiesWestern AfricaWestern AsiaWestern EuropeYemenZaireZimbabweAzores
Unemployment Among Women with Children Ages 6 to 17 years
Income
Poverty
Unemployment
Labor Participation
Family Structure
Vehicle Availability
Education Level
Disability

Sioux Unemployment Among Women with Children Ages 6 to 17 years
Tragic

13.2%
UNEMPLOYMENT | WOMEN W/ CHILDREN 6 TO 17
0.0/ 100
METRIC RATING
339th/ 347
METRIC RANK

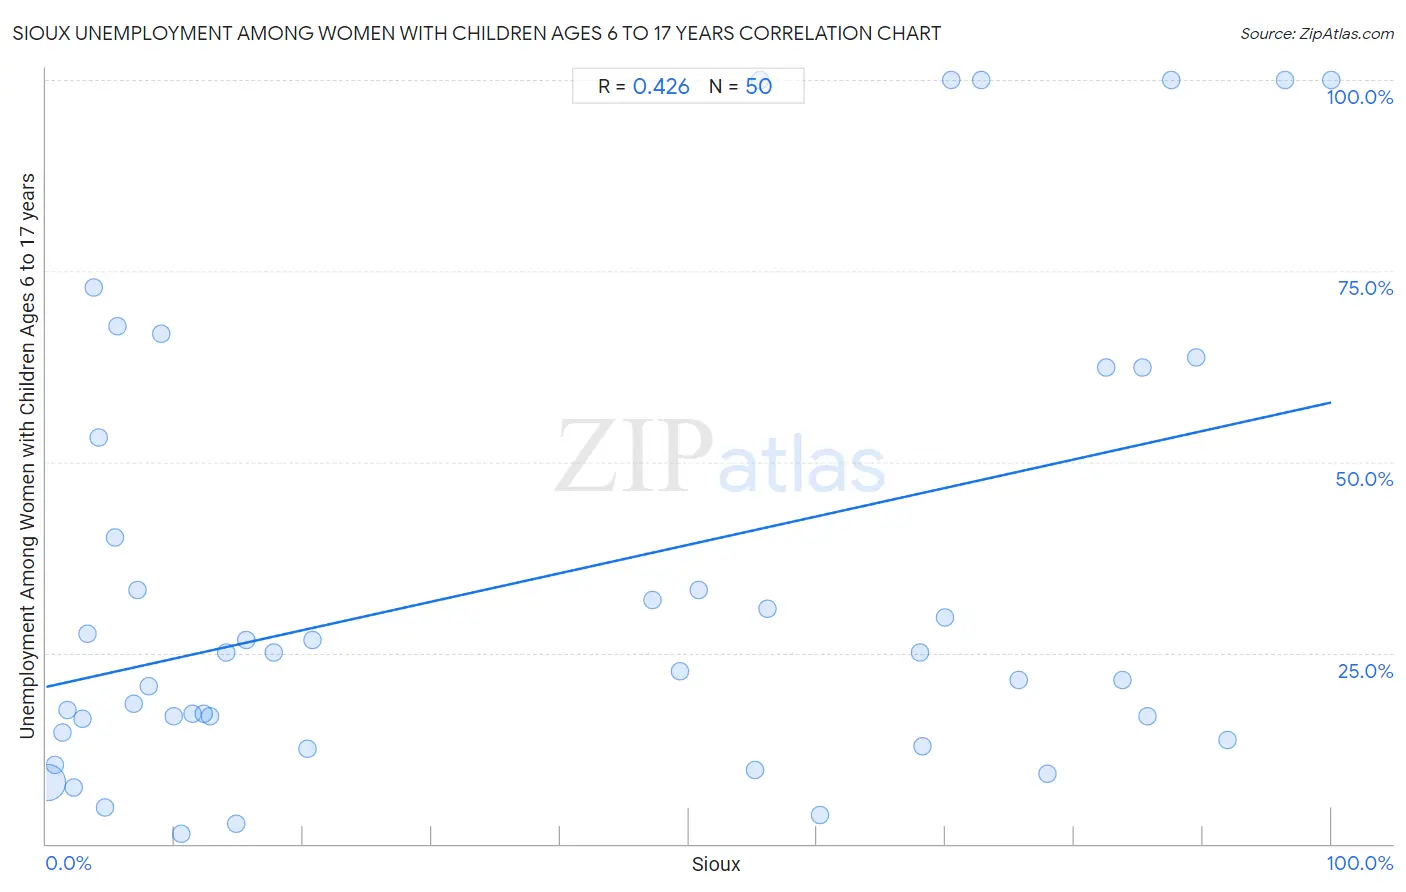
Sioux Unemployment Among Women with Children Ages 6 to 17 years Correlation Chart

The statistical analysis conducted on geographies consisting of 181,726,267 people shows a moderate positive correlation between the proportion of Sioux and unemployment rate among women with children between the ages 6 and 17 in the United States with a correlation coefficient (R) of 0.426 and weighted average of 13.2%. On average, for every 1% (one percent) increase in Sioux within a typical geography, there is an increase of 0.37% in unemployment rate among women with children between the ages 6 and 17.
Sioux Unemployment Among Women with Children Ages 6 to 17 years
It is essential to understand that the correlation between the percentage of Sioux and unemployment rate among women with children between the ages 6 and 17 does not imply a direct cause-and-effect relationship. It remains uncertain whether the presence of Sioux influences an upward or downward trend in the level of unemployment rate among women with children between the ages 6 and 17 within an area, or if Sioux simply ended up residing in those areas with higher or lower levels of unemployment rate among women with children between the ages 6 and 17 due to other factors.

Demographics Similar to Sioux by Unemployment Among Women with Children Ages 6 to 17 years

In terms of unemployment among women with children ages 6 to 17 years, the demographic groups most similar to Sioux are Hopi (12.9%, a difference of 2.7%), Immigrants from Yemen (12.7%, a difference of 4.2%), Puerto Rican (13.9%, a difference of 4.8%), Houma (12.5%, a difference of 6.2%), and Navajo (14.2%, a difference of 6.9%).
DemographicsRating | RankUnemployment Among Women with Children Ages 6 to 17 years
Tsimshian
0.0
/100
|
#332
Tragic
11.4%
Natives/Alaskans
0.0
/100
|
#333
Tragic
11.5%
Ugandans
0.0
/100
|
#334
Tragic
12.0%
Colville
0.0
/100
|
#335
Tragic
12.3%
Houma
0.0
/100
|
#336
Tragic
12.5%
Immigrants from Yemen
0.0
/100
|
#337
Tragic
12.7%
Hopi
0.0
/100
|
#338
Tragic
12.9%
Sioux
0.0
/100
|
#339
Tragic
13.2%
Puerto Ricans
0.0
/100
|
#340
Tragic
13.9%
Navajo
0.0
/100
|
#341
Tragic
14.2%
Yuman
0.0
/100
|
#342
Tragic
14.8%
Inupiat
0.0
/100
|
#343
Tragic
14.9%
Cheyenne
0.0
/100
|
#344
Tragic
16.4%
Arapaho
0.0
/100
|
#345
Tragic
16.8%
Yup'ik
0.0
/100
|
#346
Tragic
18.6%

Sioux Unemployment Among Women with Children Ages 6 to 17 years Correlation Summary

MeasurementSioux DataUnemployment Among Women with Children Ages 6 to 17 years Data
Minimum0.060%1.3%
Maximum100.0%100.0%
Range99.9%98.7%
Mean38.1%34.7%
Median19.0%23.8%
Interquartile 25% (IQ1)6.8%14.6%
Interquartile 75% (IQ3)70.4%53.2%
Interquartile Range (IQR)63.6%38.6%
Standard Deviation (Sample)34.5%30.2%
Standard Deviation (Population)34.2%29.9%

Correlation Details

Sioux PercentileSample SizeUnemployment Among Women with Children Ages 6 to 17 years
[
0.0%
-
0.5%
]
0.060%
178,739,6018.1%
[
0.5%
-
1.0%
]
0.68%
2,159,43810.3%
[
1.0%
-
1.5%
]
1.24%
316,90414.6%
[
1.5%
-
2.0%
]
1.68%
98,02917.4%
[
2.0%
-
2.5%
]
2.10%
136,9007.4%
[
2.5%
-
3.0%
]
2.80%
21,02916.4%
[
3.0%
-
3.5%
]
3.20%
3,31427.4%
[
3.5%
-
4.0%
]
3.74%
3,82872.8%
[
4.0%
-
4.5%
]
4.11%
6,42053.2%
[
4.5%
-
5.0%
]
4.55%
32,3364.7%
[
5.0%
-
5.5%
]
5.33%
13,87640.2%
[
5.5%
-
6.0%
]
5.57%
1,70667.7%
[
6.5%
-
7.0%
]
6.83%
8,45018.4%
[
7.0%
-
7.5%
]
7.06%
8533.3%
[
7.5%
-
8.0%
]
7.96%
77920.7%
[
8.5%
-
9.0%
]
8.96%
1,47366.7%
[
9.5%
-
10.0%
]
9.95%
37216.7%
[
10.5%
-
11.0%
]
10.52%
75,6321.3%
[
11.0%
-
11.5%
]
11.42%
3,27517.0%
[
12.0%
-
12.5%
]
12.23%
6,72116.9%
[
12.5%
-
13.0%
]
12.78%
53216.7%
[
14.0%
-
14.5%
]
14.04%
28525.0%
[
14.5%
-
15.0%
]
14.79%
45,4452.7%
[
15.5%
-
16.0%
]
15.57%
75826.7%
[
17.5%
-
18.0%
]
17.75%
1,01425.0%
[
20.0%
-
20.5%
]
20.30%
73912.5%
[
20.5%
-
21.0%
]
20.76%
47226.7%
[
47.0%
-
47.5%
]
47.15%
2,19531.9%
[
49.0%
-
49.5%
]
49.30%
3,50922.5%
[
50.5%
-
51.0%
]
50.74%
1,34633.3%
[
55.0%
-
55.5%
]
55.13%
5,3899.6%
[
55.5%
-
56.0%
]
55.50%
218100.0%
[
56.0%
-
56.5%
]
56.11%
5,81530.8%
[
60.0%
-
60.5%
]
60.20%
9123.7%
[
67.5%
-
68.0%
]
67.99%
2,00925.0%
[
68.0%
-
68.5%
]
68.23%
3,51612.7%
[
69.5%
-
70.0%
]
69.90%
1,25629.6%
[
70.0%
-
70.5%
]
70.42%
896100.0%
[
72.5%
-
73.0%
]
72.72%
766100.0%
[
75.5%
-
76.0%
]
75.64%
2,27421.4%
[
77.5%
-
78.0%
]
77.87%
4709.1%
[
82.0%
-
82.5%
]
82.46%
2,15562.4%
[
83.5%
-
84.0%
]
83.76%
5,24721.5%
[
85.0%
-
85.5%
]
85.30%
2,57262.4%
[
85.5%
-
86.0%
]
85.74%
1,39616.7%
[
87.0%
-
87.5%
]
87.50%
176100.0%
[
89.5%
-
90.0%
]
89.54%
1,15763.6%
[
91.5%
-
92.0%
]
91.90%
1,66613.6%
[
96.0%
-
96.5%
]
96.40%
500100.0%
[
99.5%
-
100.0%
]
100.00%
1,414100.0%