Zip Codes with the Highest Percentage of Population with a Degree in Liberal Arts and History in Grand Prairie, TX
RELATED REPORTS & OPTIONS
Liberal Arts and History
Grand Prairie
Compare Zip Codes
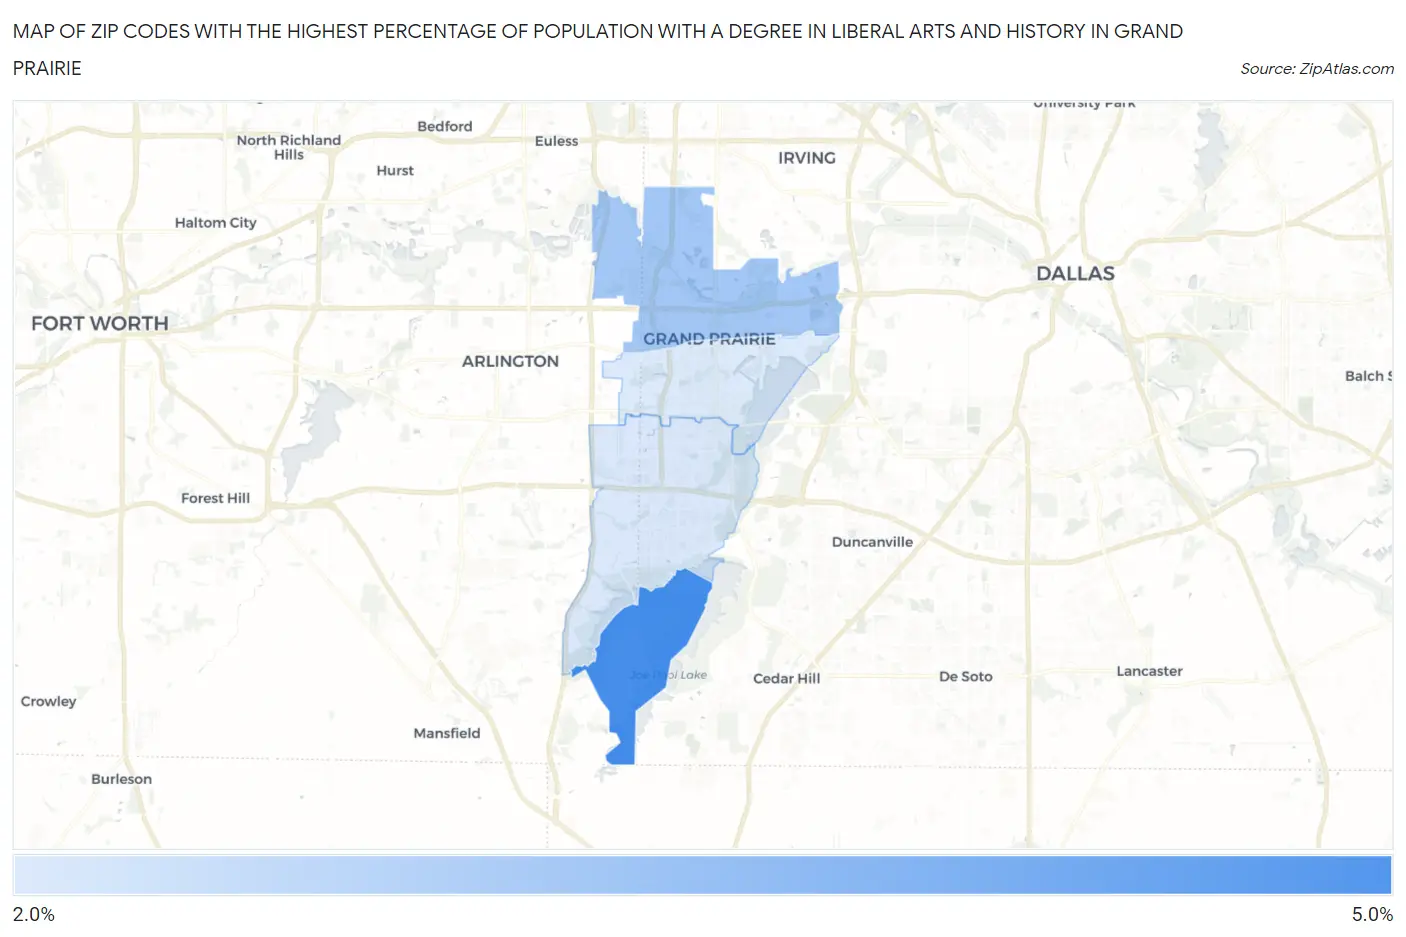
Map of Zip Codes with the Highest Percentage of Population with a Degree in Liberal Arts and History in Grand Prairie
2.0%
4.2%
Zip Codes with the Highest Percentage of Population with a Degree in Liberal Arts and History in Grand Prairie, TX
| Zip Code | % Graduates | vs State | vs National | |
| 1. | 75054 | 4.2% | 4.2%(+0.074)#722 | 4.9%(-0.647)#13,912 |
| 2. | 75050 | 2.9% | 4.2%(-1.29)#1,051 | 4.9%(-2.02)#18,835 |
| 3. | 75052 | 2.1% | 4.2%(-2.09)#1,235 | 4.9%(-2.81)#21,212 |
| 4. | 75051 | 2.0% | 4.2%(-2.12)#1,240 | 4.9%(-2.84)#21,288 |
1
Common Questions
What are the Top 3 Zip Codes with the Highest Percentage of Population with a Degree in Liberal Arts and History in Grand Prairie, TX?
Top 3 Zip Codes with the Highest Percentage of Population with a Degree in Liberal Arts and History in Grand Prairie, TX are:
What zip code has the Highest Percentage of Population with a Degree in Liberal Arts and History in Grand Prairie, TX?
75054 has the Highest Percentage of Population with a Degree in Liberal Arts and History in Grand Prairie, TX with 4.2%.
What is the Percentage of Population with a Degree in Liberal Arts and History in Grand Prairie, TX?
Percentage of Population with a Degree in Liberal Arts and History in Grand Prairie is 2.6%.
What is the Percentage of Population with a Degree in Liberal Arts and History in Texas?
Percentage of Population with a Degree in Liberal Arts and History in Texas is 4.2%.
What is the Percentage of Population with a Degree in Liberal Arts and History in the United States?
Percentage of Population with a Degree in Liberal Arts and History in the United States is 4.9%.