Zip Codes with the Highest Percentage of Population with a Degree in Liberal Arts and History in New Braunfels, TX
RELATED REPORTS & OPTIONS
Liberal Arts and History
New Braunfels
Compare Zip Codes
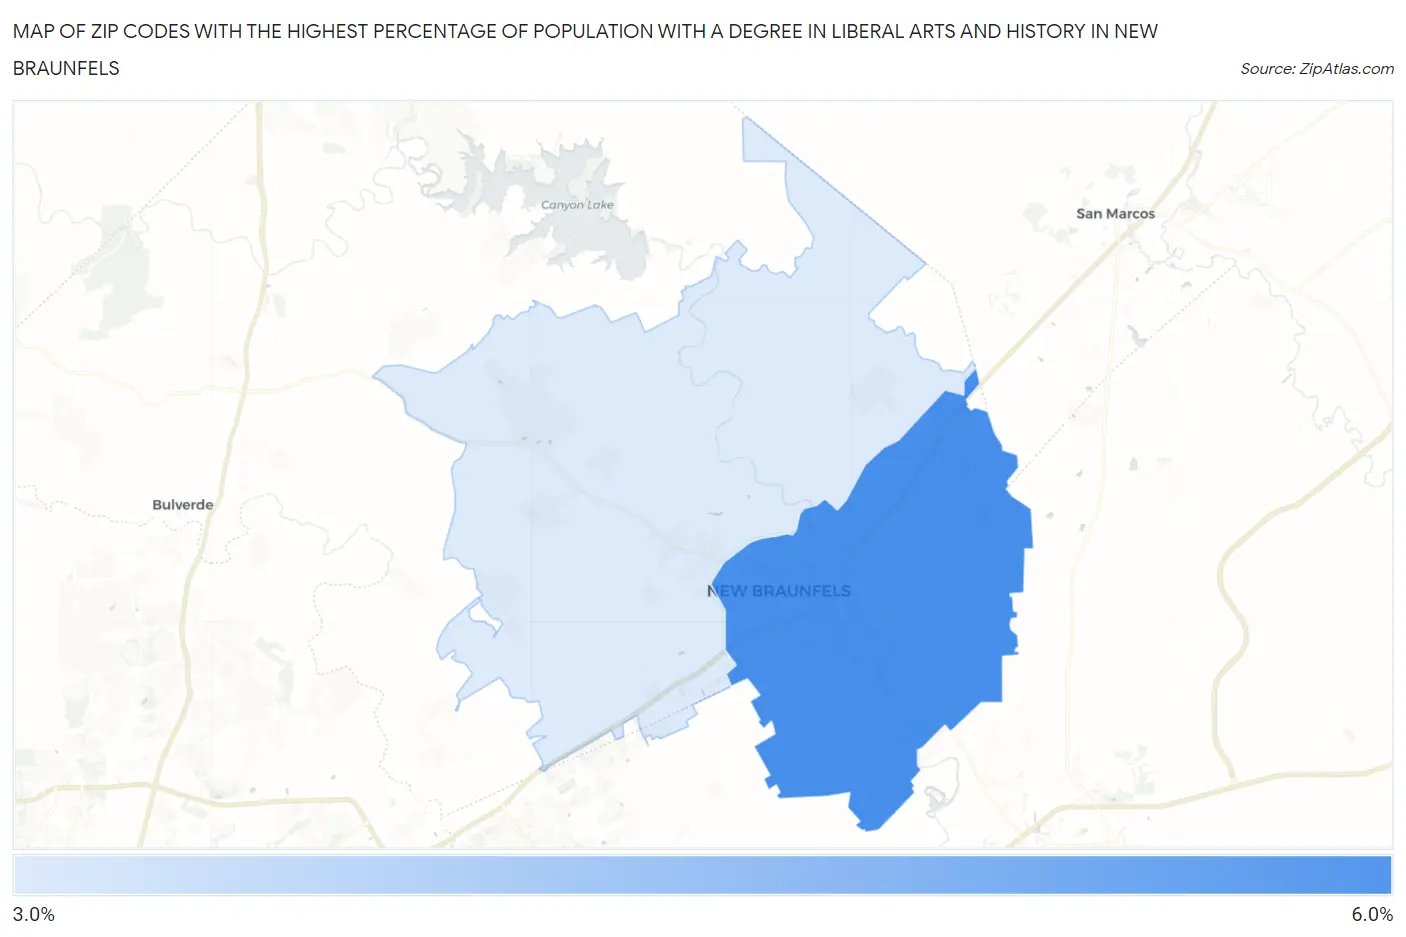
Map of Zip Codes with the Highest Percentage of Population with a Degree in Liberal Arts and History in New Braunfels
3.3%
5.1%
Zip Codes with the Highest Percentage of Population with a Degree in Liberal Arts and History in New Braunfels, TX
| Zip Code | % Graduates | vs State | vs National | |
| 1. | 78130 | 5.1% | 4.2%(+0.940)#553 | 4.9%(+0.219)#11,066 |
| 2. | 78132 | 3.3% | 4.2%(-0.855)#958 | 4.9%(-1.58)#17,332 |
1
Common Questions
What are the Top Zip Codes with the Highest Percentage of Population with a Degree in Liberal Arts and History in New Braunfels, TX?
Top Zip Codes with the Highest Percentage of Population with a Degree in Liberal Arts and History in New Braunfels, TX are:
What zip code has the Highest Percentage of Population with a Degree in Liberal Arts and History in New Braunfels, TX?
78130 has the Highest Percentage of Population with a Degree in Liberal Arts and History in New Braunfels, TX with 5.1%.
What is the Percentage of Population with a Degree in Liberal Arts and History in New Braunfels, TX?
Percentage of Population with a Degree in Liberal Arts and History in New Braunfels is 5.3%.
What is the Percentage of Population with a Degree in Liberal Arts and History in Texas?
Percentage of Population with a Degree in Liberal Arts and History in Texas is 4.2%.
What is the Percentage of Population with a Degree in Liberal Arts and History in the United States?
Percentage of Population with a Degree in Liberal Arts and History in the United States is 4.9%.