Zip Codes with the Highest Percentage of Population with a Degree in Liberal Arts and History in Wichita Falls, TX
RELATED REPORTS & OPTIONS
Liberal Arts and History
Wichita Falls
Compare Zip Codes
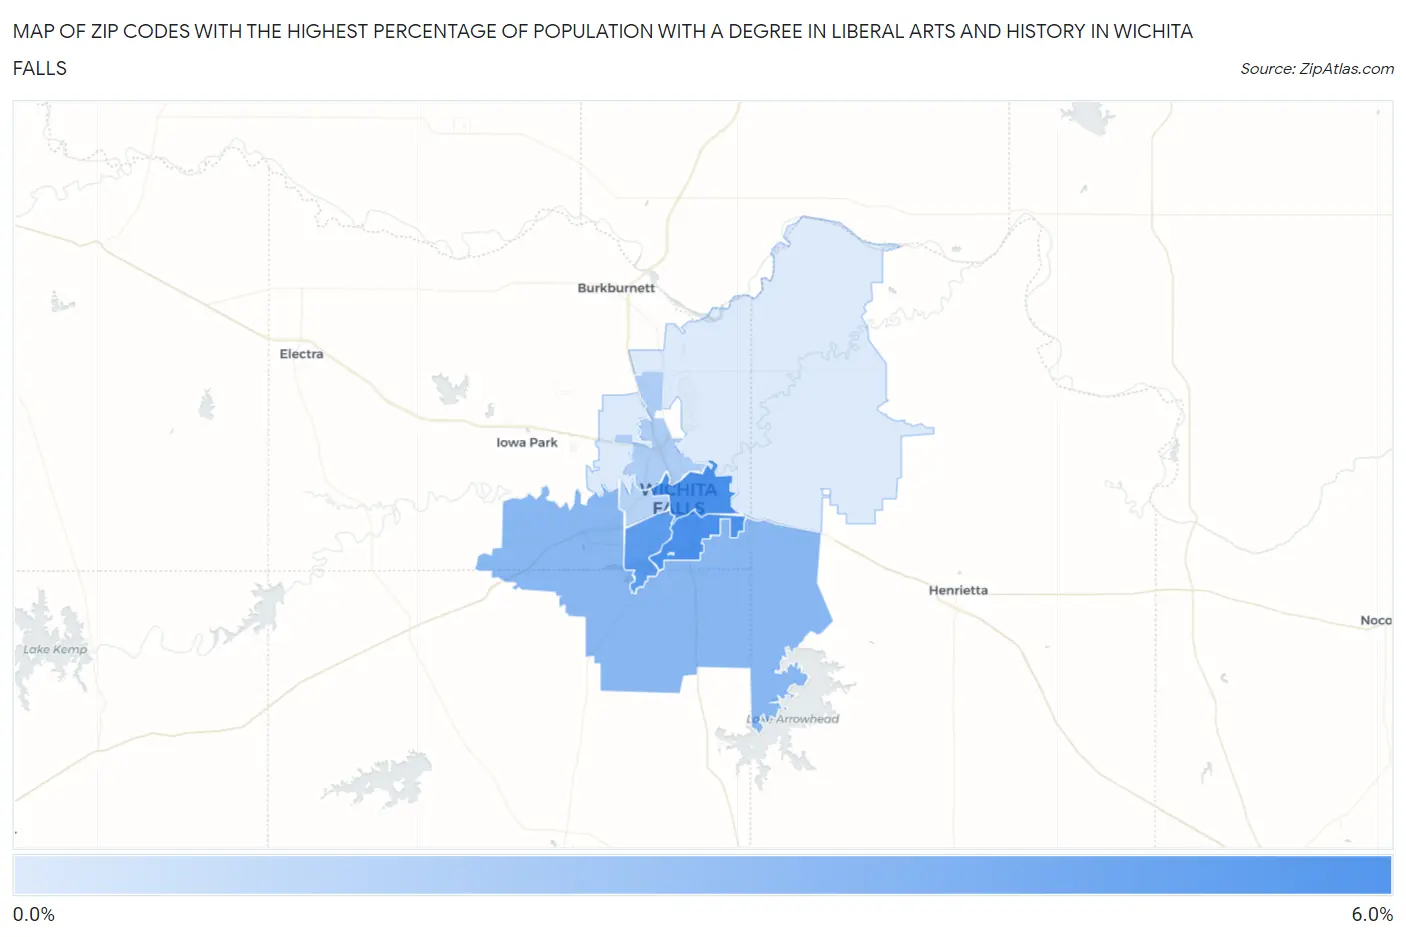
Map of Zip Codes with the Highest Percentage of Population with a Degree in Liberal Arts and History in Wichita Falls
1.2%
5.5%
Zip Codes with the Highest Percentage of Population with a Degree in Liberal Arts and History in Wichita Falls, TX
| Zip Code | % Graduates | vs State | vs National | |
| 1. | 76301 | 5.5% | 4.2%(+1.37)#493 | 4.9%(+0.647)#9,823 |
| 2. | 76302 | 5.4% | 4.2%(+1.28)#507 | 4.9%(+0.560)#10,054 |
| 3. | 76308 | 4.9% | 4.2%(+0.725)#593 | 4.9%(+0.004)#11,728 |
| 4. | 76310 | 3.6% | 4.2%(-0.522)#866 | 4.9%(-1.24)#16,145 |
| 5. | 76306 | 2.6% | 4.2%(-1.58)#1,115 | 4.9%(-2.30)#19,726 |
| 6. | 76309 | 2.3% | 4.2%(-1.89)#1,194 | 4.9%(-2.61)#20,654 |
| 7. | 76305 | 1.2% | 4.2%(-2.99)#1,353 | 4.9%(-3.71)#23,102 |
1
Common Questions
What are the Top 5 Zip Codes with the Highest Percentage of Population with a Degree in Liberal Arts and History in Wichita Falls, TX?
Top 5 Zip Codes with the Highest Percentage of Population with a Degree in Liberal Arts and History in Wichita Falls, TX are:
What zip code has the Highest Percentage of Population with a Degree in Liberal Arts and History in Wichita Falls, TX?
76301 has the Highest Percentage of Population with a Degree in Liberal Arts and History in Wichita Falls, TX with 5.5%.
What is the Percentage of Population with a Degree in Liberal Arts and History in Wichita Falls, TX?
Percentage of Population with a Degree in Liberal Arts and History in Wichita Falls is 4.0%.
What is the Percentage of Population with a Degree in Liberal Arts and History in Texas?
Percentage of Population with a Degree in Liberal Arts and History in Texas is 4.2%.
What is the Percentage of Population with a Degree in Liberal Arts and History in the United States?
Percentage of Population with a Degree in Liberal Arts and History in the United States is 4.9%.