Zip Codes with the Highest Percentage of Population with a Degree in Liberal Arts and History in Allen, TX
RELATED REPORTS & OPTIONS
Liberal Arts and History
Allen
Compare Zip Codes
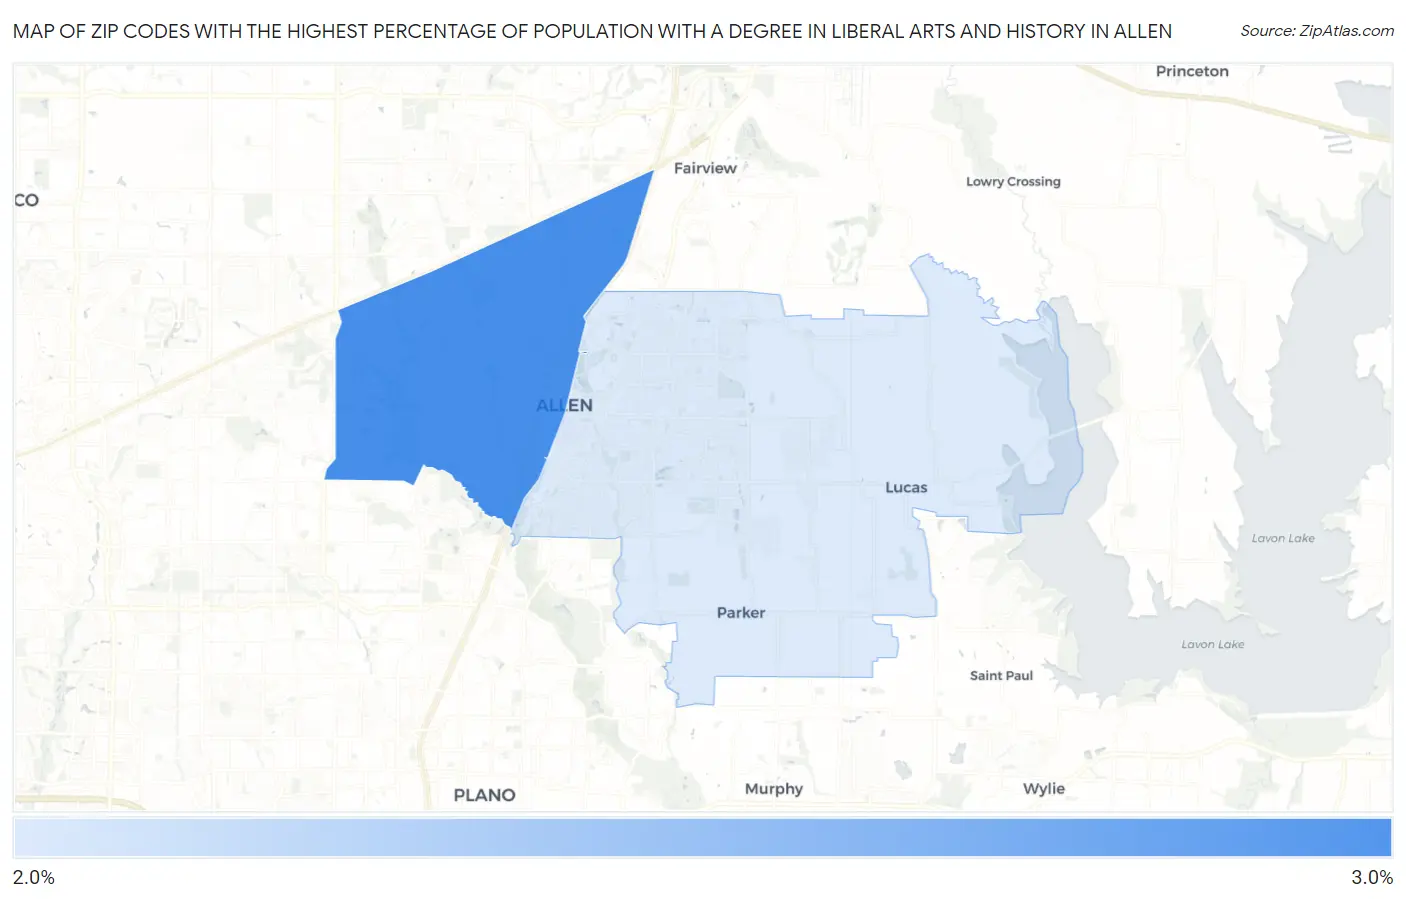
Map of Zip Codes with the Highest Percentage of Population with a Degree in Liberal Arts and History in Allen
2.0%
2.7%
Zip Codes with the Highest Percentage of Population with a Degree in Liberal Arts and History in Allen, TX
| Zip Code | % Graduates | vs State | vs National | |
| 1. | 75013 | 2.7% | 4.2%(-1.41)#1,073 | 4.9%(-2.13)#19,198 |
| 2. | 75002 | 2.0% | 4.2%(-2.14)#1,241 | 4.9%(-2.86)#21,337 |
1
Common Questions
What are the Top Zip Codes with the Highest Percentage of Population with a Degree in Liberal Arts and History in Allen, TX?
Top Zip Codes with the Highest Percentage of Population with a Degree in Liberal Arts and History in Allen, TX are:
What zip code has the Highest Percentage of Population with a Degree in Liberal Arts and History in Allen, TX?
75013 has the Highest Percentage of Population with a Degree in Liberal Arts and History in Allen, TX with 2.7%.
What is the Percentage of Population with a Degree in Liberal Arts and History in Allen, TX?
Percentage of Population with a Degree in Liberal Arts and History in Allen is 2.4%.
What is the Percentage of Population with a Degree in Liberal Arts and History in Texas?
Percentage of Population with a Degree in Liberal Arts and History in Texas is 4.2%.
What is the Percentage of Population with a Degree in Liberal Arts and History in the United States?
Percentage of Population with a Degree in Liberal Arts and History in the United States is 4.9%.