Zip Codes with the Highest Percentage of Population with a Degree in Liberal Arts and History in Arlington, TX
RELATED REPORTS & OPTIONS
Liberal Arts and History
Arlington
Compare Zip Codes
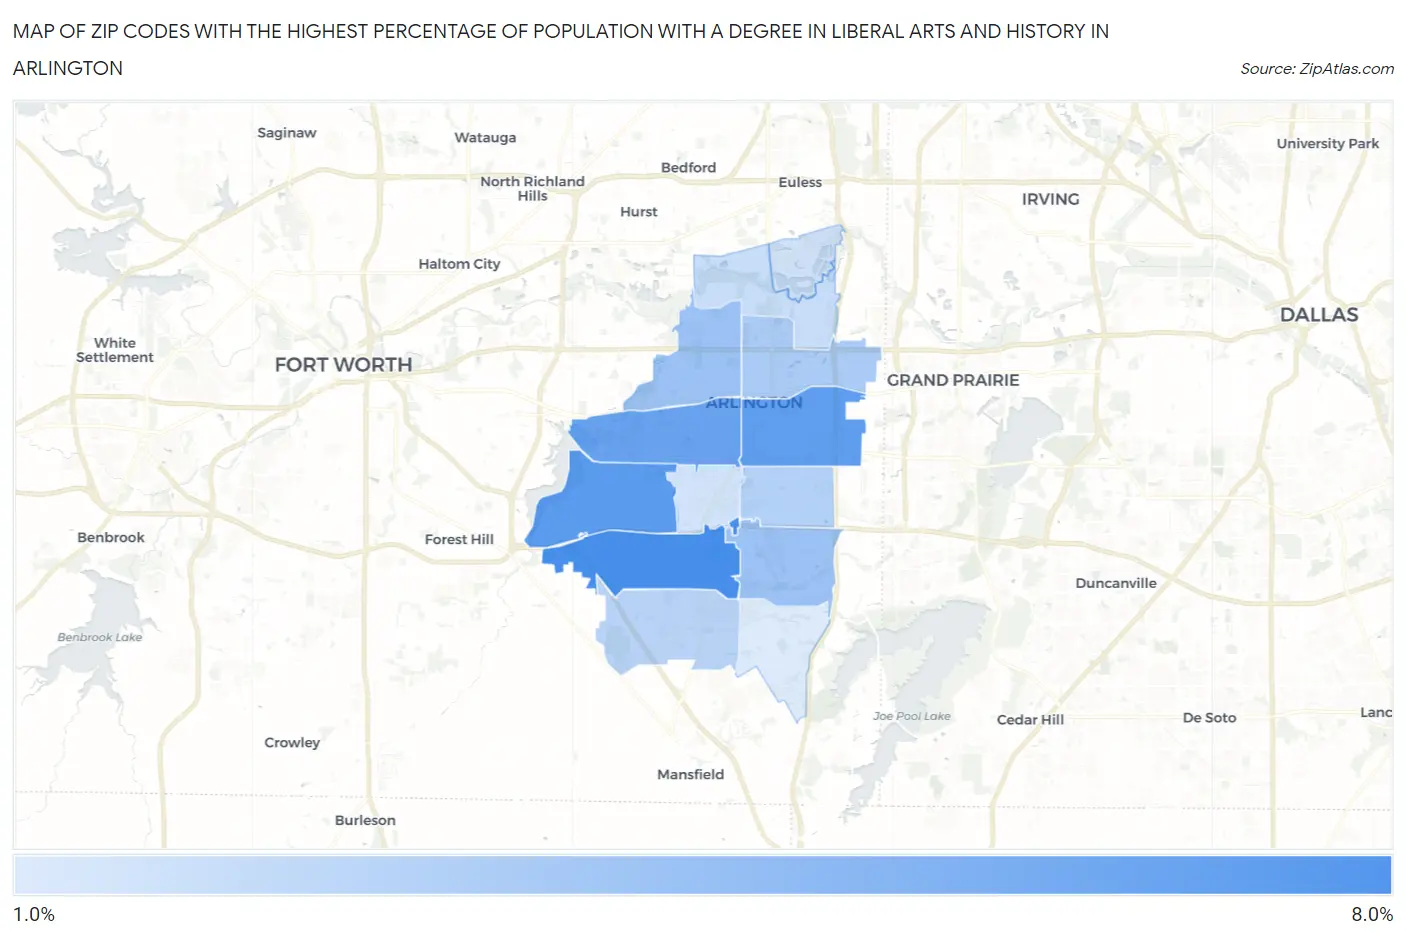
Map of Zip Codes with the Highest Percentage of Population with a Degree in Liberal Arts and History in Arlington
1.6%
7.0%
Zip Codes with the Highest Percentage of Population with a Degree in Liberal Arts and History in Arlington, TX
| Zip Code | % Graduates | vs State | vs National | |
| 1. | 76017 | 7.0% | 4.2%(+2.89)#311 | 4.9%(+2.17)#6,311 |
| 2. | 76016 | 6.3% | 4.2%(+2.20)#382 | 4.9%(+1.48)#7,672 |
| 3. | 76010 | 6.1% | 4.2%(+1.98)#412 | 4.9%(+1.26)#8,184 |
| 4. | 76013 | 5.9% | 4.2%(+1.72)#446 | 4.9%(+0.996)#8,874 |
| 5. | 76018 | 4.0% | 4.2%(-0.173)#790 | 4.9%(-0.894)#14,877 |
| 6. | 76012 | 3.9% | 4.2%(-0.234)#804 | 4.9%(-0.956)#15,117 |
| 7. | 76011 | 3.4% | 4.2%(-0.736)#927 | 4.9%(-1.46)#16,928 |
| 8. | 76014 | 3.1% | 4.2%(-1.04)#992 | 4.9%(-1.76)#17,966 |
| 9. | 76001 | 2.9% | 4.2%(-1.25)#1,040 | 4.9%(-1.97)#18,689 |
| 10. | 76006 | 2.3% | 4.2%(-1.82)#1,178 | 4.9%(-2.54)#20,469 |
| 11. | 76005 | 2.1% | 4.2%(-2.08)#1,229 | 4.9%(-2.80)#21,183 |
| 12. | 76015 | 2.0% | 4.2%(-2.10)#1,238 | 4.9%(-2.82)#21,249 |
| 13. | 76002 | 1.6% | 4.2%(-2.52)#1,296 | 4.9%(-3.24)#22,222 |
1
Common Questions
What are the Top 10 Zip Codes with the Highest Percentage of Population with a Degree in Liberal Arts and History in Arlington, TX?
Top 10 Zip Codes with the Highest Percentage of Population with a Degree in Liberal Arts and History in Arlington, TX are:
What zip code has the Highest Percentage of Population with a Degree in Liberal Arts and History in Arlington, TX?
76017 has the Highest Percentage of Population with a Degree in Liberal Arts and History in Arlington, TX with 7.0%.
What is the Percentage of Population with a Degree in Liberal Arts and History in Arlington, TX?
Percentage of Population with a Degree in Liberal Arts and History in Arlington is 4.3%.
What is the Percentage of Population with a Degree in Liberal Arts and History in Texas?
Percentage of Population with a Degree in Liberal Arts and History in Texas is 4.2%.
What is the Percentage of Population with a Degree in Liberal Arts and History in the United States?
Percentage of Population with a Degree in Liberal Arts and History in the United States is 4.9%.