Zip Codes with the Highest Percentage of Population with a Degree in Liberal Arts and History in Killeen, TX
RELATED REPORTS & OPTIONS
Liberal Arts and History
Killeen
Compare Zip Codes
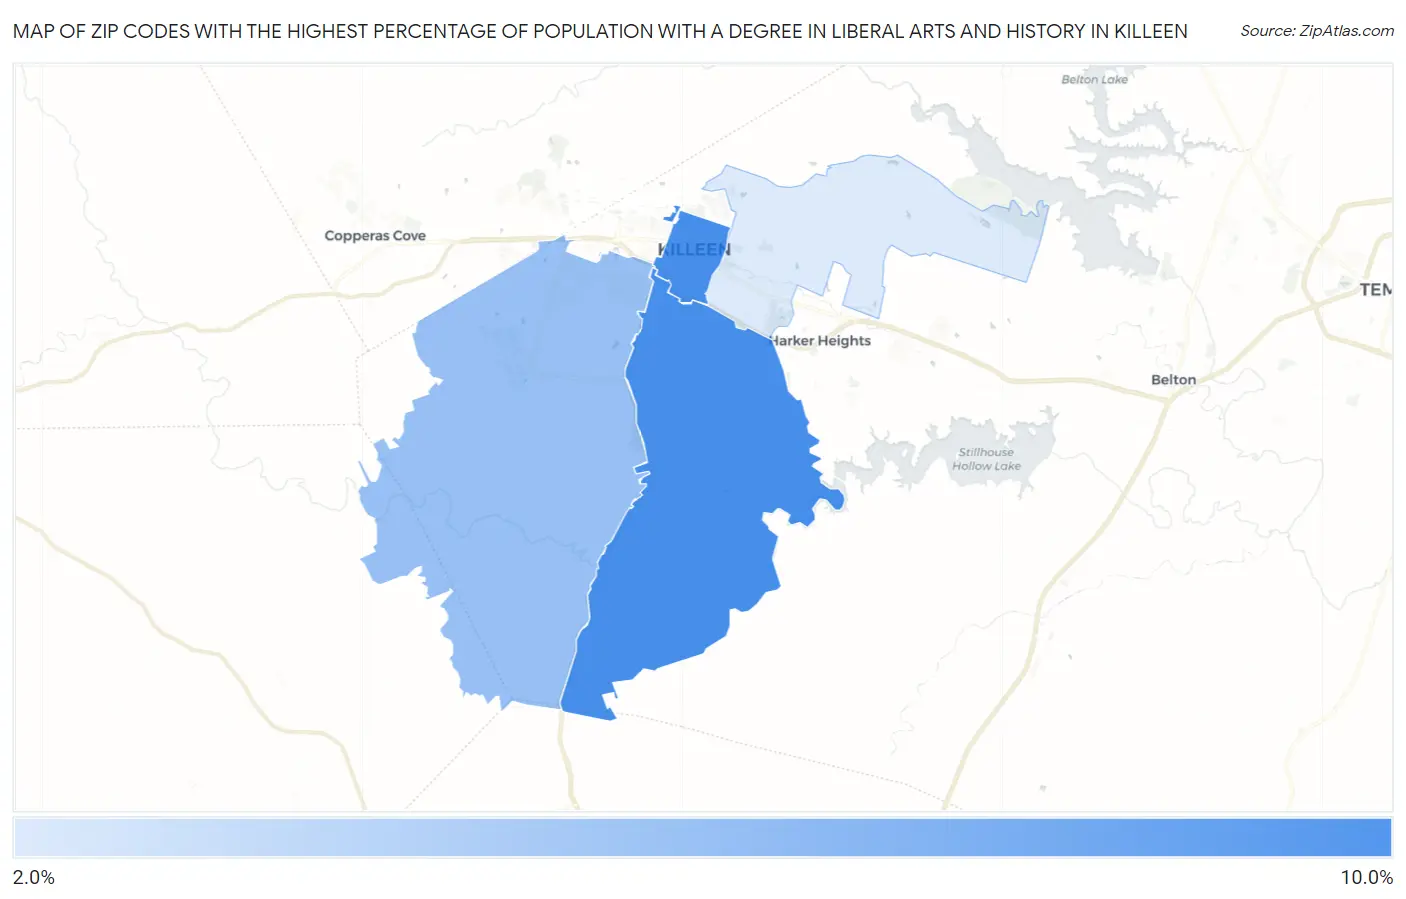
Map of Zip Codes with the Highest Percentage of Population with a Degree in Liberal Arts and History in Killeen
3.0%
8.2%
Zip Codes with the Highest Percentage of Population with a Degree in Liberal Arts and History in Killeen, TX
| Zip Code | % Graduates | vs State | vs National | |
| 1. | 76542 | 8.2% | 4.2%(+4.07)#222 | 4.9%(+3.35)#4,638 |
| 2. | 76541 | 8.2% | 4.2%(+4.06)#223 | 4.9%(+3.34)#4,643 |
| 3. | 76549 | 5.3% | 4.2%(+1.17)#523 | 4.9%(+0.452)#10,365 |
| 4. | 76543 | 3.0% | 4.2%(-1.17)#1,016 | 4.9%(-1.90)#18,440 |
1
Common Questions
What are the Top 3 Zip Codes with the Highest Percentage of Population with a Degree in Liberal Arts and History in Killeen, TX?
Top 3 Zip Codes with the Highest Percentage of Population with a Degree in Liberal Arts and History in Killeen, TX are:
What zip code has the Highest Percentage of Population with a Degree in Liberal Arts and History in Killeen, TX?
76542 has the Highest Percentage of Population with a Degree in Liberal Arts and History in Killeen, TX with 8.2%.
What is the Percentage of Population with a Degree in Liberal Arts and History in Killeen, TX?
Percentage of Population with a Degree in Liberal Arts and History in Killeen is 6.5%.
What is the Percentage of Population with a Degree in Liberal Arts and History in Texas?
Percentage of Population with a Degree in Liberal Arts and History in Texas is 4.2%.
What is the Percentage of Population with a Degree in Liberal Arts and History in the United States?
Percentage of Population with a Degree in Liberal Arts and History in the United States is 4.9%.