Zip Codes with the Highest Percentage of Population with a Degree in Liberal Arts and History in Port Arthur, TX
RELATED REPORTS & OPTIONS
Liberal Arts and History
Port Arthur
Compare Zip Codes
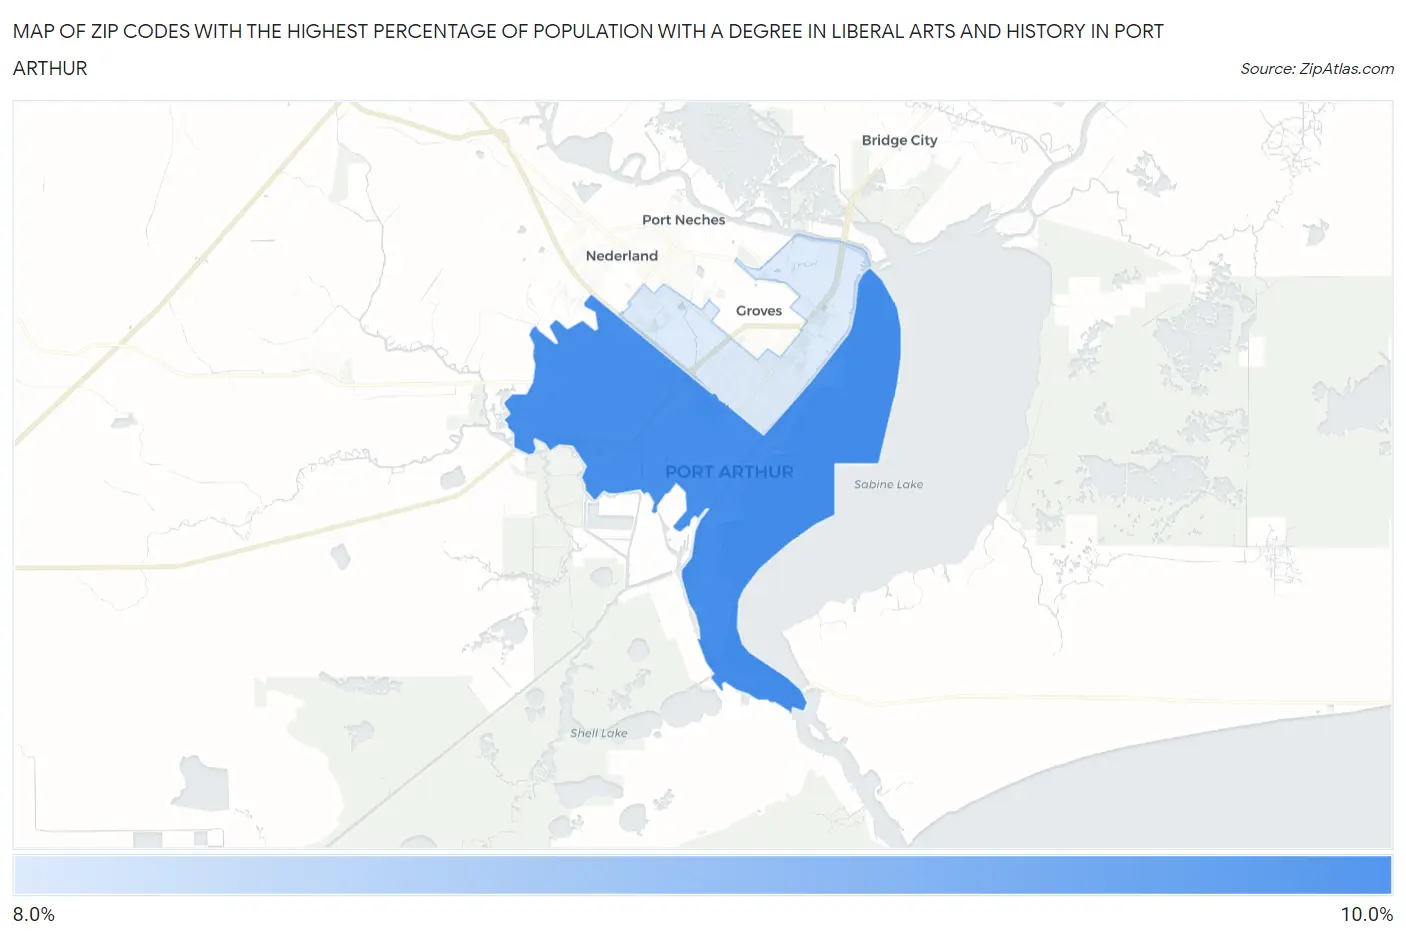
Map of Zip Codes with the Highest Percentage of Population with a Degree in Liberal Arts and History in Port Arthur
8.8%
8.8%
Zip Codes with the Highest Percentage of Population with a Degree in Liberal Arts and History in Port Arthur, TX
| Zip Code | % Graduates | vs State | vs National | |
| 1. | 77640 | 8.8% | 4.2%(+4.67)#195 | 4.9%(+3.95)#4,013 |
| 2. | 77642 | 8.8% | 4.2%(+4.65)#198 | 4.9%(+3.93)#4,031 |
1
Common Questions
What are the Top Zip Codes with the Highest Percentage of Population with a Degree in Liberal Arts and History in Port Arthur, TX?
Top Zip Codes with the Highest Percentage of Population with a Degree in Liberal Arts and History in Port Arthur, TX are:
What zip code has the Highest Percentage of Population with a Degree in Liberal Arts and History in Port Arthur, TX?
77640 has the Highest Percentage of Population with a Degree in Liberal Arts and History in Port Arthur, TX with 8.8%.
What is the Percentage of Population with a Degree in Liberal Arts and History in Port Arthur, TX?
Percentage of Population with a Degree in Liberal Arts and History in Port Arthur is 8.7%.
What is the Percentage of Population with a Degree in Liberal Arts and History in Texas?
Percentage of Population with a Degree in Liberal Arts and History in Texas is 4.2%.
What is the Percentage of Population with a Degree in Liberal Arts and History in the United States?
Percentage of Population with a Degree in Liberal Arts and History in the United States is 4.9%.