Zip Codes with the Highest Percentage of Population with a Degree in Liberal Arts and History in Tomball, TX
RELATED REPORTS & OPTIONS
Liberal Arts and History
Tomball
Compare Zip Codes
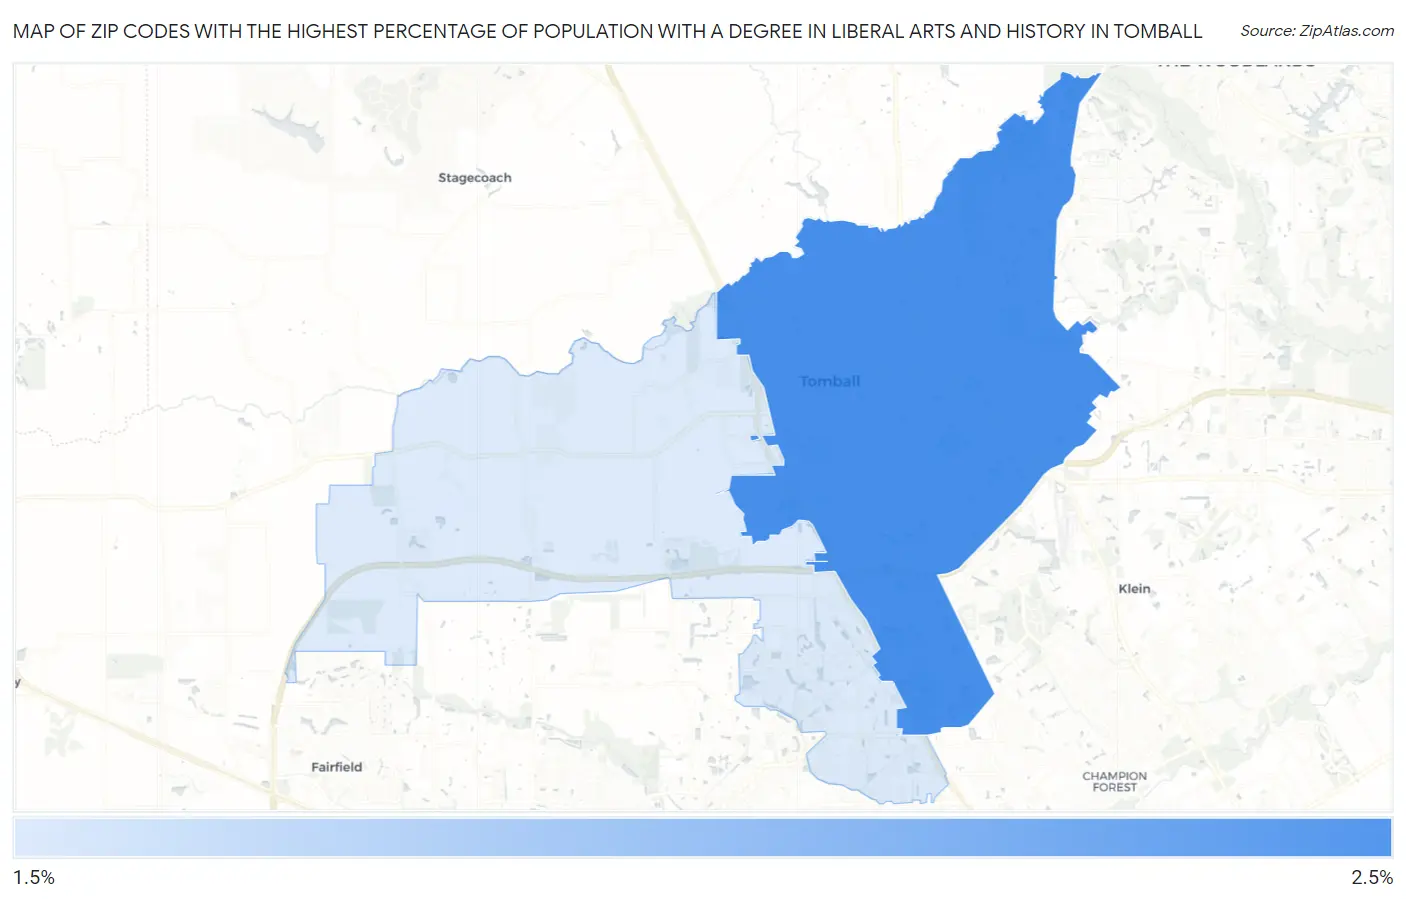
Map of Zip Codes with the Highest Percentage of Population with a Degree in Liberal Arts and History in Tomball
1.7%
2.5%
Zip Codes with the Highest Percentage of Population with a Degree in Liberal Arts and History in Tomball, TX
| Zip Code | % Graduates | vs State | vs National | |
| 1. | 77375 | 2.5% | 4.2%(-1.66)#1,137 | 4.9%(-2.38)#20,006 |
| 2. | 77377 | 1.7% | 4.2%(-2.41)#1,280 | 4.9%(-3.13)#21,986 |
1
Common Questions
What are the Top Zip Codes with the Highest Percentage of Population with a Degree in Liberal Arts and History in Tomball, TX?
Top Zip Codes with the Highest Percentage of Population with a Degree in Liberal Arts and History in Tomball, TX are:
What zip code has the Highest Percentage of Population with a Degree in Liberal Arts and History in Tomball, TX?
77375 has the Highest Percentage of Population with a Degree in Liberal Arts and History in Tomball, TX with 2.5%.
What is the Percentage of Population with a Degree in Liberal Arts and History in Tomball, TX?
Percentage of Population with a Degree in Liberal Arts and History in Tomball is 1.3%.
What is the Percentage of Population with a Degree in Liberal Arts and History in Texas?
Percentage of Population with a Degree in Liberal Arts and History in Texas is 4.2%.
What is the Percentage of Population with a Degree in Liberal Arts and History in the United States?
Percentage of Population with a Degree in Liberal Arts and History in the United States is 4.9%.